A first-principles investigation of the thermodynamic and mechanical properties of Ni-Ti-Sn Heusler and half-Heusler materials
Abstract
First principles calculations of the vibrational, thermodynamic and mechanical properties of the Ni-Ti-Sn Heusler and half-Heusler compounds have been performed. First, we have calculated the Raman and infrared spectra of NiTiSn, providing benchmark theoretical data directly useful for the assignments of its experimental spectra and clarifying the debate reported in the literature on the assignment of its modes. Then, we have discussed the significant vibrational density-of-states of Ni2TiSn at low-frequencies. These states are at the origin of (i) its smaller free energy, (ii) its higher entropy, and (iii) its lower Debye temperature, with respect to NiTiSn. Finally, we have reported the mechanical properties of the two compounds. In particular, we have found that the half-Heusler compound has the largest stiffness. Paradoxically, its bulk modulus is also the smallest. This unusual behavior has been related to the Ni-vacancies that weaken the structure under isostatic compression. Both compounds show a ductile behavior.
I Introduction
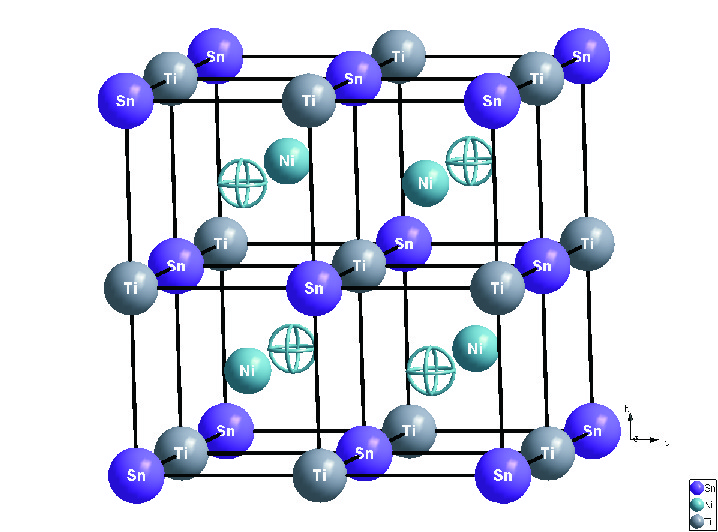
The so-called Heusler and half-Heusler compounds have attracted intensive work during the last years. These compounds are a class of ternary intermetallics associating three elements in the following stoichiometric proportions 1:1:1 (Half-Heusler) or 2:1:1 (full-Heusler). They are represented by the general formula: XYZ and X2YZ, where X and Y are transition elements, and Z is a or -element. From the structural point of view, Heusler (resp. half-Heusler) compounds generally crystallise in the Fmm (resp. F3m) space group with Cu2MnAl (resp. MgAgAs) as prototype pearson (see Fig. 1).
New properties and potential fields of application constantly emerge properties in these materials: topological insulators and spintronics are recent examples. Their properties can be easily predicted by the valence electron concentration (VEC) Felser and their extremely flexible electronic structure offers a lot of possibilities for tailoring these materials for interesting physical applications properties (a detailed analysis of the density of states has been done in a separate study Colinet ). Concerning more specifically the thermoelectric properties which we are interested in, it has been demonstrated that a value of eighteen for the valence electron concentration leads to potentially good materials Xia . Since good thermoelectric materials are typically heavily doped semiconductors (such as degenerated semiconductors), the classes of materials which are presently under investigation include mainly half-Heusler compounds. Half-Heusler compounds, like MNiSn (M = Ti, Zr, Hf), are -type semiconductors with a narrow bandgap (Eg= 0.1–0.5 eV), a high Seebeck coefficient ( -200V/K) and a low electrical resistivity ( 10-4 m). Unfortunately at this time, a relatively high thermal conductivity is known to be around 10 W/mK at 300 K properties ; thermo . Recently, Wee et al. Wee have estimated the thermal conductivity of NiTiSn from a semi-analytic model and have confirmed the experimental findings. A drastic decrease of the thermal conductivity associated to good electronic transport properties is therefore mandatory if this material is to be used in thermoelectric applications thermo2 .
An important contribution to the thermal conductivity is the lattice contribution which is directly connected to the vibrational properties of the compound. In this context, we report, in this paper, a complete theoretical study of the lattice dynamics of Ni2TiSn and NiTiSn, as well as of their thermodynamic and mechanical properties. Our aim is to provide benchmark theoretical data, directly useful for further studies on materials belonging to the Heusler and half-Heusler classes. Surprisingly, no comparison between these two compounds has been proposed so far. Indeed the few studies reported in the literature are devoted to investigate the phonon modes of NiTiSn Popovic ; Mestres ; Wee , whereas those of Ni2TiSn remain presently unexplored to our knowledge, even at the zone-center. Thus, we have studied the correlation between the zone-center phonons and the crystal structures of Ni2TiSn and NiTiSn. For the latter, the calculations of its Raman and infrared spectra allowed us to clarify the debate reported in the literature on the assignment of its phonon modes. Then, within the quasi-harmonic approximation, we have studied the thermodynamic properties of Ni2TiSn and NiTiSn, and we bring new insights into the phonon modes at the origin of their differences. Finally, their mechanical properties are investigated as well. We show that the response of a given material depends on the nature of the stress, which is not only interesting from a fundamental point of view but also has some consequences when the materials are to be used in practical applications.
II Computational details
First-principles calculations of Ni2TiSn (metallic compound) and NiTiSn (semiconducting compound) were performed within the density functional theory (DFT) framework as implemented in the ABINIT package ABINIT . The exchange-correlation energy functional was evaluated using the generalized gradient approximation (GGA) parametrized by Perdew, Burke and Ernzerhof (PBE) PBE or the local density approximation (LDA) parametrized by Perdew and Wang PW . The all-electron potentials were replaced by norm-conserving pseudopotentials generated according to the Troullier-Martins scheme TM . Ni(, ), Ti(, ), and Sn(, )-electrons were considered as valence states. The electronic wave functions were expanded in plane-waves up to a kinetic energy cutoff of 65 Ha and integrals over the Brillouin zone were approximated by sums over a 888 mesh of special -points according to the Monkhorst-Pack scheme Monkhorst . A Fermi-Dirac scheme with a smearing width equal to 0.01 Ha was used for the metallic occupation of Ni2TiSn.
Dynamical matrix, dielectric constants, Born effective charges and elastic tensors were computed within a variational approach to density functional perturbation theory Gonze97 . Phonon dispersion curves were interpolated according to the scheme described by Gonze et al. Gonze . In this scheme, the dipole-dipole interactions are subtracted from the dynamical matrices before Fourier transformation, so that only the short-range part is handled in real space. A 4 4 4 -points grid in the irreducible Brillouin zone was employed for the calculation of the vibrational band structure and the phonon density-of-states (DOS), whereas a denser 120 120 120 -points grid was used for the evaluation of the integrals associated to the thermodynamical properties. The intensity of the NiTiSn Raman lines Veithen04 ; Hermet06 ; BTO was obtained at the LDA level Note and within a nonlinear response formalism taking advantage of the 2+1 theorem.
Structural relaxations were performed until the maximum stresses were less than 110-4 GPa. Our relaxed LDA lattice parameters (5.91 Å for Ni2TiSn and 5.72 Å for NiTiSn) underestimate the experimental ones of about -3% (6.09 Å for Ni2TiSn gorlich and 5.92 Å for NiTiSn ouardi ), whereas GGA (6.21 Å for Ni2TiSn and 6.00 Å for NiTiSn) overcorrects the LDA predictions leading to lattice parameters about +2% larger. These trends are usual in DFT. Our calculated electronic band gap of NiTiSn at the GGA level (E0.49 eV) is strongly overestimated with respect to the experimental value (E0.12 eV) reported by Aliev et al. aliev . This unusual behaviour is not related to a convergence problem of our calculations, but is rather a consequence of the existence of structural defects and/or impurities in NiTiSn crystals that are not considered in our calculations. Our overestimation of the experimental band gap is consistent with previous first-principles calculations of the electronic structure of NiTiSn ouardi ; gap using the GGA exchange–correlation.
III Results and discussion
III.1 Zone-center optical phonon modes
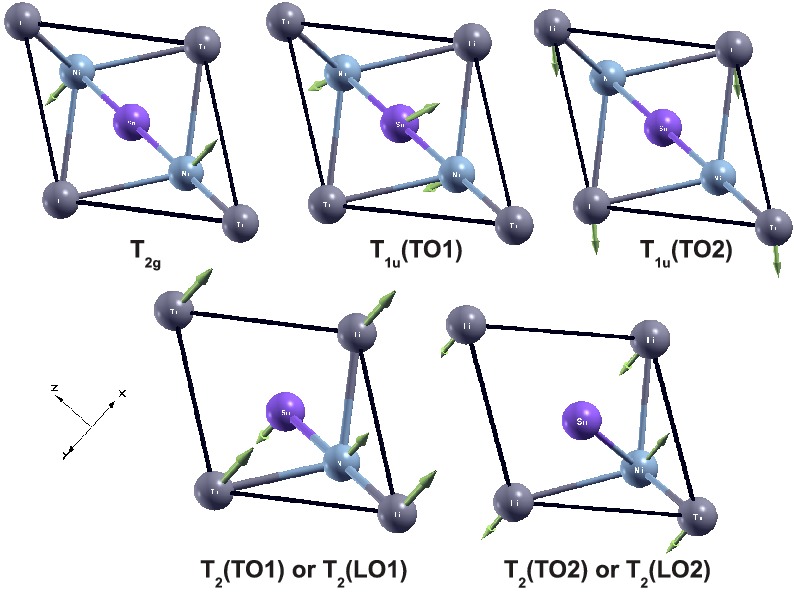
At the zone-center, optical phonon modes of Ni2TiSn can be classified, according to the irreducible representations of the Oh point group, into: . These modes are triply degenerated and they are either infrared (T1u) or Raman (T2g) active. The Raman mode is calculated at 122 cm-1 and it is assigned to antisymmetric motions of Ni-atoms (see Fig. 2). The frequencies of the two infrared modes are calculated at 181 and 237 cm-1. The first mode involves symmetric motions of Ni-atoms counterbalanced by motions of Sn-atoms, whereas the second mode is only dominated by motions of Ti-atoms (Fig. 2). However these frequencies cannot be compared to experiment or previous calculations because Raman or infrared spectra of Ni2TiSn are presently unavailable in the literature. No further investigation of its zone-center phonon modes, like the calculation of infrared and Raman intensities, can be performed within our formalism (Berry phase) due to the metallic character of this compound Note .
In contrast to Ni2TiSn, the NiTiSn structure is represented by four interpenetrating cubic FCC sublatices, one of which being occupied by Ni-vacancies (see Fig. 1). This structure is therefore noncentrosymmetric and belongs to the Td point group. In this case, the previous T2g mode is no longer possible, and the compatibility relations between the Oh and Td groups lead to: T1u T2. Thus, the irreducible representation of the zone-center optical phonons of NiTiSn is reduced to: , where each of these two triply degenerate modes can be both infrared and Raman active. In the literature, phonon assignments of NiTiSn were performed by Raman and infrared spectroscopies using a filiation procedure between three compounds: MeNiSn, with Me = Ti, Zr, Hf Popovic ; Mestres . Accordingly, the frequency of the lowest longitudinal optical (LO) phonon mode is not yet unambiguously identified and some controversies remain about the assignment of the two transverse optical (TO) modes and the remaining LO mode. Thus, to have a reliable assignment of the NiTiSn modes, we performed calculations at LDA and GGA levels to estimate the dependence of the phonon frequencies on the standard exchange–correlation (XC) functionals. These results are listed in Table 1 with the experimental data and a previous first-principles calculation reported in the literature Wee . We observe that most of our frequencies are systematically downshifted with respect to the calculation from Wee et al. Wee , but the two sets of results are however consistent. We attribute these frequency shifts to the different equilibrium structures obtained using different convergence parameters and pseudopotentials PatBFO . We observe that the experimental TO modes are reasonably well predicted by the different XC-functional classes. The experimental frequencies are bounded between those predicted by LDA and GGA with relative errors smaller than 8%. A slightly better agreement with the experimental frequencies is however obtained at the GGA level. The TO1 mode involves motions of the three kinds of atoms, and we assign it to a TiNiSn scissoring (see Fig. 2). This assignment is consistent with the Ti-Ni-Sn motions reported by Popovic et al. Popovic and Wee et al. Wee . We assign the TO2 mode to a TiNiTi out-of-phase wagging where Sn-atoms are not involved (see Fig. 2). This assignment is in agreement with Wee et al. Wee , but in disagreement with Popovic et al. Popovic who reported opposite motions of Ti and Sn-atoms.
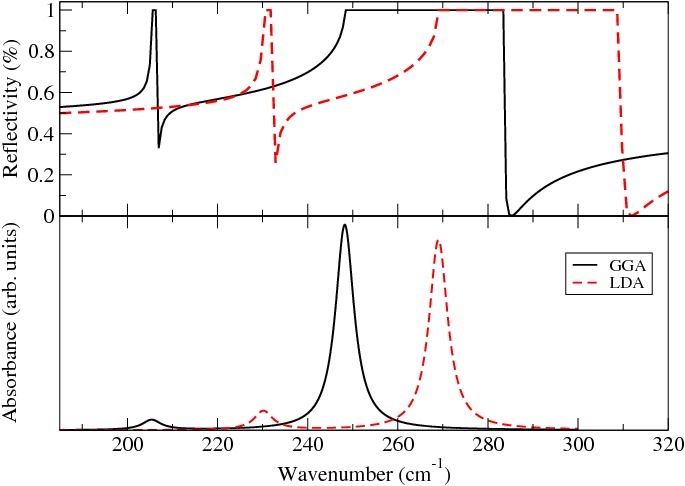
Frequencies of the calculated LO-modes are also reported in Table 1 with the experimental values obtained from the fit of the infrared reflectivity spectrum. Their prediction is expected to be less accurate than for the TO-modes due to typical LDA/GGA inaccuracies. Indeed, the LO-TO splitting depends on the knowledge of the electronic dielectric tensor and on the Born effective charges observed to be dependent on the used functional PatBFO . However, it is interesting to note that both LDA and GGA lead to the same frequency of the LO2 mode (284 cm-1), which is close to the experimental values reported in the 285–292 cm-1 range. Reflectivity spectrum is calculated at normal incidence according to the methodology from Ref. PatNiOH and is displayed in Fig. 3. Since our approach neglects the damping of the phonon modes, the calculated reflectivities saturate to unity. We find a relative good agreement between our calculation and the experimental spectra reported in the literature Mestres ; Popovic (not shown here). We clearly observe that the LO-TO splitting of the TO1-mode is negligible (around 1 cm-1), whereas it reaches 36 cm-1 for the TO2-mode at the GGA level. These observations are in agreement with experimental data Mestres ; Popovic and the calculation from Wee et al. Wee . Concerning now the assignment of the LO-modes to specific motions, we can convincingly assign the LO1 and TO1 modes to the same atomic motions due to their negligible splitting (see Fig. 2). However, in the case of the LO2-mode, its eigendisplacement vectors do not necessarily correspond to the ones of its corresponding TO2-mode due to long-range Coulomb interactions. The possible mixing between the LO2 mode and the TO modes has been calculated according to the overlap matrix Hermet06 :
| (1) |
where the sum runs over the space directions and the atoms , is the mass of the atom, and (resp. , where 1, 2 ) are the eigendisplacement vectors of the LO2-mode (resp. the two TO modes). We found that this mixing is, however, negligible as the LO2-mode overlaps at 99% with the TO2 mode. Thus, as in the case of the LO1-mode, we conclude that the LO2 and the TO2 modes have the same assignment (see Fig. 2).
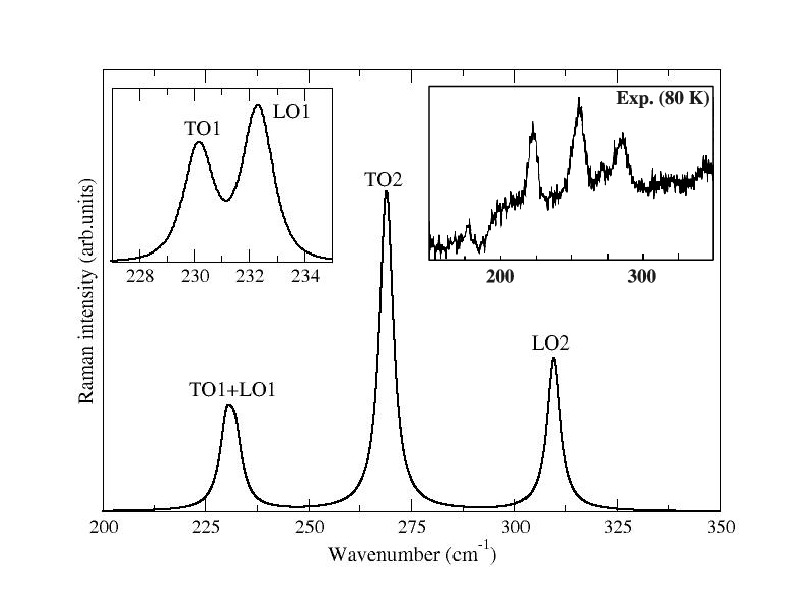
Fig. 4 compares the calculated and experimental Raman spectra of NiTiSn. Frequency positions and relative intensity of the experimental lines are well reproduced by our calculation. The experimental spectrum is dominated by three strong lines centered at 220, 255 and 285 cm-1. The two first lines are assigned to TO-modes by Popovic et al. Popovic and Mestres et al. Mestres , while only the last authors have observed the line at 285 cm-1 assigned to a LO-mode. Our calculations unambiguously support the identification of the TO2 and LO2 lines. In the case of the LO1 line, our calculations show that its intrinsic scattering efficiency should be similar to that of the TO1 line (see Table 2). Thus, the LO1 line remains experimentally unobserved because it overlaps with the TO1 line due to their very close frequencies ( 1 cm-1). This overlap can be avoided for the calculated spectrum since we use a constant linewidth to represent the Raman lines (see inset of Fig. 4, left). The first experimental line at 220 cm-1 should be therefore identified as a juxtaposition of the TO1 and LO1 modes. Five weak lines, not predicted by the group theory (and so not obtained in our calculations), can also be observed in the experimental spectrum around 180, 230, 275, 320 and 340 cm-1. They could therefore be associated to structural defects, inhomogeneities, or impurities in the NiTiSn compound.
To conclude this section, we analyzed the static dielectric permittivity, , of NiTiSn. This tensor can be decomposed as the sum of an electronic () contribution and a contribution of each individual phonon mode () such as Gonze97 ; PatNiOH :
| (2) |
where the sum runs over all modes , is the unit cell volume and is the infrared oscillator strength. Results of this decomposition are reported in Table 3. We observe that is mainly governed by the electronic contribution ( 75%). The latter is significantly underestimated at the LDA and GGA levels (21) with respect to the experimental value (36.5) reported by Popovic et al. Popovic and obtained from the fit of the infrared reflectivity spectrum. This underestimation is consistent with our overestimation of the electronic band gap of NiTiSn, and this problem has been discussed in Sec. II. The phonon contribution to is mainly dominated by the TO2 mode (93%) which combines the largest mode effective charge and oscillator strength. This mode therefore dominates the infrared absorption spectrum of NiTiSn, as observed in Fig. 3.
III.2 Phonon density-of-states and thermodynamic properties
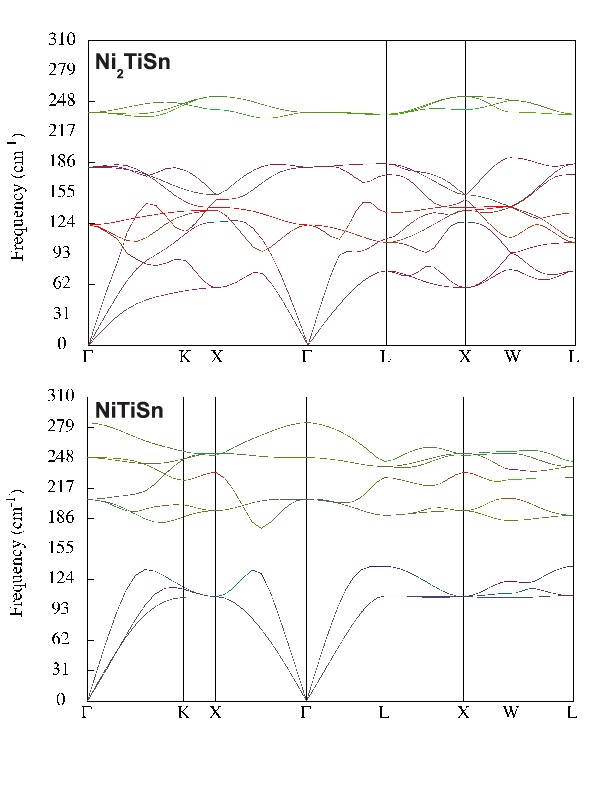
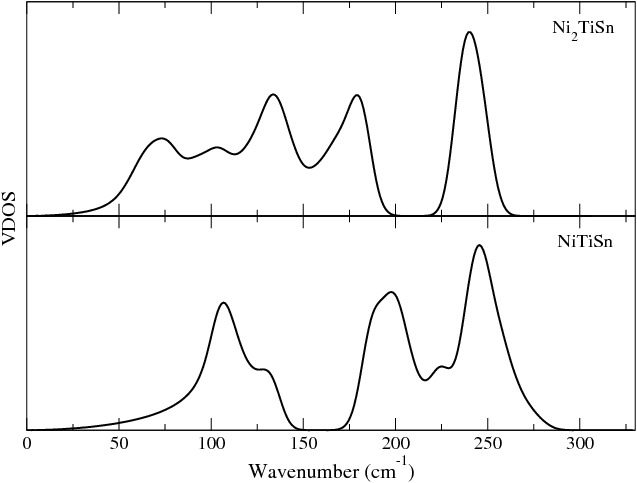
In this section, only our results obtained at the GGA level will be discussed, as they are in better agreement than the LDA ones with the experimental data (lattice parameters and zone-center TO phonons). Phonon dispersion curves give a criterion for the crystal stability and indicate, through the prediction of soft modes, the possible phase transitions. Indeed, if all phonon square frequencies [] are positive, the crystal is locally stable. However, if it appears that some [] are imaginary (soft modes), then the system is unstable. The phonon dispersion curves of Ni2TiSn and NiTiSn, are displayed in Fig. 5 along several high-symmetry directions. First, no soft mode is predicted by our calculations in the whole Brillouin zone at ambient pressure and 0 K. This result supports the absence of a temperature-driven displacive phase transition for both compounds, in agreement with experiments. Then, the acoustic branches of Ni2TiSn and NiTiSn show a significant dispersion. In the case of Ni2TiSn, they exhibit a noticeable mixing with the first low-frequency optical modes in the whole Brillouin zone. So, this compound may have interesting thermal expansion properties PatAgCo . Surprisingly, only the thermal expansion of NiTiSn has been investigated Wee . The contribution of each kind of atom to each branch is also displayed in Fig. 5 using a color code. We observe that the dispersion curves of NiTiSn are dominated by Sn-atoms below 155 cm-1 while both Ni and Ti-atoms are mainly involved above this frequency. In Ni2TiSn, a clear identification of its atomic contributions is much more difficult due to the significant dispersion of the branches below 200 cm-1. This dispersion leads to a quite continuous profile in its vibrational density-of-states (VDOS) spectrum between 0 and 300 cm-1 (see Fig. 6). In contrast, the optical phonon branches of NiTiSn are quite dispersionless within this frequency range, leading to well-isolated peaks in its VDOS spectrum. Indeed, NiTiSn shows a more discrete profile which can be decomposed into three frequency ranges: (i) a peak centered at 100 cm-1 with a shoulder at 125 cm-1, (ii) a phonon gap between 150 and 175 cm-1, and (iii) a complex multipeak structure up to 300 cm-1. Finally, Ni2TiSn has a significant DOS at low frequencies whereas a low density of modes is observed in NiTiSn up to the first peak around 100 cm-1. This last observation suggests that the NiTiSn lattice should have the highest stiffness.
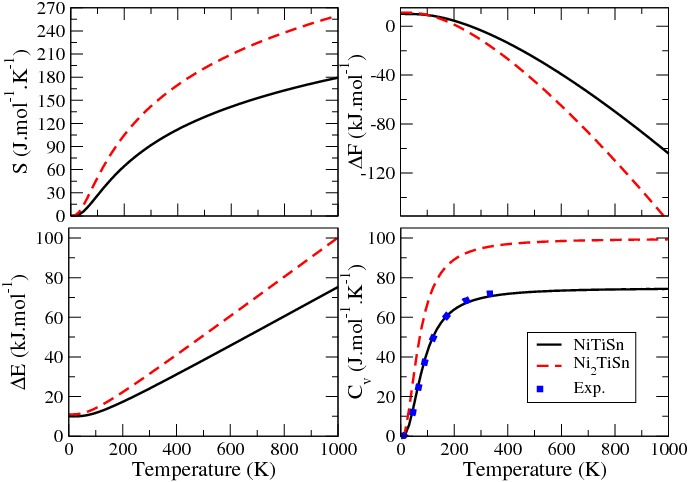
From these DOS, the phonon contributions to entropy, Helmholtz free energy, internal energy, as well as the constant-volume specific heat can be derived according to the quasi-harmonic approximation Maradudin . Phonon contributions to the entropy of both compounds are displayed in Fig. 7. NiTiSn is found to have the lowest entropy over the whole temperature range due to the higher stiffness of its lattice. The zero-temperature value of the Helmholtz free energy and the internal energy do not vanish due to the zero-point motion. It can be calculated from the asymptotic equation:
| (3) |
where is the largest phonon frequency, is the number of atoms per unit cell, is the number of unit cells and is the VDOS. The latter is normalized according to: . We find 11.02 kJ.mol-1 for Ni2TiSn and 9.98 kJ.mol-1 for NiTiSn. When increasing the temperature, the variation of the internal energy shows that the overall profiles between both compounds are similar: it increases with increasing temperature, the energy of Ni2TiSn being the highest. In contrast, the variation of their free energy has an opposite trend. The Ni2TiSn free energy is clearly the lowest above 150 K due to its higher entropy contribution. The constant-volume specific heats (Cv) are displayed in Fig. 7 with the available experimental data reported for NiTiSn these . For Ni2TiSn, only measurements of Cv below 25 K have been reported in the literature to our knowledge aliev ; Boff . First, we observe that our calculations reproduce with a very good agreement the experimental specific heat of NiTiSn below room temperature. Above this temperature, some discrepancies are expected as the anharmonic effects (like thermal expansion) should be explicitly considered. At high temperatures, the specific heats approach the classical Dulong and Petit asymptotic limit: 99.77 J.mol-1.K-1 for Ni2TiSn and 74.83 J.mol-1.K-1 for NiTiSn. The Debye temperature has also been calculated using a linear fit of with respect to at very low temperatures ( 4 K). We expect that NiTiSn has the highest Debye temperature since it is closely related to the stiffness or the melting temperature of a material. Our GGA calculated Debye temperatures are consistent with this assumption, as we found: 360 K (resp. 332 K) for NiTiSn (resp. Ni2TiSn). These values are in fair agreement with the experimental ones: 417 K for NiTiSn Kuentzler and 2906 K for Ni2TiSn Boff . We have not considered the Debye temperatures measured by Aliev et al. aliev for this comparison since Kuentzler et al. Kuentzler reported a possible error in their calculations.
III.3 Mechanical properties
The knowledge of bulk, shear and Young’s moduli and Poisson’s ratio of materials is desirable for possible applications, since strong materials are preferred to weak ones. These mechanical properties are usually derived from the elastic contants. Elastic constants can be described by a fourth-rank tensor (), relating the stress tensor () to the strain tensor (), via the generalized Hooke’s law:
| (4) |
where 1,2,…,6 denote the Cartesian directions given in Voigt notation. This equation can be splitted into two main contributions such as:
| (5) |
The first term is the frozen (clamped) ion elastic tensor, whereas the second term includes contributions from force-response internal stress and displacement-response internal strain. The second term of Eq. 5 also accounts for the ionic relaxations in response to strain perturbations. The addition of the two contributions is the relaxed-ion elastic tensor, . In cubic space groups, these tensors have only three independent elements: , and . The effective elastic moduli of polycrystalline aggregates are usually calculated by two approximations due to Voigt voigt (V) and Reuss reuss (R) who respectively assume an uniform strain or stress throughout the polycrystal. Hill hill has shown that the Voigt and Reuss averages are limits and suggested that the actual effective moduli can be approximated by the arithmetic mean of the two bounds, referred to as the Voigt-Reuss-Hill (VRH) values Wu . The explicit expressions of the bulk () and shear () moduli as a function of elastic constants for cubic systems can be found everywhere grimvall . However for the sake of clarity in the discussion that follows , we report them here:
| (6) |
where
| (7) |
Elastic constants of Ni2TiSn and NiTiSn, calculated at the LDA and GGA levels, are listed in Table 4 with selected mechanical properties such as: bulk, shear and Young’s moduli, and Poisson’s ratio. In a recent publication, Roy et al. vanderbilt have theoretically investigated the electro-mechanical coupling coefficient of a large number of Heusler compounds. In particular, they report the elastic constant of NiTiSn (62 GPa) calculated using the same method of calculation (linear response) and the same DFT code than ours. However, when comparing our results with theirs, supposed to be obtained at the LDA level, we found a close match with our GGA results, suggesting that their results have probably been obtained at the GGA level.
We observe that our LDA results are systematically larger than the GGA ones. Thus, since the tendencies between the Heusler and half-Heusler compounds are the same, we will focus our discussion on the GGA results. Both compounds are mechanically stable because their elastic constants satisfy the Born mechanical stability restrictions for cubic structures Born : . The relaxed-ion elastic constants (physical elastic constants) are usually smaller than the clamped-ion ones, since the additional internal relaxation allows some of the stress to be relieved. However, this trend is only observed for C44, both for Ni2TiSn and NiTiSn. Accordingly, their bulk modulus is independent of any phonon contributions. Phonon contributions to the shear and Young’s moduli are the most important in the case of the half-Heusler compound (see Table 4).
In agreement with our analysis of the VDOS spectra reported in Sec.III.B, NiTiSn has the highest Young’s and shear moduli, suggesting that this compound should be the stiffest. However, we observe that its bulk modulus is also the smallest, which seems paradoxical. To explain this a priori unusual behaviour, one has to focus on the crystal structure of both compounds. The NiTiSn structure is characterized by four interpenetrating fcc lattices one of which being unoccupied. Its Ti-Ni-Sn distances and its unit cell volume are smaller than the ones of Ni2TiSn. Thus, the Ni2TiSn structure is expected to be the most flexible. Accordingly, Ni2TiSn has the smallest Young’s modulus, as it describes tensile elasticity. For the same reasons, its shear modulus is also the smallest. By contrast to Young’s modulus, the bulk modulus describes volumetric elasticity, or the tendency of an object to deform in all directions when uniformly loaded in all directions. It can be considered as an extension of Young’s modulus to three dimensions. Thus, we expect that the Ni-vacancies weaken the NiTiSn structure when the isotropic pressure increases, leading Ni2TiSn to have the largest bulk modulus.
Poisson’s ratios of the two compounds are in the range of the values obtained for steel (NiTiSn) or magnesium (Ni2TiSn). Globally the Heusler compound is more incompressible than the half-Heusler, as suggested by the value of their bulk modulus. Finally, brittle or ductile behavior of both compounds has been estimated according to the value of the ratio, as proposed by Pugh pugh . If 1.75, a ductile behavior is predicted, otherwise the material behaves in a brittle manner. We predict that both compounds are ductile. Although Hichour et al. hichour have reported, using the stress-strain method and DFT calculations at the LDA level, a brittle behaviour for NiTiSn (1.68), our result is, however, consistent. Indeed, we cannot unambiguously conclude the brittle or ductile behavior of NiTiSn using only the LDA results because the two sets of calculations are very close to the limit fixed by Pugh considering the accuracy of the methods used to compute the elastic constants (linear response or stress-strain method, choice of XC–functional and pseudopotentials). Nevertheless, our GGA calculations clearly support the ductile behavior of NiTiSn (2.03) and, as expected, we found that the metallic compound (Ni2TiSn) is more ductile than the semiconducting one (NiTiSn). At the time being, the lack of experimental data does not permit to conclude definitely on the mechanical properties of these compounds.
IV Conclusions
We have performed a thorough comparison of the vibrational and mechanical properties of the Heusler (Ni2TiSn) and half-Heusler compounds (NiTiSn) using density functional perturbation theory. The calculation of the Raman and infrared spectra of NiTiSn allowed us to clarify the debate reported in the literature on the assignment of its modes. Based on the calculation of the phonon density-of-states, we have demonstrated that the significant states of Ni2TiSn at low frequencies are at the origin of (i) its smaller free energy, (ii) its higher entropy, and (iii) its lower Debye temperature, with respect to NiTiSn. We also expect that Ni2TiSn has a larger linear thermal expansion than NiTiSn due to the more important mixing of its acoustic and optic branches. We have also reported the mechanical properties of the two compounds. In agreement with the analysis of the VDOS spectra, NiTiSn has the highest Young’s and shear moduli, supporting that it should be the stiffest. Paradoxically, we found that its bulk modulus is also the smallest. We suggest that this unusual behaviour is related to the ordered Ni-vacancies that weaken the structure of the half-Heusler compound. Both for Ni2TiSn and NiTiSn, we have evidenced that phonons only contribute to the C44 elastic constant, indicating that phonons affect their shear and Young’s moduli, but do not contribute to their bulk modulus. In contradiction with recent LDA results hichour we find that both compounds show a ductile behavior, the largest being for the metallic one.
In this article, we have provided some benchmark theoretical results. Going further in the interpretation would require better experimental characterization of Ni2TiSn and NiTiSn compounds. We hope our work will motivate such experimental studies on these industrially important materials.
Acknowledgements
This work has been realized with the support of the CINES and the HPC@LR computer centers in Montpellier. We thank Jean-Claude Tédenac for helpful discussions.
References
- (1) P. Villars, L. D. Calvert, “Handbook of Crystallographic Data for Intermetallic Phases”, ASM, Metals Park, OH, Release 2010/2011.
- (2) T. Graf, C. Felser, S. S. P. Parkin, Progress in Solid State Chemistry, 2011, 39, 1-50.
- (3) C. Felser, G. H. Fecher, B. Balke, Angew. Chem. Int Ed 2007, 46, 668-699.
- (4) C. Colinet, P. Jund, J. C. Tedenac, to be published.
- (5) Y. Xia, S. Bhattacharya, V. Ponnambalam, A. L. Pope, S. J. Poon, T. M. Tritt, J. Appl. Phys., 2000, 88, 1952
- (6) C. Uher, J. Yang, S. Hu, D. T. Morelli, G. P. Meisner, Phys. Rev. B 1999, 59, 8615-21; Y. Kimura, H. Ueno, Y. Mishima, J Electron Mater 2009 38, 934; W. Xie, Q. Jin, X. Tang, J Appl Phys 2008, 103, 043711; M. Schwall, B. Balke, Appl Phys Lett 2011, 98, 042106; K. Mastronardi, D. Young, C.-C. Wang, P. Khalifah, R. J. Cava, A. P. Ramirez, Appl Phys Lett 1999, 74, 1415
- (7) D. Wee, B. Kozinsky, B. Pavan, M. Fornari, J. Elect. Mat. 2012, 41, 977-983.
- (8) Y. Xia, V. Ponnambalam, S. Bhattacharya, A. L. Pope, S. J. Poon, T. M. Tritt, J Phys. Condens Matter 2001, 13, 77-89; S. Bhattacharya, A. L. Pope, R. T. Littleton, T. M. Tritt, V. Ponnambalam, Y. Xia, S. J. Poon, Appl Phys Lett 2000, 77, 2476; P. Qui, X. Huang, X. Chen, L. Chen, J Appl Phys 2009, 106, 103703.
- (9) Z. V. Popovic, G. Kliche, R. Liu, F. G. Aliev, Solid State Commun. 1990, 74, 829-832.
- (10) N. Mestres, J. M. Calleja, F. G. Aliev, A. I. Belogorokhov, Solid State Comm. 1994, 91, 779-784.
- (11) X. Gonze, B. Amadon, P. M. Anglade, J. M. Beuken, F. Bottin, P. Boulanger, F. Bruneval, D. Caliste, R. Caracas, M. Cote, et al. Comput. Phys. Comm. 2009, 180, 2582-2615.
- (12) J. P. Perdew, K. Burke, M. Ernzerhof, Phys. Rev. Lett. 1996, 77, 3865-3868.
- (13) J. P. Perdew, Y. Wang, Phys. Rev. B 1992, 45, 13244-13249.
- (14) N. Troullier, J. L. Martins, Phys. Rev. B 1991, 43, 1993-2006.
- (15) H. J. Monkhorst, J. D. Pack, Phys. Rev. B 1976, 13, 5188-5192.
- (16) X. Gonze, C. Lee, Phys. Rev. B 1997, 55, 10355-10368.
- (17) X. Gonze, J.-C. Charlier, D. C. Allan, M. P. Teter, Phys. Rev. B 1994, 50, 13035-13038.
- (18) M. Veithen, X. Gonze, Ph. Ghosez, Phys. Rev. Lett. 2004, 93, 187401.
- (19) P. Hermet, M. Veithen, Ph. Ghosez, J. Phys.: Condens. Matter 2007, 19, 456202.
- (20) P. Hermet, M. Veithen, Ph. Ghosez, J. Phys.: Condens. Matter 2009, 21, 215901.
- (21) The computation of the Raman tensor is presently restricted to semiconducting materials and to the LDA level inside ABINIT.
- (22) E. A. Görlich, K. Latka, A. Szytula, D. Wagner, R. Kmiec, K. Ruebenbauer, Solid State Commun. 1978, 25, 661-663.
- (23) S. Ouardi, G. H. Fecher, B. Balke, X. Kozina, G. Styganyuk, C. Felser, S. Lowitzer, D. Ködderitzsch, H. Ebert, E. Ikenaga, Phys. Rev. B 2010, 82, 085108.
- (24) F. G. Aliev, V. V. Kozyrkov, V. V. Moshchalkov, R. V. Scolozdra, K. Durczewski, Z. Phys. B–Condensed Matter 1990, 80, 353-357.
- (25) V. A. Romaka, P. Rogl, V. V. Romaka, E. K. Hlil, Yu, V. Stadnyk, S. M. Budgerak, Semiconductors 2011, 45, 850-856; L. L. Wang, L. Miao, Z. Y. Wang, W. Wei, R. Xiong, H. J. Liu, J. Shi, X. F. Tang, J. Appl. Phys. 2009, 105, 013709; H. Hazama, R. Asahi M. Matsubara, T. Takeuchi, J. Electron. Mater. 2010, 39, 1549-1553; M. Ameri, A. Touia, R. Khenata, Y. Al-Douri, H. Baltache, Optik 2013, 124, 570-574.
- (26) M. Goffinet, P. Hermet, D. I. Bilc, Ph. Ghosez, Phys. Rev. B 2009, 79, 014403.
- (27) P. Hermet, L. Gourrier, J.-L. Bantignies, D. Ravot, T. Michel, S. Deabate, P. Boulet, F. Henn, Phys. Rev. B 2011, 84, 235211.
- (28) P. Hermet, J. Catafesta, J.-L. Bantignies, C. Levelut, D. Maurin, A. B. Cairns, A. L. Goodwin, J. Haines, J. Phys. Chem. C 2013, 117, 12848-12857.
- (29) A. A. Maradudin, E. W. Montroll, E. H. Weiss, I. P. Iaptova, Theory of Lattice Dynamics in the Harmonic Approximation, 2rd Eds., Academic, New York, 1971.
- (30) B. Zhong, Master’s Thesis, Iowa State University, 1997.
- (31) M. A. S. Boff, G. L. F. Fraga, D. E. Brandao, A. A. Gomes, T. A. Grandi, Phys. Stat. Sol. (a) 1996, 154, 549.
- (32) R. Kuentzler, R. Clad, G. Schmerber, Y. Dossmann, J. Magn. Magn. Mater. 1992, 104-107, 1976-1978.
- (33) W. Voigt, Lehrbuch de Kristallphysik, Terubner, Leipzig, (1928).
- (34) A. Reuss, Z. Angew. Math. Mech. 1929, 9, 49.
- (35) R. Hill, Proc. Phys. Soc. London A 1952, 65, 349.
- (36) Z. J. Wu, E. J. Zhao, H. P. Xiang, X. F. Hao, X. J. Liu, J. Meng, Phys. Rev. B 2007, 76, 054115.
- (37) G. Grimvall, ”Thermophysical properties of materials” Elsevier ed. (1999).
- (38) A. Roy, J. W. Bennett, K. M. Rabe, D. Vanderbilt, Phys. Rev. Lett. 2012, 109, 037602.
- (39) M. Born and K. Huang, in Dynamical Theory of Crystal Lattices, Oxford U.P. (1955).
- (40) S. F. Pugh, Philos. Mag. 1954, 45, 823.
- (41) M. Hichour, D. Rached, R. Khenata, M. Rabah, M. Merabet, A. H. Reshak, S. Bin Omran, R. Ahmed, J. Phys. Chem. Solids 2012, 73, 975-981.
| Experiments | Calculations | |||||||||||
| Raman | Infrared | GGA | LDA | |||||||||
| Ref. Mestres | Ref. Popovic | Ref. Mestres | Ref. Popovic | Present | Ref. Wee | Present | Ref. Wee | |||||
| (80 K) | (300 K) | (80 K) | (300 K) | (0 K) | (0 K) | (0 K) | (0 K) | |||||
| TO1 | 220 | 222 | - | 222.8 | 205 | 219 | 230 | 236 | ||||
| TO2 | 255 | 254 | 266 | 257 | 248 | 248 | 269 | 260 | ||||
| LO1 | - | - | - | 223.2 | 206 | 220 | 231 | 237 | ||||
| LO2 | 285 | - | 292 | 287.5 | 284 | 281 | 284 | 293 | ||||
| (cm-1) | (Bohr-3/2) | (cm-1) | (Bohr-3/2) | ||
|---|---|---|---|---|---|
| TO1 | 230 | 0.0087 | TO2 | 269 | 0.0207 |
| LO1 | 232 | 0.0115 | LO2 | 310 | -0.0234 |
| GGA | LDA | ||||||
| 22.51 | 19.88 | ||||||
| TO1 | 1.21 | 1.24 | 0.47 | 2.29 | 1.74 | 0.83 | |
| TO2 | 24.93 | 4.93 | 6.72 | 23.11 | 4.69 | 6.12 | |
| Total (Phonons) | 7.19 | 6.95 | |||||
| Total | 29.70 | 26.83 | |||||
| Ni2TiSn | NiTiSn | |||||||||||
| GGA | LDA | GGA | LDA | |||||||||
| Clamped | Relaxed | Clamped | Relaxed | Clamped | Relaxed | Clamped | Relaxed | |||||
| 172.28 | 172.28 | 218.34 | 218.34 | 196.41 | 196.41 | 273.50 | 273.50 | (264.94) | ||||
| 127.41 | 127.41 | 172.71 | 172.71 | 82.16 | 82.16 | 92.25 | 92.25 | (89.24) | ||||
| 75.27 | 75.07 | 98.24 | 95.39 | 77.69 | 60.61 | 100.90 | 83.29 | (87.85) | ||||
| 142.37 | 142.37 | 187.92 | 187.92 | 120.24 | 120.24 | 152.67 | 152.67 | (147.81) | ||||
| 54.14 | 54.02 | 68.07 | 66.36 | 69.46 | 59.22 | 96.79 | 86.22 | |||||
| 38.76 | 38.73 | 42.30 | 41.98 | 67.91 | 59.17 | 96.52 | 86.08 | |||||
| 46.45 | 46.37 | 55.19 | 54.17 | 68.69 | 59.19 | 96.66 | 86.15 | (87.84) | ||||
| 125.67 | 125.49 | 150.80 | 148.26 | 173.10 | 152.54 | 239.44 | 217.53 | (219.96) | ||||
| 0.35 | 0.35 | 0.37 | 0.37 | 0.26 | 0.29 | 0.24 | 0.26 | (0.25) | ||||
| 3.07 | 3.07 | 3.41 | 3.47 | 1.75 | 2.03 | 1.58 | 1.77 | (1.68) | ||||