DPF2013-127
Measurement of Inclusive Production of Light Charged Hadrons at BABAR
David Muller
For the BABAR Collaboration
SLAC National Accelerator Laboratory
Stanford, CA 94309, USA
Inclusive hadron production cross sections in collisions shed light on the fundamental fragmentation and hadronization processes. We present measurements of the inclusive spectra of charged pions, kaons and protons in hadronic events at a center-of-mass energy of 10.54 . These results are compared with theoretical predictions and the predictions of three hadronization models. Along with previous measurements at higher energies, they are also used to study the scaling properties of hadron production.
PRESENTED AT
DPF 2013
The Meeting of the American Physical Society
Division of Particles and Fields
Santa Cruz, California, August 13–17, 2013
1 Introduction
The production of “jets” of hadrons from energetic quarks and gluons in high-energy collisions is understood qualitatively, but there are few quantitative theoretical predictions. Detailed measurements of jet structure provide a probe of the confining property of the strong interaction, and an empirical understanding of jets is vital to much ongoing work in high-energy physics, where much known and new physics manifests iteself in the form of jets. Identified hadrons probe the dependence of this process on the hadron mass and quantum numbers, such as spin, baryon number, etc., as well as on the parton flavor. Here we present measurements [1] of the production of , and in events at a center-of-mass (CM) energy of , where there are four active quark flavors. We use a high-quality sample of data recorded with the BABAR detector, which features excellent and well understood tracking and particle identification.
2 Analysis
We select hadronic events with low bias in the track multiplicity and momentum by making requirements on the event vertex, topology and visible energy, the direction of the thrust axis, and the content in low-multiplicity events. The efficiency is 70% and the sample of 2.2 million events contains three nonnegligible backgrounds: 4.5% of the events are -pairs, which are well modeled and can be subtracted reliably; radiative Bhabha events are measured in the data and contribute only 0.1% of the events, but several percent of the highest-momentum tracks identified as ; and two-photon events are limited from the data to a level well below that of the -pairs.
Within these events, we select charged tracks with good particle identification information and low bias on particle type by making requirements on the numbers of hits and the extrapolation to both the event vertex and the particle identification subsystems. The efficiency is about 80% with a small dependence on momentum and polar angle in the laboratory frame, except for the requirement of 200 in momentum transverse to the beam axis. This efficiency is measured in the data with a relative uncertainty below 1% above 1 , and increasing to 2–5%, depending on particle type, as the momentum decreases to 0.2 . These requirements remove decay products of and weakly decaying strange baryons, which are sometimes included in such measurements. We report both “prompt” and “conventional” results, excluding and including such tracks, respectively.
Tracks are identified as pions, kaons, or protons using a combination of energy loss in the tracking chambers and angles measured in the Cherenkov detector. The algorithm is optimized for high purity and smooth variation with and . Correct identification efficiencies are above 99% for below 0.6 , above 90% below 2.5 , and then fall off at higher . Misidentification rates are at most 5% and typically below 2%; not all tracks are identified.
We divide the selected tracks into six regions in and 45 bins in . In each bin and region, we count the numbers of tracks identified as , and , apply the inverse of the matrix of (mis)identification efficiencies, and check that the sum of the resulting numbers of true , and is consistent with the total number of selected tracks, within the uncertainties of the efficiency matrix. Dividing by the number of selected events and the bin width, we obtain the raw production rates, , .
We subtract the backgrounds expected from the three classes of non-hadronic events discussed above, as well as those due to beam-related particles, photon conversion and other interactions in the detector material, and residual decays of and weakly decaying strange baryons. Dividing by the track finding efficiency and normalizing to the number of hadronic events in the sample, we obtain prompt corrected production rates in the laboratory frame, .
In each region, we transform these rates into the the CM frame to obtain . This includes corrections for resolution, energy loss and initial state radiation, and also model-dependent transfer matrices and acceptance factors. The former are sensistive to the true distributions, which are the objects of this measurement, so we adopt an iterative procedure in which the simulated distribution is reweighted to match the data, the matrices are recalculated, and the transformation is repeated. This procedure converges in two iterations. The acceptance is insensitive to but sensitive to the angular distribution. We check this by comparing the results from the six regions, which would show a specific pattern of differences if the simulated distribution were incorrect. The six results are consistent within the expected uncertainties, and this also limits several other potential systematic effects, which would produce different patterns of differences.
3 Results
Averaging over the regions contributing to each bin, we obtain the prompt differential production rates per hadronic event shown in Fig. 1 as the filled symbols, and adding the strange-particle decay products gives the conventional rates, shown as the open symbols. The measurements cover the range from 0.2 to the beam energy, including most of the and spectra and the peak and high side of the spectrum. The prompt and conventional results are indistinguishable for , as the only difference is from baryon decays. For , there is a few-percent difference over most of the range due to decays, and up to 10% more at low due to strange baryon decays. For there is a 40% difference over most of the range.
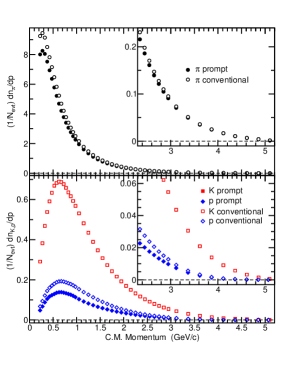
The statistical uncertainties are smaller than the data points, and the systematic uncertainties are strongly correlated over both short and long ranges. There is a 1% normalization uncertainty. Those from tracking are fully correlated, total as much as 5% at 0.2 , and decrease rapidly with increasing . Those from backgrounds and particle identification grow with to as much as 5% and 50% in the the highest bin, and show full and 4–6 bin correlations, respectively.
In Fig. 1 we compare our prompt results with previous results from the ARGUS experiment [2] at the slightly lower of 9.98 . While our results are much more precise statistically and extend to higher , their low- and coverage is better, and the systematic uncertainties are comparable. Above 1 the results are consistent. Below that, the ARGUS measurements fall below ours as decreases, consistent with the small scaling violation expected from the difference in .
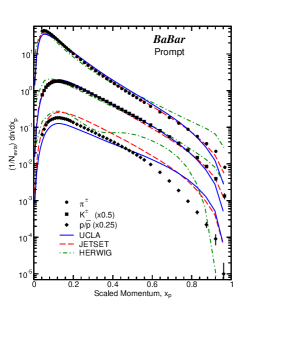
We compare with the predictions of three hadronization models in Fig. 1, using in each case the default parameter values. Although some models reproduce some spectra at some values, the overall decsription of the data is poor. Various tuned parameter sets exist and some come closer to the amplitudes of some spectra, but none reproducess the shapes. Similar differences are seen when comparing conventional spectra, and these data should prove useful in obtaining better tunes.
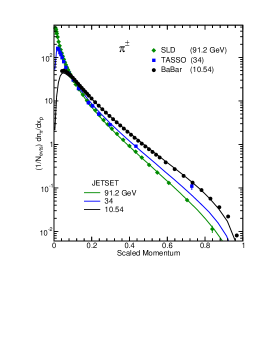
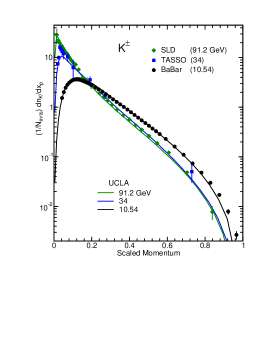
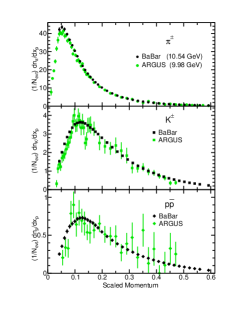
We study the scaling properties of these spectra by comparing our conventional results with data from the TASSO [3] and SLD [4] experiments, which have the most useful high- data at 34 and 91 , respectively. Other data at these energies are consistent, and give the same conclusionns. We also generate spectra from each of the hadronization models at each of these energies. The pion spectra at these three energies are shown in Fig. 2, along with the predictions of the JETSET model. A substantial scaling violation is visible at high due to the running of the strong coupling. Above 0.2 in , the JETSET spectrum is within a few percent of our data and also describes the data at other , and hence describes the scaling properties well. The other two models also describe the scaling violation, even though they do not describe the data well at any energy.
A similar plot for is shown in Fig. 2. Here, the simulated scaling violation between 34 and 91 appears small due to the different flavor composition at the , and the 34 data are of limited use. The UCLA model is shown, as it describes our high- data best, but the other models have similar scaling properties. They predict about 15% more scaling violation than is observed. The data have a total experimental uncertainty of about 6%, but uncertainties in the flavor dependence make it difficult to draw any conclusion.
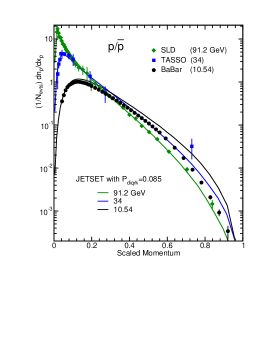
A similar plot for is shown in Fig. 2, using the JETSET model with the diquark probability reduced to 0.085, which describes the SLD data well; again the other models have similar scaling properties. They predict a much larger scaling violation than is observed: the difference is about 80% for 0.40.7, and at higher the data from the two energies become consistent with no scaling violation.
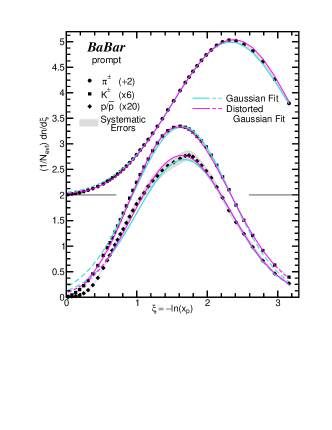
We test the predictions of QCD in the Modified Leading Logarithm approximation, combined with the anzatz of local parton-hadron duality, using our measured spectra in the variable . Our spectra are shown in Fig. 3; this variable emphasizes the low- region and allows the bulk of the spectra to be visible on a linear vertical scale. The spectra show the slow rise from zero at (the beam momentum) and “humpbacked plateau” predicted by MLLA-QCD. The theory predicts that the spectra should be well described by a Gaussian function within about 1 unit of the peak position , and over a wider range by a slightly distorted Gaussian function. We find this to be the case, show our fits over the widest ranges giving a good fit (P()0.01) on Fig. 3, and give these ranges and values in Table 1.
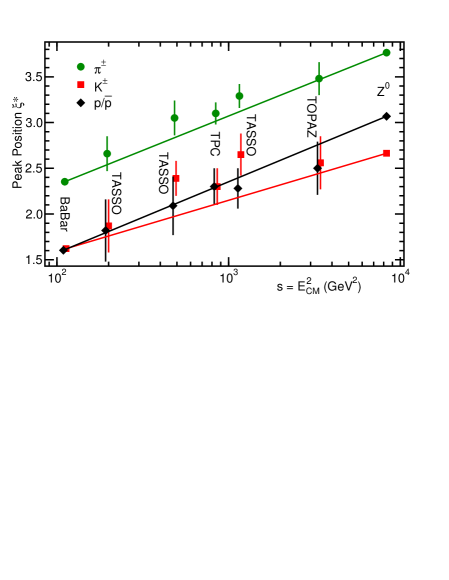
MLLA QCD also predicts that the value of should decrease exponentially with mass for a given CM energy and increase logarithmically with energy for a given particle type. Our fitted for is lower than for (see Table 1), but that for is not lower than for . This behavior is similar to that observed at higher energies, where meson and baryon values each decrease with mass, but on different trajectories. We compare our values with those from higher energies in Fig. 3. Our values and those from the experiments are much more precise than the rest, and have been used to define the lines in the figure. The other points are consistent with a logarithmic energy dependence, but more precise measurements are needed. The slopes of the pion and lines are similar, while that of the difffers somewhat, perhaps due to the changing flavor composition of hadronic events with energy.
We derive total rates per event by integrating the spectra over the measured range and extrapolating across the unmeasured region. The extrapolation is model dependent, and we use a combination of hadronization models and distorted Gaussian fits to estimate corrections and uncertainties. This uncertainty is dominant for and substantial for and . Results are given in Table 1. They are consistent with, and more precise than, previous measurements at or near our , and are not well predicted by any of the hadronization models.
| Maximum range | |||||
|---|---|---|---|---|---|
| Particle | Yield/Event | Gaussian | Distorted | ||
| 6.070.16 | 2.3370.009 | 0.92–3.27 | 0.22–3.27 | ||
| Prompt | 0.9720.020 | 1.6220.006 | 0.63–2.58 | 0.34–3.05 | |
| 0.1850.006 | 1.6470.019 | 0.56–3.27 | 0.48–3.27 | ||
| 6.87 0.19 | 2.3530.009 | 0.87–3.27 | 0.67–3.27 | ||
| Conventional | 0.9720.020 | 1.6220.006 | 0.63–2.58 | 0.34–3.05 | |
| 0.2650.008 | 1.6040.013 | 0.71–2.58 | 0.48–3.27 | ||
4 Summary
In summary, we have measured the differential and total inclusive production rates for , and in hadronic annihilations at 10.54 , both excluding (prompt) and including (conventional) the decay products of and weakly decaying strange baryons. The measurements cover the range from 0.2 to the kinematic limit, and improve upon the precision and coverage of previous measurements at or near this .
These results can be used to test and tune hadronization models. None of the models tested is able to describe the shape or amplitude of the data with its default parameter settings. With higher energy data, the scaling properties of the hadronization process can be studied. The models are able to describe the high- scaling of from 10.54 to 91.2 well, but fail to describe that for . The shapes of the spectra at low (high ) are well described by MLLA QCD, as well as the dependence of the peak position on and hadron mass, except that that for is not lower than that for .
References
- [1] J.P. Lees, et al. (BABAR Collaboration), Phys. Rev. D 88, 032011 (2013).
- [2] H. Albrecht et al. (ARGUS Collaboration), Z. Phys. C 44, 547 (1989).
- [3] W. Braunschweig et al. (TASSO Collaboration), Z. Phys. C 42, 189 (1989).
- [4] K. Abe et al. (SLD Collaboration), Phys. Rev. D 69, 072003 (2004).