Grain Destruction in a Supernova Remnant Shock Wave
Abstract
Dust grains are sputtered away in the hot gas behind shock fronts in supernova remnants, gradually enriching the gas phase with refractory elements. We have measured emission in C IV 1550 from C atoms sputtered from dust in the gas behind a non-radiative shock wave in the northern Cygnus Loop. Overall, the intensity observed behind the shock agrees approximately with predictions from model calculations that match the Spitzer 24 m and the X-ray intensity profiles. Thus these observations confirm the overall picture of dust destruction in SNR shocks and the sputtering rates used in models. However, there is a discrepancy in that the CIV intensity 10′′ behind the shock is too high compared to the intensities at the shock and 25′′ behind it. Variations in the density, hydrogen neutral fraction and the dust properties over parsec scales in the pre-shock medium limit our ability to test dust destruction models in detail.
1 Introduction
Destruction of dust by supernova remnant (SNR) shock waves controls the dust/gas ratio in the ISM (Draine, 2009; Dwek & Scalo, 1980; Dwek, 1998). In SNRs, it also controls the gas phase abundances of refractory elements such as C, Si and Fe, which are highly depleted in the pre-shock gas but contribute strongly to SNR X-ray spectra. It also determines the infrared cooling rate, which dominates over the X-ray cooling rate in shocks faster than about 400 (Arendt et al., 2010a). However, the destruction rate is poorly known (Nozawa et al., 2006), and different types of grains are destroyed at different rates (Serra Diaz-Cano & Jones, 2008).
In radiative shock waves, in which the density increases as the gas cools, grains collide with each other at high speed due to betatron acceleration. The colliding grains shatter, altering the size distribution (Shull, 1978; Borkowski & Dwek, 1995; Jones et al., 1996; Slavin et al., 2004). In non-radiative shocks, for which the cooling time is large compared to dynamical time scales, sputtering dominates over grain shattering (Borkowski et al., 2006). SNR shocks faster than 300 are typically non-radiative (Cox, 1972). In the shocked plasma, proton and He++ collisions sputter atoms off the grains (Draine & Salpeter, 1979). The grains initially move at 3/4 of the shock speed relative to the plasma, and they gradually slow down due to gas drag and Coulomb drag. For a shock moving perpendicular to the magnetic field (quasi-perpendicular shock), the motion is gyrotropic, while for a quasi-parallel shock the motion is along the flow direction. Until a grain slows down due to gas drag, its sputtering rate is enhanced by the increased collision speed. This nonthermal sputtering is especially important at moderate shock speeds up to about 400 (Dwek et al., 1996), typical of middle-aged SNRs such as the Cygnus Loop. Laboratory studies and computer simulations give sputtering rates (Bianchi & Ferrara, 2005), but the simulated surfaces may differ from actual interstellar grains, and therefore the rates are uncertain.
Spitzer observations have provided important new constraints on the mass, size distribution, temperature distribution and destruction rates of ISM grains in SNRs. Borkowski et al. (2006) and Williams et al. (2006, 2011) constructed models of grain heating and destruction in non-radiative shocks to match Spitzer observations of young LMC SNRs. The spectra and intensities could be matched by models with fairly standard parameters, but the inferred pre-shock dust-to-gas ratio in the ambient gas near the LMC remnants was typically 1/5 the average LMC value obtained from extinction studies (Weingartner & Draine, 2001). Arendt et al. (2010a) studied the dust destruction in Puppis A, and the change in grain size distribution did not match that expected from parameters derived from X-ray spectra. Winkler et al. (2013) find evidence for a higher grain destruction rate in SN1006 than expected.
Most dust destruction in the ISM occurs in shocks at modest speeds in middle-aged SNRs simply because they account for most of the volume swept out during SNR evolution. A detailed Spitzer study of grain destruction in the Cygnus Loop was carried out by Sankrit et al. (2010). They obtained 24 m and 70 m images of a non-radiative shock in the northern Cygnus Loop. Relatively faint optical and UV emission is produced in a narrow ionization zone just behind the shock, and it provides several diagnostics for plasma temperatures (Chevalier & Raymond, 1978; Ghavamian et al., 2001). Because the shock is non-radiative, there is no significant contribution of emission lines to the IR spectrum (Williams et al., 2011). The Cygnus Loop was chosen for this investigation because it is bright, and because the small foreground E(B-V) means that it can be observed in the UV. It is also nearby, 640 pc (Blair et al., 2009; Salvesen et al., 2009), so that the dust destruction zone is spatially resolved by X-ray and IR instruments. Sankrit et al. (2010) selected a region where the shock parameters had been determined from H, UV and X-ray observations (Ghavamian et al., 2001; Raymond et al., 2003).
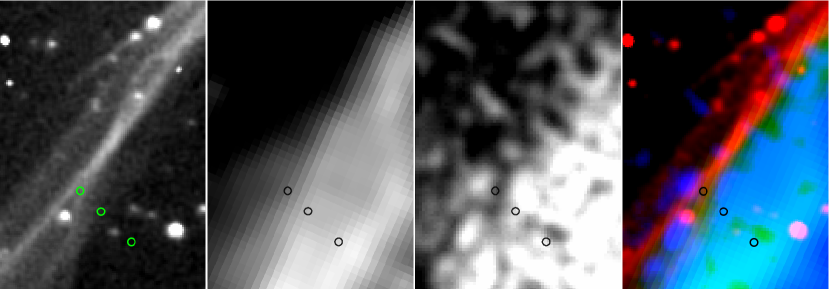
The Spitzer 24 m image is shown along with H and X-ray images in Figure 1. Models similar to those of Borkowski et al. (2006) were able to match the 24 m intensity falloff with distance, the variation in the 24 m/70 m ratio and the IR to X-ray flux ratio. The declines in the 24 m/70 m ratio and the IR to X-ray ratio clearly demonstrate destruction of dust, but there remain ambiguities involving the density and depth of the emitting region, as well as the porosity of the grains. Sankrit et al. (2010) concluded that non-thermal sputtering due to the motion of the grains through the plasma is required to match the variation in the 24 m/70 m ratio. That process is more important in the 400 shocks of the Cygnus Loop than at the higher temperatures of the young SNRs investigated by Borkowski et al. (2006), Williams et al. (2006) and Winkler et al. (2013) because of the lower thermal speeds of protons and particles behind the slower shock. The best fit model of Sankrit et al. (2010) has only half the dust-to-gas ratio expected for the diffuse ISM.
In spite of the quality of the recent Spitzer observations, crucial questions about the heating and destruction of interstellar dust in SNR shocks remain. The inference that the dust-to-gas ratio is only half the expected value could mean that either the derived dust mass is too small due to incorrect heating rates or emissivities, or else the destruction rate is underestimated. In this paper we report the detection of emission in the C IV 1550 doublet from carbon atoms liberated from grains behind the shock in the region observed by Sankrit et al. (2010). Each neutral carbon atom liberated from a grain is quickly ionized to C VI or C VII in the hot post-shock gas, but during the time it spends in each ionization stage it can be excited. Thus each sputtered carbon atom emits about 30 photons in the C IV doublet before it is ionized to C V. We derive the rate at which carbon is liberated from grains and compare the observed intensities with model predictions.
2 Observations and Data Reduction
We observed three positions with the Cosmic Origins Spectrograph (COS) (Green et al., 2012) on HST on 2012 April 25-26. Figure 1 shows the 3 observed positions overlaid on H, Chandra X-ray and 24 m images. The 1.5” proper motion since the H image was obtained was taken into account based on the value of 4.1” in 39 years measured by Salvesen et al. (2009). Table 1 shows the positions and exposure times. We used the G160M grating centered at 1577 Å with the PSA aperture covering the spectral ranges 1386 to 1559 Å and 1577 to 1751 Å. The positions were chosen to be 0.4′′, 10′′, and 25′′ behind the shock. The first position was intended to be slightly behind the shock position delineated by H because it takes a finite time, and therefore distance, to ionize carbon up to and through the C IV state. For a distance to the Cygnus Loop of 640 pc (Salvesen et al., 2009), a post-shock density somewhat above 1 (Raymond et al., 2003) and a post-shock temperature of about K, that distance corresponds to about 0.4′′. Unfortunately, the H filament bifurcates at that position, and the COS aperture lies between the two segments. From Figure 1 it can be seen that the Position 1 aperture was centered on the H filament about 1.5′′ behind the brightness peak.
It should be noted, however, that appearances can be deceiving. The SNR blast wave is rippled as a result of velocity variations caused by density inhomogeneities in the ambient ISM, and the H filaments are actually tangencies between the line of sight and the thin (unresolved) emitting region behind the shock (Hester, 1987). A schematic diagram of the rippled shock surface and several lines of sight is shown in Figure 2. The uppermost line of sight would correspond to a bright filament, while the lowermost is close to a different tangent point, so that it would appear bright. Thus the apparent change in brightness as a function of apparent distance behind the shock would contain a secondary brightness peak unrelated to the outermost filament.
The data were processed with the standard COS pipeline except that we fit a background plus emission lines to the spectrum rather than using the background-subtracted spectrum in order to get more a reliable estimate of the uncertainties. The apparent continuum contains both the real hydrogen 2-photon continuum and the detector background, but we have not attempted to separate those contributions. The data were binned by 32 pixels for the fits.
Figures 3 to 5 show the C IV and He II emission lines at the three positions. The errors are based on the RMS deviations from broad wavelength regions around the lines with an additional contribution from the photon statistics of the lines. For each position we show the best Gaussian fits to the profiles, where the wavelength separation of the C IV doublet is fixed at the laboratory value and the intensity ratio is fixed at 2:1. The Position 3 He II fit is an exception, because the line is barely detected and the formal best fit has an unreasonably large width, so the fit shown assumes the Position 2 He II width.
The C IV 1550 doublet and the He II 1640 line were the only features detected in the wavelength range sampled. The next brightest features expected are the Si IV 1393,1402 doublet, the O III] 1664,1666 lines and the O IV] multiplet at 1400. Those lines were not expected to be detectable because of the low abundance of Si, the high ionization rate of Si IV, and the small excitation cross sections of the O III and O IV intercombination lines. Thus, while these lines are easily detected in radiative shock waves (Raymond et al., 1988), they are not seen in non-radiative shocks (Raymond et al., 1995, 2003).
The instrument profile of the COS aperture for an extended source is not Gaussian. Moreover, the Gaussian fits leave correlated residuals, which casts doubt on the accuracy of the fit. Therefore, we measured intensities by simply integrating the fluxes above the background over the line profiles, and we use the integrated errors as estimates of the 1 uncertainties. We do, however, use the Gaussian fits as the only reasonable measure of the line widths. The intensity ratio of the C IV doublet was fixed at its intrinsic value of 2:1 for the fits to determine line widths. The best fit line widths for the He II line were wider than those for the C IV lines by about the amount expected if both helium and carbon are thermally broadened with a temperature of about K, but the uncertainties are larger than the difference.
Table 2 shows the measured parameters for the three positions. The fluxes were corrected for a reddening E(B-V) = 0.08 using the Cardelli et al. (1989) galactic extinction function, as adopted by Raymond et al. (2003). It is apparent that the C IV flux at Position 1 is smaller than that at Position 2. This unexpected result is discussed below.
In a thin sheet of emitting gas seen edge-on, resonance scattering can affect the observed intensities [e.g., Long et al. (1992)], reducing the intensity ratio of the doublet from its intrinsic 2:1 value and reducing the total C IV intensity. Raymond et al. (2003) used Far Ultraviolet Spectroscopic Explorer (FUSE) observations of the O VI doublet to exploit this effect to constrain the shock parameters and geometry, and they showed that the optical depth in O VI 1032 is 1. Considering the lower abundance of carbon and the shorter ionization time of C IV, the optical depth in the C IV 1548 line should be 0.1. However, the FUSE spectra were acquired somewhat to the NW of our positions, and they averaged over 20′′x4′′ regions, so a larger optical depth at Position 1 is possible. We performed Gaussian fits with the I(1548)/I(1550) ratio unconstrained and found the ratio to be consistent with the optically thin ratio of 2:1. The best fit ratio is actually slightly above 2, but lower ratios corresponding to optical depths as large as are within the uncertainties, and that would reduce the total C IV flux at position 1 by at most 25%. Thus a small optical depth is indicated by the I(1548)/I(1550) ratio.
We must also consider whether background emission from the Galaxy makes a significant contribution to the observed fluxes. Martin & Bowyer (1990) measured C IV fluxes of 2700 to 5700 at high galactic latitudes, and they obtained only upper limits somewhat below those values at low galactic latitudes where the Cygnus Loop lies. Even the highest Galactic background values are 35 times smaller than what we observe at Position 3, and we conclude that the measured fluxes originate in the Cygnus Loop.
3 Analysis
We assume shock parameters based on optical, UV and X-ray studies of a portion of the same H filament located about 5.7′ farther to the NW. That region has a more complex H morphology due to several ripples of the shock surface [analogous to Blair et al. (2005)], so we chose a set of positions along strip 1 of Sankrit et al. (2010). Ghavamian et al. (2001) measured a shock speed of 300-365 and a ratio of electron to proton temperatures at the shock of 0.7-1.0 from the width of the H narrow component and the intensity ratio of the broad and narrow components. Subsequently, van Adelsberg et al. (2008) were unable to match both the broad component width and the narrow-to-broad intensity ratio, perhaps because of a contribution of a shock precursor to the narrow component. However, the electron temperature determined from X-rays (Raymond et al., 2003; Salvesen et al., 2009) supports the conclusion that is nearly equal to , and in that case the broad component width indicates a shock speed at the upper end of the range given by Ghavamian et al. (2001).
UV observations of a section of the Balmer filament a few arcminutes NW of our Position 1 by FUSE showed that the proton and oxygen kinetic temperatures were close to equilibration (Raymond et al., 2003). The relative intensities of the C IV and He II lines in a UV spectrum from the Hopkins Ultraviolet Telescope (HUT) indicated about half the solar carbon abundance, meaning that half the carbon entered the shock in the gas phase or in very small grains that were vaporized within the HUT aperture, that is, within 5′′ of the shock (Raymond et al., 2003). That paper also used the optical depths in the O VI lines to estimate a depth along the line-of-sight of 0.7-1.5 pc, pre-shock density of 0.3-0.5 and a pre-shock neutral fraction of about 0.5. Salvesen et al. (2009) measured proper motions of filaments along the northern Cygnus Loop. Their filament 6 coincides with our Position 1, and the proper motion is 0.105”/yr or 333 at 640 pc. Katsuda et al. (2008) analyzed Chandra observations of the NE region of the Cygnus Loop, and our Position 1 is located near the SE end of their Area 1. The emission measure they derive is compatible with a pre-shock density of 0.5 and a line-of-sight depth of 1.5 to 2 pc. However, their derived electron temperature of about 0.27 keV is about twice what one would expect from the 333 shock speed given by the proper motion and the 640 pc upper limit to the distance of Blair et al. (2009).
To interpret the line fluxes, we need to know how many photons each atom emits before it is ionized. Since the post-shock temperature is far above the temperature where C IV and He II are found in ionization equilibrium (log T = 5.0 and 4.7, respectively), each atom survives for a time and it is excited at a rate . Therefore, it emits on average photons, where is the excitation rate and is the ionization rate, before it is ionized. Using Version 6 of CHIANTI (Dere et al., 2009), specifically the He II excitation computed by Connor Ballance for that database and the C IV excitation rate from Griffin et al. (2000), with the ionization rates of Dere (2007), we find that each C atom emits 31 1550 photons, while each He atom emits 0.078 1640 photons. Thus for solar abundances (Asplund et al., 2009), the C: He ratio of 0.0032 implies an intensity ratio I(C IV)/I(He II) = 1.33 (in ). We will also use the similar number for hydrogen; each neutral H atom passing through the shock produces 0.25 H photons (Chevalier et al., 1980).
The H image shown in Figure 1 was obtained in 1999 at the 1.2 m telescope at the Fred Lawrence Whipple Observatory. It was calibrated based on the optical spectrum at a nearby position, and H fluxes in several apertures are given in Raymond et al. (2003). We determined the H fluxes within the COS apertures at the three positions, and they are shown in Table 2. The intensity ratios can be combined with the numbers of photons per atom to infer the neutral fraction of hydrogen entering the shock. We asssume that helium is entirely neutral or singly ionized. Substantial numbers of He I 584 and He II 304 photons can ionize H and He I, but the shock produces relatively few photons above 54.4 eV, and the photoionization cross section at those energies is relatively small. We use the ratio of 1640 intensity to H at Position 1 to derive a neutral fraction of 0.11 with an uncertainty of a factor of 1.8, including a 32% measurement uncertainty in the 1640 intensity (2-) and uncertainty estimates in reddening correction and H calibration. We therefore estimate a hydrogen neutral fraction of 0.06 to 0.20. That is smaller than the more model-dependent estimate of Raymond et al. (2003), but in keeping with the upper limit of 0.2 from the limit on the ratio of He II to H (Ghavamian et al., 2001).
3.1 Gas phase and sputtered carbon contributions to C IV
The observed intensities are the sum of emission from C atoms liberated from dust grains downstream of the shock and emission from near the shock as it curves around the Cygnus Loop, projected onto the line of sight. On the other hand, He is very quickly ionized, and since it is not depleted onto grains, the 1640 emission is produced only at the shock front. Based on the temperatures and densities above, it originates within 1′′ of the shock. The aperture at Position 1 includes both “gas phase” C IV emission and emission from carbon sputtered from dust grains that passed through parts of the shock that appear ahead of Position 1 in projection. Therefore, we take the Position 1 ratio of I(C IV)/I(He II) = 1.1 to be an upper limit to the ratio due to emission at the shock from carbon that passes through the shock in the gas phase. This includes emission from PAHs and very small grains that are vaporized near the shock (Micelotta et al., 2010). Comparison of the value of 1.1 with the theoretical value of 1.33 indicates that at most 80% of the carbon is in the gas phase or PAHs at the shock. HUT measured a C IV: He II ratio of 0.73 for a section of this filament farther to the NW. The 10′′ HUT wide aperture was placed along the filament, so it includes C IV emission from carbon that is vaporized from grains within 5′′ of the shock. This gives a more stringent limit of 0.45 for the fraction of carbon entering the shock in the gas phase or PAHs and it suggests a significant amount of sputtering within 5′′ of the shock. The HUT upper limit is comparable to the estimated dust-to-gas ratio of about one half the Galactic value from Sankrit et al. (2010).
We assume that the ratio of C IV to He II produced at the shock is constant and use it to subtract off the contribution to the C IV emission from the shocks projected onto the line of sight at Positions 2 and 3. Taking the C IV:He II ratio at the shock to be , we find that the C IV emission from carbon liberated from dust is 16 to 27 and 3.3 to 5.5 at positions 2 and 3, respectively. Those fluxes imply that carbon is being sputtered from grains at rates of 4.6 to atoms at Position 2 and 0.9 to atoms at Position 3.
3.2 Line widths
The measured widths of the 1640 profiles are larger than those of the C IV lines as expected if their kinetic temperatures are equal, but the widths are equal within the uncertainties. The thermal width of the helium line is 141 (FWHM) at K expected for the 350 shock speed obtained by Ghavamian et al. (2001) from the H profile, compared with 82 for carbon. The COS line profile for diffuse emission that fills the aperture is not exactly known beyond the statement that the width is about 200 (France et al., 2009), so the observed line widths are consistent with thermal broadening and equal carbon and helium and hydrogen kinetic temperatures. This is in contrast with shocks in the solar wind (Korreck et al., 2007; Zimbardo, 2011) and faster SNR shocks (Raymond et al., 1995; Korreck et al., 2004), where more massive ions have much higher temperatures, but the uncertainties permit a wide range of kinetic temperatures. Moreover, the larger grains slow down very gradually in the shocked plasma due to Coulomb collisions, though they may gyrate about the magnetic field and move with the bulk flow (Dwek et al., 1996; Sankrit et al., 2010). Carbon atoms sputtered from these grains will initially move at a high speed, potentially giving a line width comparable to the H line width, as we discuss below.
4 Physical Models
Sankrit et al. (2010) found a dust-to-gas ratio about half the typical galactic value, and we used their model to predict the C IV emission, using the fraction of dust remaining as a function of distance behind the shock to estimate the sputtering rate and assuming 31 photons per C atom. We measure a higher C IV intensity than expected from a simple plane-parallel model, suggesting that emission from gas phase carbon makes a significant contribution or that the simple plane parallel model is not adequate. We therefore make more detailed models of the destruction of grains and the emission from sputtered carbon, and we use those models with the shock geometry inferred from the H image to predict the C IV brightness for comparison with the observed values.
4.1 Grain Destruction Models
Sankrit et al. (2010) computed models of grain destruction and IR emission to match Spitzer observations of this part of the Cygnus Loop, and we have used a model close to their lowest temperature model, which matches the shock speed determined from the proper motion, to predict the C IV emission from carbon sputtered from dust. The model, which is described more fully in Williams (2010), includes the enhanced sputtering due to the motion of grains through the hot plasma. Sputtering of a dust grain in a hot plasma is a function of both the temperature (energy per collision) and density (frequency of collisions) of the gas. We include sputtering by both protons and alpha particles, assuming cosmic abundances, such that nα = 0.1np. We use sputtering rates from Nozawa et al. (2006), augmented by calculations of an enhancement in sputtering yields for small grains by Jurac et al. (1998). We use the pre-shock grain size distributions of Weingartner & Draine (2001) and calculate the sputtering for grain sizes from 1 nm to 1 m as a function of the sputtering timescale, , defined as the integral of the proton density over the time since the gas was shocked. As a comparison, we also computed sputtering rates for model BARE-GR-S of Zubko et al. (2004), and found rates that were over twice as large near the shock and about 50% higher for corresponding to our Position 2 and 30% higher for Position 3.
The total mass in grains is calculated by integrating over the grain-size distribution, which changes as a function of due to sputtering. Relative motions between the dust grains and the hot gas, which result in “non-thermal” sputtering, are included by solving the coupled differential equations for grain radius and velocity given in Draine & Salpeter (1979). Dust grains enter the shock with a velocity of 3vs/4 relative to the downstream plasma, and slow down due to collisions with the ambient gas. Initially, sputtering is a combination of both thermal and non-thermal effects, with the non-thermal effects going to zero as gas drag and to a lesser extent Coulomb drag slow the grains with respect to the gas. Just behind the shock, the motion of the grains through the plasma approximately doubles the sputtering rate. By the time the gas reaches our Positions 2 and 3, the grains smaller than about 0.01 m have slowed enough that sputtering rates approach the thermal value, while grains about 0.1 m still experience the enhanced rate. Based on the results of Ghavamian et al. (2001) and Raymond et al. (2003) we assume equal electron and ion temperatures of 160 eV, which corresponds to a shock speed of 366 . Katsuda et al. (2008) find a higher electron temperature of about 270 eV for regions to the NW of our positions, but we adopt the shock speed based on measured proper motions (Salvesen et al., 2009).
Figure 6 shows the predicted dust destruction rates and fractions of dust remaining as a function of behind the shock. Silicates behave somewhat differently than carbonaceous grains, and we show the silicate curves for comparison. For a post-shock density of 2 , the shock proper motion of 0.105′′ per year and an assumed compression of a factor of 4 by the shock (so that the post-shock gas moves at 0.0265′′ per year relative to the shock), Positions 2 and 3 correspond to and , respectively. The model assumes that 25% of the carbon is initially in atomic or molecular form or in PAHs that are destroyed very rapidly close to the shock.
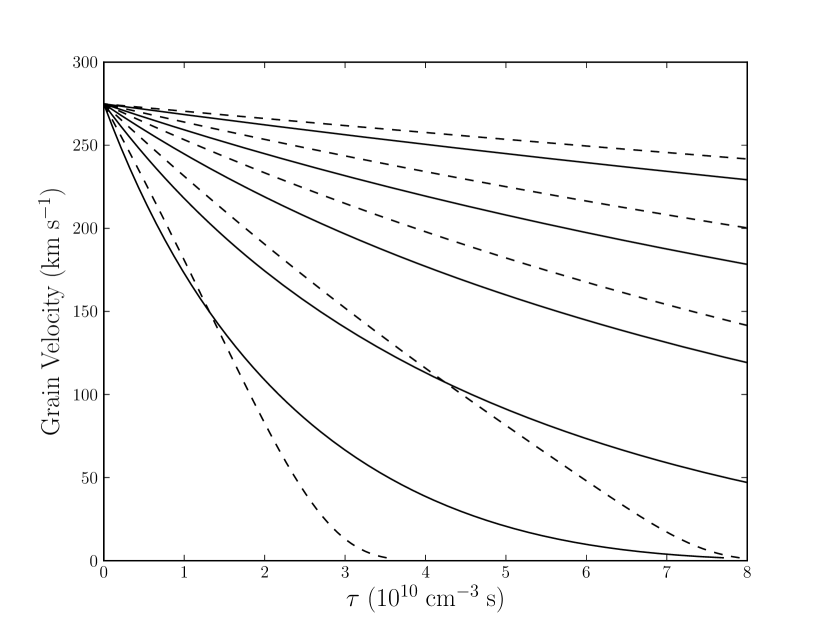
Figure 7 shows how grains are decelerated behind the shock by the gas drag (Baines et al. 1965; Draine & Salpeter 1979), for grains with initial (preshock) radii of 0.005, 0.01, 0.02, 0.04, and 0.1 m. (We did not include the Coulomb drag in these calculations, as it is generally less important than the gas drag in hot X-ray emitting plasmas due to the small values of charge on the grains). For large grains, deceleration is modest on temporal scales of interest in this paper because the slowing-down time (drag time) is long. As the drag time scales linearly with the grain density, carbonaceous grains are decelerated more rapidly than silicate grains. For small grains, both sputtering and gas drag become important, and their combined effects lead to rapid deceleration. This is particularly pronounced for silicate grains because their sputtering yields are larger than for carbonaceous grains (Nozawa et al. 2006). For example, silicate grains with the initial grain size of 0.005 m quickly slow down and are completely sputtered away at cm-3 s.
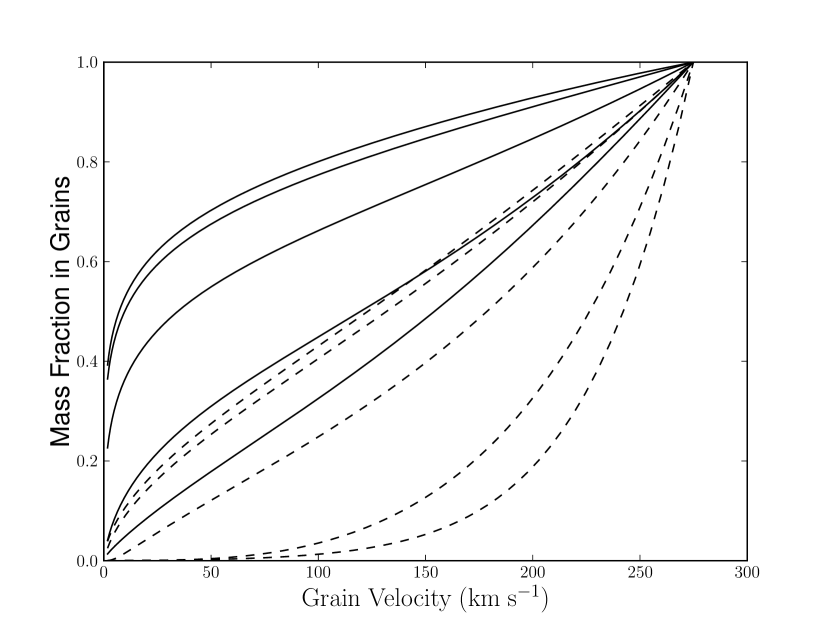
Figure 8 shows the mass fraction in grains as a function of velocity relative to the post-shock plasma. Again, solid lines depict carbonaceous grains with initial radii of 0.005, 0.01, 0.02, 0.04, and 0.1 m from bottom to top. Much of the carbon liberated from grains comes from the smaller ones, so much of the carbon is produced when grains have slowed by about a factor of 2 relative to the gas. This will affect the width of the C IV lines from sputtered carbon. If the shock is a parallel shock, the dust is not initially compressed by a factor of 4 along with the gas, but it is compressed as the velocity decreases. That could affect the spatial distribution of C IV emission and IR intensity behind the shock. Figure 8 also indicates the velocities of the grains from which the carbon is sputtered. A preliminary calculation of the line profile at Position 2 assuming a perpendicular shock and a magnetic field in the plane of the sky shows an emission plateau 540 wide (FWZI), with a central component of about 200 (FWHM). For other magnetic geometries, those widths would be multiplied by the cosine of the angle between the shock normal and the magnetic field and by the sine of the angle between the magnetic field and the line of sight. However, the motion of particles along the field relative to the plasma will affect the velocity distribution at a given location. The measured FWHM at Position 2 is just within the uncertainties of the predicted central component width. The predicted profile at Position 3 consists mostly of the broad plateau, which is compatible with the 460 upper limit to the measured velocity width at that position.
4.2 Comparison to observations
As can be seen in Figure 1, the shock is not a simple planar sheet conveniently oriented along our line of sight. Rather, it is a rippled sheet that appears bright where it is tangent to our line of sight (Hester, 1987). Therefore, we cannot simply compare the model prediction in Figure 6 with the observed fluxes without considering the geometrical structure of the shock front. Indeed, the sputtering rate from Figure 6 drops steeply, and for about it is very low, so that multiplying that value by the column density of carbon and the photon yield per atom yields a C IV flux below that observed.
To describe the shape of the shock front, we use the H image shown in Figure 1. The intensities from a 3 pixel wide average along the line connecting Positions 1, 2 and 3 are shown in Figure 9. It was shown above that the neutral fraction in the pre-shock gas is 0.06 to 0.2, and each H atom produces 0.25 H photons just after it passes through the shock, so the H brightness is directly related to the flux of particles through the shock at each pixel. We next assume that the ratio of carbon to hydrogen is by number (Asplund et al., 2009) with 75% in dust and use the model shown in Figure 6 to compute the C IV intensity at each pixel along the cut through Positions 1, 2 and 3 assuming a post-shock density of 2 . Note that the intensity has two components. First, there is C IV produced immediately behind the shock from carbon that was in the gas phase or PAHs, which is proportional to the local H brightness. Second, there is the C IV from carbon sputtered from grains that passed through the shock in pixels farther toward the outside of the remnant. We assume that the H is formed at the shock front, and its brightness indicates the mass flux through the shock at each position as shown in Figure 9. We then use the emission as a function of spatial offset from the shock derived from Figure 6 to compute the C IV emission from gas at all downstream pixels and sum the contributions from the shocks the positions along Figure 9.
Figure 10 shows the predicted C IV intensities along with the observed values, where we have assumed a pre-shock neutral fraction of 0.2, at the upper end of the range determined above. The predictions lie above the observations at Positions 1 and 3, but below the observations at Position 2. Note that the predicted rate of liberation of carbon from grains, in Figure 6, drops steeply with , and much of the emission at Position 3 arises from gas that was shocked relatively close to Position 3 (in projection) rather than gas that passed through the shock seen as the H filament.
Overall, the approximate agreement between the observed and predicted fluxes is encouraging considering the uncertainties in the gas-phase abundances at the shock, the sputtering rate, the grain size distribution, the post-shock temperature and the pre-shock neutral fraction. If some of the H arises in a shock precursor (Hester et al., 1994; Raymond et al., 2011), the mass flux through the shock and therefore the predicted C IV emission would be overestimated. On the other hand, if the pre-shock neutral fraction is overestimated, the mass flux is underestimated and the predicted C IV is underestimated. If the post-shock temperature we have assumed is underestimated, the sputtering rate is also underestimated. Another uncertainty is that some of the H emission can arise from the photoionization precursor. Though this is absent behind the shock in the plane parallel case, the curvature of the SNR blastwave means that some of the precursor emission will be seen in projection behind the shock, leading to an overprediction of the C IV intensity. We have no way to resolve these ambiguities, but conclude that a model of grain destruction with current sputtering rates, combined with plausible parameters for the shock, predicts a level of C IV emission from C atoms liberated from grains in rough agreement with observations.
However, the discrepancy between Position 2 and the other 2 positions remains. There are several possible explanations.
Neutral fraction variations: We have assumed that the hydrogen neutral fraction is constant throughout the relevant part of the ISM. In a region where the neutral fraction is larger, a given H brightness would translate into a lower mass flux than the value used in the model, and the C IV brightness would be smaller. We derived the neutral fraction from the Position 1 observation, so this explanation would require that the neutral fraction changes between Positions 1 and 2.
Gas phase carbon variations: The model assumes that the fraction of carbon in the gas phase at the shock is 0.25 everywhere. The value quite likely varies by a factor of 2 in the ISM (Jenkins, 2009; Sofia & Parvathi, 2009). Figure 11 shows that reducing the gas phase fraction to about 10% would bring the Position 1 C IV flux into agreement but then the model underpredicts the intensity at Position 2.
Sputtering rate: The sputtering rate is poorly known (Nozawa et al., 2006), and it scales with the post-shock density, which our models assume to be 2 . Increasing the sputtering rate would increase the C IV intensity from sputtered carbon, especially in pixels just behind the shock. A combination of smaller fraction of carbon in the gas phase and higher sputtering rate might in principle decrease the level of disagreement, but it would not give a higher C IV intensity at Position 2 than at Position 1. Sputtering rates computed with the Zubko et al. (2004) size distribution would be higher everywhere, and they would not help resolve the discrepancy.
Optical depth: If resonant scattering in the edge-on sheet of gas just behind the shock reduces the C IV intensity at Position 1 by a factor of 2, but does not affect Positions 2 or 3, that would solve the problem. However, that would require an optical depth of 3.5 in the 1548 line, which would imply a C IV doublet ratio of only 1.2, which is not compatible with the observed spectrum.
ISM inhomogeneity: The intensity may not be an adequate proxy for the flux of material through the shock. The IR surface brightness from Spitzer peaks perhaps 30” behind the bright H filament, which is not consistent with either a planar shock picture or with the convolution of the H brightness with the sputtering model. The bright IR emission could indicate that the shock seen in projection about 20” behind the H filament is now passing through a region with very low hydrogen neutral fraction, or it could be that the shock passed through a dense or dusty clump about 1000 years ago. A similar variation in density along the shock path was noted by Winkler et al. (2013) in SN1006.
Overall, while we have been able to detect the C IV emission from carbon sputtered from grains, it is likely that projection effects (caused by variations in density, changes in neutral fraction, variable dust properties or some combination of these) limit our ability to provide a definitive test of grain destruction models with these data.
5 Summary
A simple, model-independent estimate of the C IV emission from carbon atoms sputtered from dust grains behind the shock was made by assuming that the ratio of C IV to He II emission from carbon in the gas phase at the shock is constant over the region observed. An attempt to model the emission in more detail by using the H intensity to map out the geometrical structure of the shock produced general agreement to about a factor of 1.5, but a significant discrepancy among the positions remained. In particular, the models cannot explain why the C IV is brighter at Position 2 than at Position 1. We considered several explanations for this discrepancy, but the most likely is that the properties of the ISM, in particular density, neutral fraction or dust properties, vary over parsec scales. Overall, we find that the C IV emission from carbon sputtered from grains is compatible with the sputtering rate and grain size distribution assumed by Sankrit et al. (2010), but preferably with a smaller fraction of carbon in the gas phase and PAHs than assumed by those models.
The complexity of the structure along the line of sight prevents us from deriving stronger constraints at present. Further progress could be achieved by 1) observing a simpler shock structure in the Cygnus Loop or another SNR, 2) resolving the discrepancy between shock speed derived from proper motions and post-shock temperature from the X-ray spectra, 3) sorting out the geometrical complexity of this part of the Cygnus Loop, for instance by obtaining more observations of the He II line and a higher resolution H image, or 5) obtaining deeper X-ray spectra to better determine the temperature, density and elemental abundances of the shocked plasma.
This work was performed under grant HST-GO-12885 to the Smithsonian Astrophysical Observatory. P.G was supported under grant HST-GO-12545.08, and T.J.G. acknowledges support under NASA contract NAS8-03060.
Facilities: HST (COS) FLWO:1.2m
References
- Arendt et al. (2010a) Arendt, R.G., Dwek, E. & Leisawitz, D. 2010a, ApJ, 400, 562
- Arendt et al. (2010b) Arendt, R.G., et al. 2010b, ApJ, 725, 585
- Asplund et al. (2009) Asplund, M., Grevesse, N., Sauval, A.J. & Scott, P. 2009, Ann. Rev. A&A, 47, 481
- Badnell & Pindzola (2000) Badnell, N.R. & Pindzola, M.S. 2000, J. Phys. B, 33, 1013
- Baines et al. (1965) Baines, M. J., Williams, I. P., & Asebiomo, A. S. 1965, MNRAS, 130, 63
- Bianchi & Ferrara (2005) Bianchi, S. & Ferrara, A. 2005, MNRAS, 358, 379
- Blair et al. (2005) Blair, W.P., Sankrit, R. & Raymond, J.C. 2005, AJ, 129, 2268
- Blair et al. (2009) Blair, W.P., Sankrit, R., Torres, S.I., Chayer, P. & Danforth, C.W. 2009, ApJ, 692, 335
- Borkowski & Dwek (1995) Borkowski, K.J. & Dwek, E. 1995, ApJ, 454, 254
- Borkowski et al. (2006) Borkowski, K.J. et al. 2006, ApJ, 642, L141
- Cardelli et al. (1989) Cardelli, J.A., Clayton, G.C. & Mathis, J.S. 1989, ApJ, 345, 245
- Chevalier & Raymond (1978) Chevalier, R.A., & Raymond, J.C. 1978, ApJ, 225, L27
- Chevalier et al. (1980) Chevalier, R.A., Kirshner, R.P. & Raymond, J.C. 1980, ApJ, 235, 186
- Cox (1972) Cox, D.P. 1972, ApJ, 178, 159
- Dere (2007) Dere, K.P. 2007, A&A, 466, 771
- Dere et al. (2009) Dere, K.P., Landi, E., Young, P.R., Del Zanna, G., Landini, M. & Mason, H.E. 2009, A&A, 498, 915
- Draine (2009) Draine, B.T. 2009, in Cosmic Dust Near and Far, ASP Conf. Ser. 414, p. 453
- Draine & Salpeter (1979) Draine, B.T. & Salpeter, E.E. 1979, ApJ, 231, 77
- Dwek (1998) Dwek, E. 1998, ApJ, 501, 643
- Dwek & Scalo (1980) Dwek, E. & Scalo, J.M. 1985, ApJ, 239, 193
- Dwek et al. (1996) Dwek, E., Foster, S.M. & Vancura, O. 1996, ApJ, 457, 244
- France et al. (2009) France, K., et al. 2009, ApJ, 707, L27
- Ghavamian et al. (2001) Ghavamian, P., Raymond, J.C., Smith, R.C. & Hartigan, P. 2001, ApJ, 547, 995
- Green et al. (2012) Green, J.C., et al. 2012, ApJ, 744, 60
- Griffin et al. (2000) Griffin, D.C., Badnell, N.R. & Pindzola, M.S. 2000, J. Phys. B, 33, 1013
- Hester (1987) Hester, J.J. 1987, ApJ, 314, 187
- Hester et al. (1994) Hester, J.J., Raymond, J.C., & Blair, W.P. 1994, ApJ, 420, 721
- Jenkins (2009) Jenkins, E.B. 2009, ApJ, 700, 1299
- Jones et al. (1996) Jones, A.P., Tielens, A.G.G.M. & Hollenbach, D.J. 1996, ApJ, 469, 740
- Jurac et al. (1998) Jurac, S., Johnson, R. E., & Donn, B. 1998, ApJ, 503, 247
- Katsuda et al. (2008) Katsuda, S., Tsunemi, H., Kimura, M. & Mori, K. 2008, ApJ, 680, 1198
- Korreck et al. (2004) Korreck, K.E., Raymond, J.C., Zurbuchen, T.E. & Ghavamian, P. 2003, ApJ, 615, 280
- Korreck et al. (2007) Korreck, K.E., Zurbuchen, T.E., Lepri, S.T. & Raines, J.M. 2007, ApJ, 659, 773
- Laming et al. (1996) Laming, J.M., Raymond, J.C., McLaughlin, B.M. & Blair, W.P. 1996, ApJ, 472, 267
- Long et al. (1992) Long, K.S., Blair, W.P., Vancura, O., Bowers, C.W., Davidsen, A.F. & Raymond, J.C. 1992, ApJ, 200, 214
- Martin & Bowyer (1990) Martin, C. & Bowyer, S. 1990, ApJ, 350, 242
- Micelotta et al. (2010) Micelotta, E.R., Jones, A.P. & Tielens, A.G.G.M. 2010, A&A, 510, A37
- Nozawa et al. (2006) Nozawa, T., Takashi, K. & Habe, A. 2006, ApJ, 648, 435
- Raymond et al. (1988) Raymond, J.C., Hester, J.J., Cox,D., Blair, W.P., Fesen, R.A. & Gull, T.R. 1988, ApJ, 324, 869
- Raymond et al. (1995) Raymond, J.C., Blair, W.P. & Long, K.S. 1995, ApJ, 454, L31
- Raymond et al. (2003) Raymond, J.C., Ghavamian, P., Sankrit, R., Blair, W.P. & Curiel, S. 2003, ApJ, 584, 770
- Raymond et al. (2011) Raymond, J.C., vink, J., Helder, E.A. & de Laat, A. 2011, ApJ, 731, L14
- Salvesen et al. (2009) Salvesen, G., Raymond, J.C. & Edgar, R.E. 2009, ApJ, 702, 327
- Sankrit et al. (2010) Sankrit, R., et al. 2010, ApJ, 712, 1092
- Serra Diaz-Cano & Jones (2008) Serra Diaz-Cano, L. & Jones, A.P. 2008, A&A, 492, 127
- Shull (1978) Shull, J.M. 1978, ApJ, 215, 805
- Slavin et al. (2004) Slavin, J.D., Jones, A.P. & Tielens, A.G.G.M. 2004, ApJ, 614, 796
- Sofia & Parvathi (2009) Sofia, U.J. & Parvathi, V.S. 2009, in Cosmic Dust – Near and Far, ASP Conf. Ser. 414, T. Henning, E. Grün and J. Steinacker, eds., p. 236
- van Adelsberg et al. (2008) van Adelsberg, M., Heng, K., McCray, R., & Raymond, J.C. 2008, ApJ, 689, 1089
- Weingartner & Draine (2001) Weingartner, J.C., & Draine, B.T. 2001, ApJ, 548, 296
- Williams (2010) Williams, B.J. 2010, PhD Thesis, North Carolina State University, arXiv:1005.1296
- Williams et al. (2006) Williams, B.J., et al. 2006, ApJL, 652, L33
- Williams et al. (2011) Williams, B. J., et al. 2011, ApJ, 729, 65
- Winkler et al. (2013) Winkler, P.F., et al. 2013, ApJ, 764, 156
- Zimbardo (2011) Zimbardo, G. 2011, P&SS, 59, 468
- Zubko et al. (2004) Zubko, V., Dwek, E., & Arendt, R.G. 2004, ApJS, 152, 211
Table 1
COS Observations
| Position | RA(2000) | Dec(2000) | Dist. from Shock | Exp. Time |
|---|---|---|---|---|
| 1 | 20 54 43.611 | 32 16 03.53 | 0.43′′ | 2500 |
| 2 | 20 54 43.055 | 32 15 56.46 | 10′′ | 7801 |
| 3 | 20 54 42.221 | 32 15 45.85 | 25′′ | 14501 |
Table 2
C IV 1550 and He II 1640 Fluxes and Widths
| Observed | Dereddened | ||||||
|---|---|---|---|---|---|---|---|
| Position | F | w | F | w | I | I | I |
| 1 | 11.20.96 | 10.11.6 | 20.7 | 18.3 | 17.4 | ||
| 2 | 14.80.59 | 5.50.94 | 27.3 | 9.95 | 7.36 | ||
| 3 | 3.00.44 | 1.10.69 | 5.54 | 1.99 | 2.79 | ||
a
b FWHM uncorrected for instrument profile: km s-1
c from H image from Mt. Hopkins 1.2-m telescope