Detecting Dark Matter Substructures around the Milky Way with Gaia
Abstract
Cold Dark Matter (CDM) theory, a pillar of modern cosmology and astrophysics, predicts the existence of a large number of starless dark matter halos surrounding the Milky Way (MW). However, clear observational evidence of these “dark” substructures remains elusive. Here, we present a detection method based on the small, but detectable, velocity changes that an orbiting substructure imposes on the stars in the MW disk. Using high-resolution numerical simulations we estimate that the new space telescope Gaia should detect the kinematic signatures of a few starless substructures provided the CDM paradigm holds. Such a measurement will provide unprecedented constraints on the primordial matter power spectrum at low-mass scales and offer a new handle onto the particle physics properties of dark matter.
keywords:
Galaxy: kinematics and dynamics – galaxies: halos – dark matter1 Introduction
Substructures and satellite galaxies interacting and merging with the MW can significantly affect the dynamical state of its stellar disk (e.g., Quinn et al. 1993). Such gravitational interactions may result in tidal heating of the disk (Lacey & Ostriker, 1985; Carr & Lacey, 1987; Toth & Ostriker, 1992; Quinn et al., 1993; Walker et al., 1996; Benson et al., 2004), in the excitation of bending waves (e.g., Sellwood et al. 1998), in tilts and warps (e.g., Huang & Carlberg 1997), in flaring (e.g., Kazantzidis et al. 2008; Dubinski et al. 2008), or may trigger the growth of non-axisymmetric structures such as bars (Walker et al., 1996; Cole & Weinberg, 2002; Gauthier et al., 2006; Kazantzidis et al., 2008) and ring-like stellar enhancements (e.g., Kazantzidis et al. 2008; Purcell et al. 2011).
Recent high resolution N-body simulations have also shown that massive substructures colliding with the MW disk may excite wave-like changes of the stellar density and velocity components of disk stars (Dubinski et al., 2008; Purcell et al., 2011; Gómez et al., 2012). Specifically, it has been suggested that the passage of the Sagittarius dwarf spheroidal galaxy ( at infall into the MW halo; Jiang & Binney 2000) may be responsible for the ringing of the MW disk (Purcell et al., 2011; Gómez et al., 2012). Gravitational encounters with such comparably massive satellite galaxies are also suspected to be the cause of the observed north/south asymmetries in the stellar number densities and mean vertical and radial stellar velocities (Widrow et al., 2012; Gómez et al., 2013; Williams et al., 2013; Carlin et al., 2013; Yanny & Gardner, 2013).
While massive satellite galaxies have the largest impact on the dynamical state of the MW disk, they are relatively rare at the present epoch (Kazantzidis et al., 2008). Low mass substructures are more numerous and they have a qualitatively similar (although significantly weaker) effect on stars in the MW disk. Low mass substructures ( ) are hard to detect in the electromagnetic spectrum because they are largely devoid of gas and stars as a result of the increase in the thermal Jeans mass following re-ionization (Barkana & Loeb, 1999; Okamoto, Gao & Theuns, 2008). Proposed methods to detect such substructures around the Milky Way (MW) rely on gamma-ray emission from the annihilation of dark matter (Lake, 1990; Calcáneo-Roldán & Moore, 2000; Diemand, Kuhlen & Madau, 2007), or on the gravitational scattering of stars in the tidal streams of satellite galaxies (Ibata et al., 2002; Johnston, Spergel & Haydn, 2002; Siegal-Gaskins & Valluri, 2008).
The unknown nature of dark matter and its annihilation channels, as well as the large background of gamma-rays from more conventional astrophysical sources, poses major challenges for the former approach (Zechlin & Horns, 2012). In contrast, the low signal-to-noise ratio of the available observational data and the low number of suitable streams limit the use of tidal streams to detect substructures (Carlberg & Grillmair, 2013). So far, neither approach has produced definite evidence in favor of truly starless dark matter halos orbiting the MW.
The observational difficulties are substantial, yet, the identification of starless, low-mass substructures will have profound implications for the understanding of dark matter. For instance, it will provide direct evidence for the existence of dark matter that is clustered on small scales. Furthermore, the number density of dark matter halos encodes invaluable information about the primordial power spectrum, the physics of the early universe, and the nature of dark matter (Moore et al., 1999; Bullock, Kravtsov & Weinberg, 2000; Kuhlen, Vogelsberger & Angulo, 2012). For instance, in Warm Dark Matter models, a competitor of the Cold Dark Matter (CDM) paradigm, structure formation is suppressed below the free-streaming scale of the dark matter particle, resulting in a deficit in substructure with masses below (Bode et al., 2001; Zentner & Bullock, 2003; Viel et al., 2005).
We propose to detect dark substructures as they pass through the disk of the MW based on their gravitational pull on disk stars. Specifically, we will show that such substructures leave a tell-tale kinematic imprint in the velocity field of disk stars that could potentially be measured with the large-scale, high-precision astrometric mission Gaia. The main idea is straightforward. An object that passes with relative speed through the stellar disk induces a localized velocity impulse in the disk of about (see Appendix A)
| (1) |
Here is the Newton constant, is a factor of order unity that depends on the orbit of the perturber, is the impact parameter of the encounter for a star in the disk, and is a characteristic mass of the passing object. For a point-like perturber, is the total mass. For an object with an extended but steeply radially declining density profile, is approximately the mass within .
Velocity changes caused by passing low-mass substructures are thus smaller than the velocity dispersion of the stars in the disk (25 km s-1 in the solar neighborhood, e.g., Rix & Bovy 2013). However, as stars in the same vicinity (within 1-2 kpc for a perturber) experience approximately the same force, the kinematic signature of the substructure may in principle be recovered by spatially averaging a sufficiently large sample of disk star velocities.
Measuring this kinematic imprint offers a variety of advantages compared with approaches that infer the presence of perturbers from the excitation of kinematic or density waves in the stellar disk. First, the velocity perturbations have a unique morphology that enables us to differentiate them from disturbances caused by, e.g., spiral structure or a stellar bar. Second, the kinematic signal localized (to within a few kpc) before winding sets in and, hence, can be used to track where the substructure passed through the disk. Third, the signal has a life time of Myr. This time is long enough to make it likely that we can observe the imprint of one or several substructures crossing the disk at any given time. It is also short enough to erase the memory of the multitude of previous encounters and, hence, presents the disk as a clean slate every half dynamical time. In contrast, bending modes and density waves likely survive for several rotation periods (e.g. Hunter & Toomre 1969; Toomre 1969, 1977; Sparke 1984). Furthermore, although the observed kinematic asymmetries in the radial and vertical directions (e.g., Widrow et al. 2012) could be caused by an external perturber, it is also possible that they are excited by internal non-axisymmetric features of the MW disk (Faure et al., 2014). The localized, short-lived kinematic velocity impulse that gives rise to equation (1) avoids these problems and thus minimizes the number of false positive detections of dark substructures.
In this paper we investigate the feasibility of the proposed detection method using high resolution numerical simulations and mock stellar catalogs. We introduce the numerical set-up in section 2. In section 3 we analyze the kinematic signature that the passing substructure imparts on the stellar disk. We estimate the rate of substructure collisions with the MW in section 4. We discuss the implementation of the proposed method with a Gaia-based survey in section 5. We summarize our findings and conclude in section 6.
2 Numerical set-up
Our numerical set-up consists of models of a dynamically stable, dissipationless galaxy with properties similar to the MW (Widrow, Pym & Dubinski, 2008) and a dark matter substructure with virial mass , scale radius 1.3 kpc, mass within the scale radius of , and virial circular velocity 15 km s-1, see Appendix B. The mass ( ) and force resolution ( pc) of our numerical set-up are adequate to follow accurately the dynamical evolution of the coupled MW – substructure system. We summarize the resolution of the simulations in Table 1.
| component | total No. of particles | particle mass | softening |
|---|---|---|---|
| pc | |||
| MW disk | 20 | ||
| MW bulge | 20 | ||
| MW halo | 50 | ||
| substructure | 50 |
| label | |||
|---|---|---|---|
| (km/s) | (kpc) | (km/s) | |
| vertical | 288 | (11.45, 0) | (-4.6, 0, -288) |
| prograde | 292 | (10.97, -1.96) | (12.4, 270, -110) |
| retrograde | 291 | (11.05, 1.68) | (8.3, -270, -108) |
In this work we study numerically the gravitational interaction between the disk of the MW and the orbiting substructure. In the main text we discuss three representative choices of orbital parameters: a vertical, a prograde, and a retrograde orbit, see Table 2. The inclination between the plane of the MW disk and the orbit plane of the substructure is approximately , , and , respectively, in these cases. The prograde and retrograde orbits allow us to explore the impact of an orbiting substructure that co-rotates or counter-rotates with the majority of the stars in the MW disk.
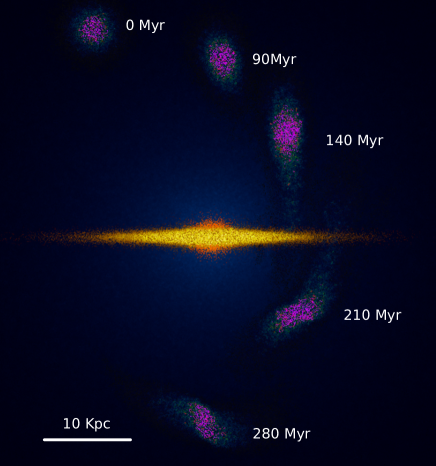
The initial position and velocity of the substructure put it on a collision course with the stellar disk of the MW. The impact occurs at 11 kpc from the Galactic Center with a speed of km s-1 , see Table 2. We describe the set-up of the MW – substructure collisions in detail in Appendix B. We explore further orbital parameters in the appendix, finding little qualitative difference. We illustrate the vertical orbit of the substructure in Fig. 1.
We run our numerical simulations with PKDGRAV (Stadel, 2001), the gravity solver of the TreeSPH code GASOLINE (Wadsley, Stadel & Quinn, 2004). We adopt conservative values for the gravity opening angle (0.55) and the time stepping factor () in order to ensure an accurate integration of the equations of motions of the stellar and dark matter particles in our models.
We evolve the N-body realizations of the MW and the substructure in isolation for 500 Myrs to minimize non-equilibrium transients caused by the initial conditions. The structural and kinematical properties of our N-body model do not show significant evolution during this equilibration period indicating that the initial setup is indeed close to a self-consistent steady state. We subsequently integrate numerically the dynamical evolution of the combined MW – substructure system. Our simulations span about 380 Myr of evolution, including about 190 Myr after the substructure passes through the MW disk.
 |
 |
3 The kinematic signature of a low mass substructure passing through the MW
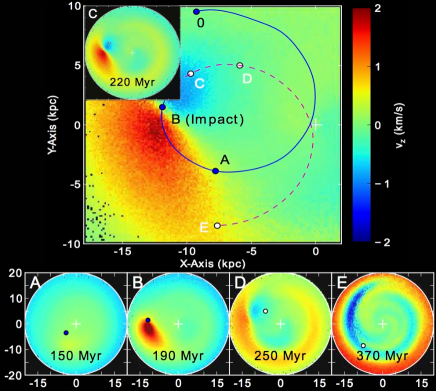
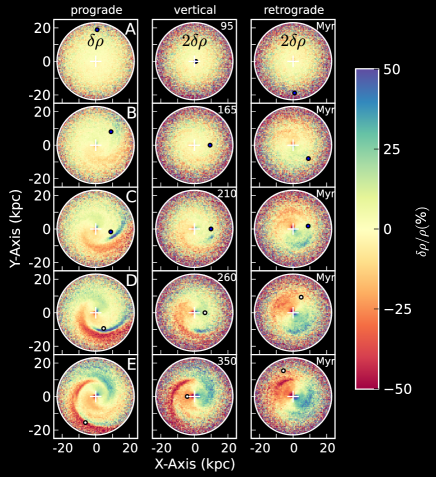
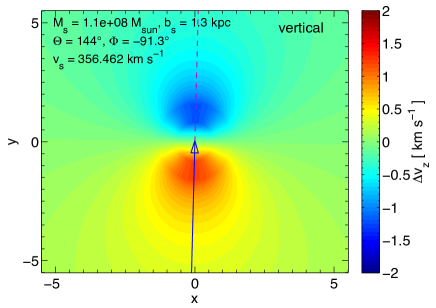
We focus first upon the case of the substructure passing vertically through the disk. We show in Fig. 2 the effect of the substructure on the vertical motion of the stellar disk. Specifically, we show the change in after subtracting, particle by particle, the velocities from an otherwise identical reference simulation that does not include a substructure. As the substructure descends toward the disk, it gravitationally attracts part of the stellar disk below it, resulting in an upward motion (Fig. 2A,B). Because the stellar disk rotates, the substructure exerts in general a downward force on a different part of the stellar disk after passing through the disk (Fig. 2C,D). The result is that for a timescale of about 100 Myr the stellar disk either shows a well localized maximum of , a minimum of , or even both at the same time. The position of the velocity maximum (minimum) roughly tracks the projected position of the substructure when it is above (below) the disk.
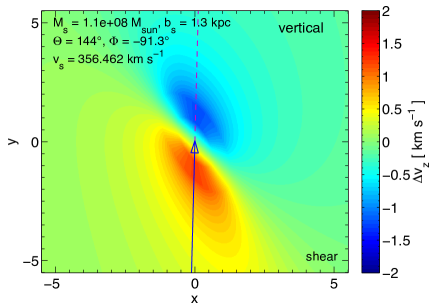
At later times (Fig. 2E) the differential rotation winds up the localized velocity impulse resulting in an extended spiral-like pattern. In addition, the imparted velocity impulse may excite bending waves that start propagating across the disk and distorted the initial kinematic signal. Given that the solar neighborhood is likely stable against the buckling instability (Merritt & Sellwood, 1994; Binney & Tremaine, 2008), a conservative lower limit on the bending mode period is Myr. To obtain this lower limit we use the dispersion relation equation (7) in Kulsrud et al. (1971) with a surface mass density of 50 pc-2, a bending mode wave length of 2 kpc, and a vanishing in-plane velocity dispersion. The shearing of the disk is thus likely the dominant process by which the localized morphology of the kinematic imprint is erased.
The maximal velocity changes caused by the substructure are of the order of km s-1. This result agrees well with the prediction of equation (1) if we use the value appropriate for the given orbital parameters of the substructure (see appendix), identify with the scale radius of the substructure ( kpc), and with the mass within the scale radius ( ).
We can justify this choice of and as follows. Let the substructure have a dark matter density profile of NFW form (Navarro, Frenk & White, 1996). The enclosed mass within a given radius increases linearly with for , logarithmically with for , and quadratically with for . Hence, , and thus the maximal change of , is approximately constant for disk stars with impact parameter , but decreases with increasing impact parameter for and decreases with decreasing impact parameter for . Hence, the scale radius (here kpc) and the mass within the scale radius (here ) of the passing substructure are the characteristic sizes and masses that upon inserting into equation (1) result in the largest velocity changes. We can account for a potential tidal truncation of the outer density profile by using and as characteristic sizes and masses, respectively. Here, is the tidal radius and is the mass within the tidal radius.
We simplify equation (1) further by making use of the NFW shape of the density profile. Simply calculus shows that , where and is the concentration. is the virial mass of the substructure without tidal truncation or stripping, i.e., approximately the mass of the substructure when it first falls into the halo of the Galaxy. We note that tidal truncation of the NFW profile at has no bearing on the ratio . Virial mass and virial radius are related via the chosen overdensity criterion (here 200 times the critical density at ). The term lies between 1 and 2 for concentrations ranging from 1 to 25 ( for the concentration of our simulated substructure). We can thus ignore any reasonable change of concentration with virial mass without significant loss of accuracy. Combining these various relations we can show that the maximal velocity change is of the order of
| (2) |
Hence, substructures with (, ) result in typical velocity changes of the order of (, ) km s-1.
The kinematic signature of a MW – substructure interaction can be extracted without resorting to a reference simulation by spatially binning the data. Fig. 3 shows the average vertical velocity, , of disk stars in bins of pc2. In our simulations, bins at 8 kpc from the Galactic Center contain about 400 stellar particles. Consequently, the dispersion of is lower than the dispersion of by a factor . As Fig. 3 shows, the kinematic signature of the passing substructure is clearly visible in the binned vertical velocity.
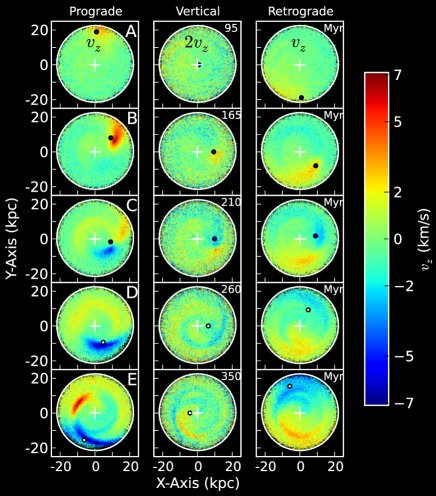 |
Fig. 3 shows also the results for a prograde and a retrograde orbit of the substructure. Compared with the vertical orbit, both the prograde and the retrograde orbit enhance the strength of the kinematic signature of the MW – substructure interaction. This is a consequence of the reduced vertical velocity of the substructure for an inclined orbit that results in a larger factor in equation (2), see also Appendix A. The increase of the kinematic signature is particularly dramatic for a prograde orbit as a result of the near matching of the orbital velocity of the satellite and the velocity of disk stars (Toomre & Toomre, 1972). The prograde passage of the substructure enhances the changes by more than a factor of 3 to about km s-1 at early and late times and to km s-1 during the collision of the substructure with the disk. In principle, a substructure on a co-rotating, grazing orbit could lead to even larger velocity changes.
The orbit of the substructure leaves tell-tale signatures in the spatial distribution of the vertical velocity changes, see Fig. 3C. For vertical orbits the kinematic signature is roughly circular in extent (at least until the shearing motion of the stellar disk distorts the shape). In contrast, a substructure on a prograde or retrograde orbit results in an aligned, elongated shape of the maximum. Hence, the measurement of high precision positions and velocities of stars across the MW disk may not merely enable the detection of dark matter substructures around the MW, but may also lead to a characterization of their orbital properties. We discuss additional runs with different orbital parameters in appendix C.
At late times (Fig. 3E) the velocity perturbances resist decay or may even grow in strength. Unfortunately, the shearing of the differentially rotating disk results in a large-scale spiral pattern which might be more difficult to categorize observationally than the localized kinematic imprint discussed above. Our worry is that the morphology, propagation, and strength of these late time disturbances are strongly influenced by the detailed structural properties of the whole MW system, i.e., the gradient of the rotation curve, the location of resonances, and the dynamics of the central bar.
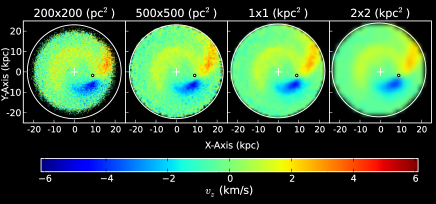
In Fig. 4, we test how the resolution of the spatial binning affects the detectability of the kinematic signal. The kinematic imprint of the substructure is clearly visible even for bins as large as 2 kpc2.
 |
Aside from the kinematic imprint, the passage of the substructure also induces density variations that vary, depending on the orbit type, between 10% and up to 40%, see Fig. 5. The strongest density variations occur for a prograde passage of the substructure, the weakest for a vertical orbit. The disk develops, rather generically, a dipole in density with one side over dense and the other under dense. Substructures on prograde and vertical orbits also excite extended arm-like density enhancements (Julian & Toomre, 1966), see Fig. 5C-E. Unfortunately, the generic morphology, the large spatial extent, and the non-uniqueness of the excitation mechanism will make it difficult to use the induced density variations as reliable tracers of substructures passing through the disk of the MW.
It is intriguing that these density perturbation induced by the passing substructure are only slightly weaker than those in spiral arms of observed nearby disk galaxies ( to , e.g., Rix & Zaritsky 1995). Hence, in addition to massive satellite galaxies (e.g., Toomre & Toomre 1972), low mass dark matter substructures (especially when on a prograde orbit) could be responsible for exciting coherent spiral structures on large scales in at least some disk galaxies.
 |
4 Rate and orbital parameters of substructures colliding with the MW disk
A critical question that arises naturally is whether collisions with the MW disk are sufficiently frequent to allow for a realistic chance of detecting sub-halos in future surveys. To answer this question we compute in this section the number of substructures that cross the disk over the life-time of the kinematic imprint ( Myr).
The substructure – disk collision rate scales with the mean speed of substructures, the number density of sub-substructures, and the geometric cross section of the disk with radius
| (3) |
The prefactor accounts for the likely scenario that the substructure crosses the disk twice per pericentric passage.
We calculate the average number density of substructures directly from the Aquarius simulation suite (Springel et al., 2008). Aquarius is a set of high-resolution N-body simulations of a MW like dark matter halo. The mass function of substructures is provided in equation (4) of Springel et al. (2008). The number density of substructures with masses above within a kpc radius around the main halo is
refers to the gravitationally bound mass of substructures in the Aquarius simulation at . As a consequence of tidal stripping this mass is significantly smaller (a factor 10 is typical111The Hill radius of a point mass at kpc from the center of the Galaxy with is about 1 kpc. A dark matter halo with an NFW profile has a scale radius that roughly coincides with this Hill radius. Hence, it will likely be tidally stripped down to the mass within the Hill radius, i.e., down to . This approximate correspondence between scale radius and tidal radius holds independent of the mass of the substructure (at fixed , , and ),because both radii scale with their respective masses in the same way .) than the virial mass of the substructure when it first entered the main halo.
 |
 |
 |
Springel et al. (2008) show that the number density of substructures can be well fit with an Einasto profile (Einasto, 1965) and that the shape parameters are independent of the substructure mass. Using the fit parameters provided in section 3.2 of Springel et al. (2008) we find that the mean interior number density of substructures of a given mass increases by a factor between kpc and kpc. Hence, the mean density of substructures with masses and within kpc is approximately
The mean density is not a very sensitive function of the enclosing radius, e.g., choosing kpc would increase it by only 40%.
The scale length of the MW disk is 2-3 kpc and its full spatial extent is about 15-20 kpc (Binney & Tremaine, 2008). Substructures that enter the central 20 kpc of the MW halo have typical speeds of km s-1 as we will demonstrate later in this section. Inserting km s-1, kpc, and into equation (3) we find
| (4) |
Hence, we expect several disk crossings per dynamical time of the MW disk for substructures with tidal masses above and virial masses above .
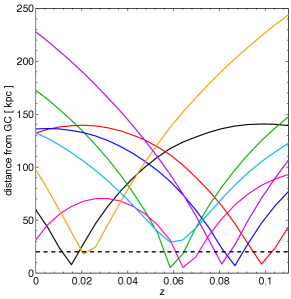
As a consistency check we also estimate the collision rate from publicly available substructure orbits provided by the Via-Lactea project222see http://www.ucolick.org/~diemand/vl/. Via-Lactea I is a cosmological N-body simulation that follows the formation of a MW like dark matter halo and resolves over 6000 substructures with a peak circular velocity above 5 km/s. We identify 8 substructures from Via-Lactea I that satisfy all three of the following conditions at some redshift (i.e., within the past 1.3 Gyr): (i) a bound mass above , (ii) a peak maximum rotation velocity above 20 km/s (to ensure that the virial mass at infall was ), and (iii) a position within 30 kpc from the Galactic Center, see left panel of Fig. 6. Seven out of the 8 substructures have a pericentric distance to the Galactic Center of less than 20 kpc and, hence, would intersect the disk of the MW. Given that most of these substructures would cross the disk twice we arrive at per 100 Myr, in reasonable agreement with our previous estimate (4).
We note that these estimates are only approximate. The mass of the MW halo and, thus, the expected abundance of dark matter substructures are constrained observationally only to within a factor of a few (e.g., Boylan-Kolchin et al. 2013). In addition, our estimates are based on pure dark matter simulations that neglect baryonic processes. Baryons can enhance the collision rate via adiabatic contraction and gravitational focusing. Conversely, the destruction of substructures in previous dynamical interactions with the disk could reduce the interaction rate by a factor 2-3 (D’Onghia et al., 2010).
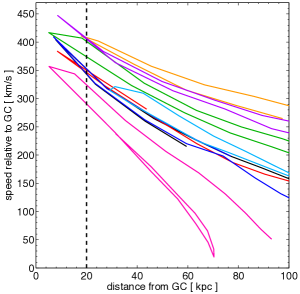
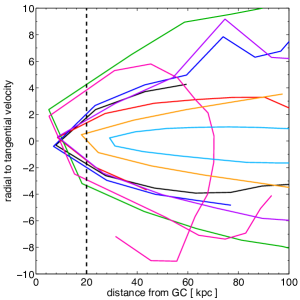
The orbits provided by the Via-Lactea simulation allow us to constrain the typical speeds and orbital parameters of substructures passing through the disk of the MW. In the middle panel of Fig. 6 we show the speed as function of distance from the Galactic Center for the 8 selected substructures (see above). Typical speeds are km/s depending on the chosen substructure and on the orientation between the orbit and the MW disk. The right panel of Fig. 6 shows that the radial to tangential velocity of substructures has a broad distribution ranging from nearly tangential motions (ratio ), to strongly radial motions (absolute value of the ratio ). We note that the substructure orbits chosen in this work reflect the range of typical speeds and radial to tangential velocities found in the Via-Lactea cosmological simulation, see Table 2 and Appendix B.
5 Detecting low mass substructures with Gaia
The upcoming astrometric mission Gaia will provide positions and motions for over a billion MW stars, observe objects out to 1 Mpc, and at a micro-arcsecond () precision (Perryman et al., 2001). Gaia is in fact ideally suited to search for the kinematic signatures of starless substructures orbiting the MW as we now demonstrate.
5.1 Measuring the mean velocity of disk stars with Gaia
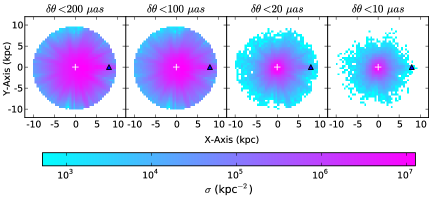
Gaia will be able to measure parallaxes to a precision333see Gaia Science Performance at http://www.cosmos.esa.int/web/gaia/science-performance of and proper motions to yr-1 for stars with an apparent magnitude brighter than 15 in the -band (which is the main photometric band for Gaia). We estimate that Gaia should observe about 105 disk stars per kpc2 with a parallax error less than (and a corresponding distance error of %) at a distance of 5 kpc. This surface density is sufficient to detect passing substructures of mass .
To arrive at this estimate we use the code Galaxia (Sharma et al., 2011) to create a realistic mock catalog of MW stars. The code returns the absolute magnitude of each star in the and the band, the distance to the star, and the extinction due to dust. We convert absolute magnitudes into apparent magnitudes using the known distances and dust extinctions and then use the fitting formulae provided by Jordi et al. (2010) to estimate the parallax error of each star.
In Fig. 7, we show the surface density of stars for which Gaia is able to measure parallaxes to better than a specified parallax error. We expect that Gaia will observe more than 105 (107, 103) disk stars per kpc2 at a 5 (2.5, 10) kpc distance with a parallax error better than 20 as.
The parallax error determines both the distance error and the velocity error transverse to the line of sight for a particular star and thus has a strong impact on the ability of Gaia to detect low mass substructures. Given and , the relative distance error for a star equals the relative parallax error and the velocity error scales as + . Given a typical transverse velocity of km s-1 of a star at kpc from the Sun444To obtain this estimate we model the disk of the Milky Way as a cold stellar disk rotating at km s-1 with the Sun at kpc from the Galactic Center. The relative transverse velocity of stars at 5 kpc from the Sun in a Galactic rest frame varies between 0 km s-1 and km s-1, with an angle average velocity of km s-1., a parallax error , and a corresponding proper motion error3 , we find that km s-1. The precision on distance and transverse velocity degrade quickly with distance555Beyond parallax, we have not considered better techniques which could improve measuring the location of a star along the line of sight. For example, given that the angular velocity of a star changes strongly as a function of radius from the Galactic Center one could use the angular velocity to help locate the position of a star along the line of sight which may significantly reduce distance errors. We will leave such possibilities for the future., however. For instance, they are 125 pc and km s-1 for stars at 2.5 kpc distance, but 2 kpc and km s-1 for stars 10 kpc from the Sun.
In the simplest scenario (Poisson noise) the error of the spatially averaged velocity scales with the observed stellar velocity dispersion and with one over the square root of the number of stars N in the given spatial bin, i.e.,
| (5) |
Both the intrinsic stellar velocity dispersion of stars in the Milky Way disk and the transverse velocity errors contribute to . For stars at kpc is dominated by the intrinsic velocity dispersion ( km s-1 in the solar neighborhood), while for kpc the velocity errors and the intrinsic velocity dispersion contribute about equally. Hence, unless additional complications arise (see below) the average velocity can be measured to better than km s-1 accuracy if the spatial bins contain more than 103 stars. This accuracy is sufficient to detect any 109 substructure that passes through the MW disk within a 10 kpc distance. In addition, 108 substructures can be detected if they collide with the MW disk on prograde orbits. Furthermore, with 105 stars per bin can be constrained to better than 0.08 km s-1, which is sufficient to detect any 108 substructure (as well as 107 substructures on prograde orbits) within a 5 kpc distance.
5.2 Caveats
A variety of complications could potentially diminish the sensitivity of the proposed detection method. First, nearby stars may have correlated velocities, reducing the effective number of independent velocity measurements. However, outside of stellar clusters and associations, this effect should be small and, given the size of the Gaia data set, should not constitute a limiting factor for measuring accurate spatially averaged velocities.
A second and potentially more serious issue is whether Gaia can distinguish km s-1 velocity disturbances caused by a passing substructure from fluctuations caused by other sources. Focusing on the vertical velocity simplifies matters because spiral arms typically excite velocity variations in the plane of the disk (Binney & Tremaine, 2008). Furthermore, stellar density waves in the vertical direction should die out on reasonably fast time scales (Widrow et al., 2012). Most importantly, however, the unique morphology of the highly localized maxima and/or minima clearly distinguishes the changes that result from a passing substructure from the changes caused by a density wave.
Third, molecular clouds, star clusters, globular clusters, and satellite galaxies may affect the velocities of disk stars. However, these objects are visible, while the telltale sign of low mass dark matter substructure is a perturbation of the disk without a visible counterpart. Globular clusters are also not a concern given their low masses and their spatial distribution that is concentrated toward the Galactic Center.
Our simulations focused on a single encounter between a dark substructure and the disk of the MW. A potential concern is that the long-levity of bending and spiral modes excited by previous passages may mask the (weak) kinematic imprint of subsequent collisions. We hope to address this important question in future work.
6 Summary and conclusions
We have studied the impact of low mass dark matter substructures as they pass through the disk of the MW with the help of high resolution numerical simulations. Our main findings are as follows
-
•
The passage of a substructure results in distinct, coherent variations in the vertical velocities of disk stars. The morphology of the kinematic signal clearly distinguishes it from other disturbances such as spiral waves. The spatial size of the signature is of the order of the scale radius of the passing substructure. The strength of the kinematic disturbance scales with the mass contained within the scale radius of the substructure.
-
•
For a low mass substructure ( , ) the velocity changes are of the order of one to several km s-1, depending on the orbit of the substructure. A prograde orbit results in the strongest signal, a vertical orbit in the weakest signal. The kinematic signature is coherent on scales of a few kpc.
-
•
If CDM theory is correct, we expect about 2-20 dark matter substructures with virial masses to collide with the disk of the MW per dynamical time ( Myr). Given the long lifetimes ( Myr) of the kinematic signature of a substructure passage through the MW disk, we expect potentially several such signatures be present at any given time.
-
•
The Gaia space mission is ideally suited to search for these kinematic signatures given its unprecedented accuracy in distance and velocity measurements, its large spatial coverage and sample size. Data from the Gaia mission should allow to detect starless dark matter substructure with masses . Whether substructures of even lower masses can be detected in the same way depends on the presently unknown strength and properties of low-level vertical velocity perturbations across the MW disk.
Interestingly, recent observations indicate significant variations of the mean vertical velocity at moderate heights above and below the disk plane (Widrow et al., 2012; Williams et al., 2013; Carlin et al., 2013). The origin of this kinematic feature is unknown, but it may well be a density wave excited by an external perturber (Widrow et al., 2012; Carlin et al., 2013; Widrow et al., 2014). The observed variations are of the order of km s-1 at a kpc height above/below the stellar disk. They are significantly weaker ( km s-1), however, at lower altitudes and thus potentially reflect the kinematic imprint of a low mass dark matter substructure passing through the MW disk. A crucial next step in understanding the origin of the kinematic feature will be to map the large scale (kpc) morphology of the feature and to compare it with theoretical predictions, such as those provided in Fig. 3.
The detection of individual low-mass substructures orbiting the MW will complement the estimates of cumulative substructure fractions in distant galaxies based on gravitational lensing measurements (Mao & Schneider, 1998; Dalal & Kochanek, 2002). In addition, the high precision astrometric data from Gaia will hopefully allow to put constraints on the orbital properties and the mass function of the starless substructures. As such, the proposed experiment will provide the basis for a crucial test of the CDM paradigm, leading potentially to new insights into the nature of dark matter and the physics of galaxy formation in low mass halos.
Acknowledgments
We thank the anonymous referee for their valuable comments that helped improving the quality and clarity of the paper. We are grateful to Joe Silk, Matt Lehnert, and Matt McQuinn for constructive comments. We also thank Larry Widrow for providing us with the latest version of the GalactICS code and with the parameters of the MW model. R.F. acknowledges support for this work by NASA through Hubble Fellowship grant HF-51304.01-A awarded by the Space Telescope Science Institute, which is operated by the Association of Universities for Research in Astronomy, Inc., for NASA, under contract NAS 5-26555. The research of D.S. has been supported at IAP by the ERC project 267117 (DARK) hosted by Université Pierre et Marie Curie - Paris 6. This work made extensive use of the NASA Astrophysics Data System and arXiv.org preprint server.
References
- Barkana & Loeb (1999) Barkana R., Loeb A., 1999, ApJ, 523, 54
- Benson et al. (2004) Benson, A. J., Lacey, C. G., Frenk, C. S., Baugh, C. M., & Cole, S. 2004, MNRAS, 351, 1215
- Binney & Tremaine (2008) Binney J., Tremaine S., 2008, Galactic Dynamics: Second Edition. Princeton University Press
- Bode et al. (2001) Bode, P., Ostriker, J. P., & Turok, N. 2001, ApJ, 556, 93
- Boylan-Kolchin et al. (2013) Boylan-Kolchin M., Bullock J. S., Sohn S. T., Besla G., van der Marel R. P., 2013, ApJ, 768, 140
- Bullock, Kravtsov & Weinberg (2000) Bullock J. S., Kravtsov A. V., Weinberg D. H., 2000, ApJ, 539, 517
- Calcáneo-Roldán & Moore (2000) Calcáneo-Roldán, C., & Moore, B. 2000, Phys. Rev. D, 62, 123005
- Carlberg & Grillmair (2013) Carlberg R. G., Grillmair C. J., 2013, ApJ, 768, 171
- Carlin et al. (2013) Carlin, J. L., DeLaunay, J., Newberg, H. J., et al. 2013, ApJ, 777, L5
- Carr & Lacey (1987) Carr, B. J., & Lacey, C. G. 1987, ApJ, 316, 23
- Cole & Weinberg (2002) Cole, A. A., & Weinberg, M. D. 2002, ApJ, 574, L43
- Dalal & Kochanek (2002) Dalal N., Kochanek C. S., 2002, ApJ, 572, 25
- Dehnen & Binney (1998) Dehnen W., Binney J., 1998, MNRAS, 294, 429
- Diemand, Kuhlen & Madau (2007) Diemand J., Kuhlen M., Madau P., 2007, ApJ, 657, 262
- D’Onghia et al. (2010) D’Onghia E., Springel V., Hernquist L., Keres D., 2010, ApJ, 709, 1138
- Dubinski et al. (2008) Dubinski, J., Gauthier, J.-R., Widrow, L., & Nickerson, S. 2008, Formation and Evolution of Galaxy Disks, 396, 321
- Einasto (1965) Einasto, J. 1965, Trudy Astrofizicheskogo Instituta Alma-Ata, 5, 87
- Faure et al. (2014) Faure, C., Siebert, A., & Famaey, B. 2014, MNRAS, 440, 2564
- Gauthier et al. (2006) Gauthier, J.-R., Dubinski, J., & Widrow, L. M. 2006, ApJ, 653, 1180
- Gómez et al. (2012) Gómez, F. A., Minchev, I., Villalobos, Á., O’Shea, B. W., & Williams, M. E. K. 2012, MNRAS, 419, 2163
- Gómez et al. (2012) Gómez, F. A., Minchev, I., O’Shea, B. W., et al. 2012, MNRAS, 423, 3727
- Gómez et al. (2013) Gómez, F. A., Minchev, I., O’Shea, B. W., et al. 2013, MNRAS, 429, 159
- Hernquist (1990) Hernquist L., 1990, ApJ, 356, 359
- Hernquist (1993) Hernquist L., 1993, ApJS, 86, 389
- Huang & Carlberg (1997) Huang, S., & Carlberg, R. G. 1997, ApJ, 480, 503
- Hunter & Toomre (1969) Hunter, C., & Toomre, A. 1969, ApJ, 155, 747
- Ibata et al. (2002) Ibata R. A., Lewis G. F., Irwin M. J., Quinn T., 2002, MNRAS, 332, 915
- Jiang & Binney (2000) Jiang, I.-G., & Binney, J. 2000, MNRAS, 314, 468
- Johnston, Spergel & Haydn (2002) Johnston K. V., Spergel D. N., Haydn C., 2002, ApJ, 570, 656
- Jordi et al. (2010) Jordi C. et al., 2010, A&A, 523, A48
- Julian & Toomre (1966) Julian, W. H., & Toomre, A. 1966, ApJ, 146, 810
- Kazantzidis et al. (2008) Kazantzidis, S., Bullock, J. S., Zentner, A. R., Kravtsov, A. V., & Moustakas, L. A. 2008, ApJ, 688, 254
- Kuhlen, Vogelsberger & Angulo (2012) Kuhlen M., Vogelsberger M., Angulo R., 2012, Physics of the Dark Universe, 1, 50
- Kuijken & Dubinski (1995) Kuijken K., Dubinski J., 1995, MNRAS, 277, 1341
- Kulsrud et al. (1971) Kulsrud, R. M., Mark, J. W. K., & Caruso, A. 1971, Ap&SS, 14, 52
- Lacey & Ostriker (1985) Lacey, C. G., & Ostriker, J. P. 1985, ApJ, 299, 633
- Lake (1990) Lake, G. 1990, Nature, 346, 39
- Mao & Schneider (1998) Mao S., Schneider P., 1998, MNRAS, 295, 587
- Merritt & Sellwood (1994) Merritt, D., & Sellwood, J. A. 1994, ApJ, 425, 551
- Moore et al. (1999) Moore B., Ghigna S., Governato F., Lake G., Quinn T., Stadel J., Tozzi P., 1999, ApJ, 524, L19
- Navarro, Frenk & White (1996) Navarro J. F., Frenk C. S., White S. D. M., 1996, ApJ, 462, 563
- Navarro, Frenk & White (1997) Navarro J. F., Frenk C. S., White S. D. M., 1997, ApJ, 490, 493
- Okamoto, Gao & Theuns (2008) Okamoto T., Gao L., Theuns T., 2008, MNRAS, 390, 920
- Perryman et al. (2001) Perryman M. A. C. et al., 2001, A&A, 369, 339
- Quinn et al. (1993) Quinn, P. J., Hernquist, L., & Fullagar, D. P. 1993, ApJ, 403, 74
- Purcell et al. (2011) Purcell, C. W., Bullock, J. S., Tollerud, E. J., Rocha, M., & Chakrabarti, S. 2011, Nature, 477, 301
- Prugniel & Simien (1997) Prugniel P., Simien F., 1997, A&A, 321, 111
- Rix & Zaritsky (1995) Rix, H.-W., & Zaritsky, D. 1995, ApJ, 447, 82
- Rix & Bovy (2013) Rix H.-W., Bovy J., 2013, A&A Rev., 21, 61
- Sellwood et al. (1998) Sellwood, J. A., Nelson, R. W., & Tremaine, S. 1998, ApJ, 506, 590
- Sharma et al. (2011) Sharma S., Bland-Hawthorn J., Johnston K. V., Binney J., 2011, Galaxia: A Code to Generate a Synthetic Survey of the Milky Way. Astrophysics Source Code Library
- Siegal-Gaskins & Valluri (2008) Siegal-Gaskins J. M., Valluri M., 2008, ApJ, 681, 40
- Sparke (1984) Sparke, L. S. 1984, ApJ, 280, 117
- Springel et al. (2008) Springel V. et al., 2008, MNRAS, 391, 1685
- Springel & White (1999) Springel V., White S. D. M., 1999, MNRAS, 307, 162
- Stadel (2001) Stadel J. G., 2001, PhD thesis, UNIVERSITY OF WASHINGTON
- Toomre (1969) Toomre, A. 1969, ApJ, 158, 899
- Toomre & Toomre (1972) Toomre, A., & Toomre, J. 1972, ApJ, 178, 623
- Toomre (1977) Toomre, A. 1977, ARA&A, 15, 437
- Toth & Ostriker (1992) Toth, G., & Ostriker, J. P. 1992, ApJ, 389, 5
- Tremaine et al. (2002) Tremaine S. et al., 2002, ApJ, 574, 740
- Viel et al. (2005) Viel, M., Lesgourgues, J., Haehnelt, M. G., Matarrese, S., & Riotto, A. 2005, Phys. Rev. D, 71, 063534
- Wadsley, Stadel & Quinn (2004) Wadsley J. W., Stadel J., Quinn T., 2004, New Astronomy, 9, 137
- Walker et al. (1996) Walker, I. R., Mihos, J. C., & Hernquist, L. 1996, ApJ, 460, 121
- Widrow & Dubinski (2005) Widrow L. M., Dubinski J., 2005, ApJ, 631, 838
- Widrow, Pym & Dubinski (2008) Widrow L. M., Pym B., Dubinski J., 2008, ApJ, 679, 1239
- Widrow et al. (2012) Widrow L. M., Gardner S., Yanny B., Dodelson S., Chen H.-Y., 2012, ApJ, 750, L41
- Widrow et al. (2014) Widrow, L. M., Barber, J., Chequers, M. H., & Cheng, E. 2014, MNRAS, 440, 1971
- Williams et al. (2013) Williams, M. E. K., Steinmetz, M., Binney, J., et al. 2013, MNRAS, 436, 101
- Yanny & Gardner (2013) Yanny, B., & Gardner, S. 2013, ApJ, 777, 91
- Zechlin & Horns (2012) Zechlin H.-S., Horns D., 2012, J. Cosmology Astropart. Phys., 11, 50
- Zentner & Bullock (2003) Zentner A. R., Bullock J. S., 2003, ApJ, 598, 49
- Zhao (1996) Zhao H., 1996, MNRAS, 278, 488
Appendix A Velocity change induced by a passing substructure
The gravitational pull of a substructure orbiting in the MW halo affects the velocity of stars in the stellar disk. We can estimate the magnitude and spatial extent of this perturbation using the free-particle approximation of the disk star motion. Our specific setup is as follows.
We choose a coordinate system in which is the mid-plane of the disk and the star is at rest at position . The orbiting substructure moves at constant velocity and passes through the coordinate origin at , i.e., . The impact parameter of the interaction is
The unbound gravitational interaction between two point masses is covered in standard textbooks (e.g., Binney & Tremaine 2008). The gravitational encounter between a disk star with mass and a point-like substructure with mass results in the change of their relative velocity with
Here, is the impact parameter that leads to a deflection and . Note that and point in the direction opposite to and , respectively. The velocity change of the disk star is (since ), i.e.,
| (6) |
The latter approximation is valid in the limit .
 |
 |
The spatial extent of the substructure prevents the large velocity changes associated with in (6). We model the finite size of the substructure by rescaling in a continuous fashion with the impact parameter. Specifically, we make the following ansatz that mimics the radial scaling of a dark matter halo with a truncated NFW profile (Navarro, Frenk & White, 1996, 1997) and scale radius .
Without loss of generality we can align the -plane s.t. a given disk star lies at and we neglect the height of the disk (i.e., ). It will prove useful to describe the Cartesian components of using spherical coordinates, i.e., , , and . We now compute the maximal change in the velocity component of disk stars due to a perturbing substructure with a given velocity . First, we maximize over the polar angle and then over the distance . For and a given
is maximized or minimized for . For (, ) the magnitude increases (remains constant, decreases) with decreasing . Hence, the maximum and minimum of the vertical velocity perturbations of disk stars occur at a distance from the impact point of the substructure and lie along the projected path of the substructure. The typical spatial extent of these velocity peaks is half their separation. The peak velocity changes are
| (7) |
The corresponding results for the , and velocity components can be derived in a similar manner. The results are
| (8) | ||||
| (9) |
An accurate measurement of , , and allows to infer , , and the combination using (7-9).
In Fig. 8 we show the z-component of the stellar velocity perturbation as predicted by equation (6) for a spatially extended substructure with mass and kpc. These values as well as the velocity angles and and the relative speed are chosen to mimic the low speed, vertical orbit of the substructure discussed in the main text of this paper. The velocity disturbances reach a magnitude of km s-1 and have a spatial extent of a few kpc. The differential rotation of the stellar disk results in winding of the velocity disturbances. Nonetheless, as the right panel in Fig. 8 shows, a pronounced kinematic double peak structure is expected to remain visible for yr (see also Fig. 3).
So far we used a coordinate frame in which the unperturbed disk star is at rest. We now switch to a coordinate system in which the Galactic Center is at rest. For simplicity we assume that the star moves in the disk (-) plane along the direction and the substructure moves in the - plane. In this case the sine of the inclination angle ( is defined as the angle between the orbital plane of the substructure and the plane of the disk of the MW) is also the sine of the angle between the velocity of the disk star and the velocity of the substructure and we obtain
with , , , , , and .
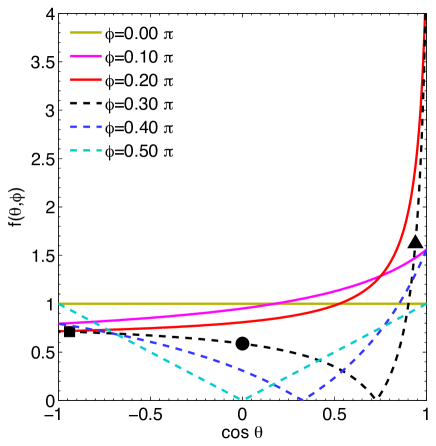 |
We plot the velocity factor as a function of inclination angle in Fig. 9. Clearly, the velocity factor is of order unity for many choices of and . In addition, the figure demonstrates the following:
-
•
If , the speed of the substructure is smaller than the speed of the star, i.e., . In this case the velocity factor decreases monotonically with inclination angle. The velocity factor can become large for , i.e., if the substructure has a large velocity component along the motion of the star. In contrast, the velocity factor is reduced if the substructure has a large velocity component opposite to the motion of the star. We note that if the velocity factor never drops below .
-
•
If , the velocity factor is and independent of .
-
•
If , the speed of the substructure is larger than the speed of the star, i.e., . In this case the velocity factor is non-monotonic and drops to zero for .
These analytic predictions help us to understand why the change of in our numerical simulations is strongest for the prograde orbit, weakest for the vertical orbit of the substructure, and of intermediate strength for the retrograde orbit (see Fig. 3 of the paper). Here, km/s, km/s and, hence, . Furthermore, for the prograde orbit, for the vertical orbit, for the retrograde orbit. Inserting and into the analytic expression for the velocity factor, we find for the prograde orbit, for the vertical orbit, and for the retrograde orbit. Hence, the prograde and retrograde orbits result in stronger changes of than a vertical orbit.
Appendix B Details of the simulation set-up
Modeling of the MW:
We use the tool GalactICS (Kuijken & Dubinski, 1995; Widrow & Dubinski, 2005; Widrow, Pym & Dubinski, 2008) to set up an approximately steady-state model of the MW, consisting of a stellar disk, a stellar bulge, and a dark matter halo. GalactICS simultaneously solves the collisionless Boltzmann equation and the Poisson equation of the total system to obtain close-to-equilibrium distribution functions for each of the specified galaxy components. It then samples these distribution functions to construct an N-body model of a galaxy. GalactICS requires various input parameters that determine the geometrical and kinematic properties of the galaxy.
Our MW model uses the parameters of the & model of Widrow, Pym & Dubinski (2008). Specifically, the stellar disk has mass , an exponential surface density profile with scale radius kpc, and a sech2 density profile in the vertical direction with scale height kpc. The radial velocity dispersion at the Galactic Center is km/s. The exponential scale length of is kpc, i.e., the same as the scale length of the density of the stellar disk.
The stellar bulge has a density profile that yields the Sersic profile in projection (Prugniel & Simien, 1997) with Sersic index , a mass of , a projected half mass radius of kpc and a velocity scale, see Widrow, Pym & Dubinski (2008), of 289.6 km/s. The dark matter halo has an NFW profile (Navarro, Frenk & White, 1996, 1997) of generalized form (Hernquist, 1990; Zhao, 1996) with a central cusp of , an outer slope of 3, a scale radius kpc and a velocity scale km/s. We smoothly truncate the dark matter density beyond a radius of 200 kpc over a 20 kpc width. The mass of the halo within 200 kpc is .
As shown by Widrow, Pym & Dubinski (2008) this galaxy model is in good agreement with observational data, see Dehnen & Binney (1998); Tremaine et al. (2002) and references therein. For instance, the model reproduces the inner and outer rotation curves, the Oort constant, the vertical force in the solar neighborhood, the total mass at large radii, and the line-of-sight velocity dispersion of the bulge.
| label | |||
|---|---|---|---|
| (∘) | (kpc) | (km/s) | |
| vertical | 90 | (-12.91, 0, 22.66) | (123.3, 0, 34.22) |
| prograde | 20 | (-12.91, -21.29, 7.75) | (123.3, -32.16, 11.71) |
| retrograde | 160 | (-12.91, 21.29, 7.75) | (123.3, 32.16, 11.71) |
| vx(-400) | 90 | (-28.81, 0, -0.6045) | (279.5, 0, 61.59) |
| vx(+400) | 90 | (35.22, 0, 16.27) | (-226.8, 0, -144.1) |
| vx(+320) | 90 | (-26.54, 0, 13.49) | (297.3, 0, -57.93) |
| vx(-320) | 90 | (28.24, 0, 25.99) | (-155.3, 0, -233.6) |
| vx(+200) | 90 | (-17.86, 0, 23.88) | (245.1, 0, -156.8) |
| vx(-200) | 90 | (17.25, 0, 31.55) | (-52.13, 0, -274.2) |
| vz(450) | 90 | (-1.08, 0, 33.05) | (117.6, 0, -269.9) |
| label | speed | orbit type | expected | |||||
|---|---|---|---|---|---|---|---|---|
| (km/s) | (kpc) | (km/s) | (km/s) | (∘) | (km/s) | |||
| vertical | low | vertical | 288 | (11.45, 0) | (-4.6, 0, -288) | 356 | (144, -91) | 1.20 |
| prograde | low | incl. & progr. | 292 | (10.97, -1.96) | (12.4, 270, -110) | 129 | (148, 121) | 2.96 |
| retrograde | low | incl. & retrogr. | 291 | (11.05, 1.68) | (8.3, -270, -108) | 492 | (103, -93) | 1.45 |
| vx(+400) | high | vert. & outw. | 446 | (7.1, 0) | (398, 0, -202) | 493 | (114, -28) | 1.35 |
| vx(-400) | high | vert. & inw. | 448 | (7.7, 0) | (-400, 0, -202) | 495 | (114, -152) | 1.34 |
| vx(+320) | high | vert. & outw. | 451 | (7.7, 0) | (319, 0, -319) | 498 | (130, -33) | 1.12 |
| vx(-320) | high | vert. & inw. | 448 | (8.5, 0) | (-317, 0, -317) | 495 | (130, -146) | 1.13 |
| vx(+200) | high | vert. & outw. | 445 | (7.8, 0) | (194, 0, -400) | 492 | (144, -47) | 0.86 |
| vx(-200) | high | vert. & inw. | 449 | (8.1, 0) | (-203, 0, -400) | 495 | (144, -134) | 0.87 |
| vz(450) | high | vertical | 452 | (8.2, 0) | (0, 0, -452) | 498 | (155, -90) | 0.62 |
Modeling of the substructure:
We construct an N-body model of the orbiting dark matter substructure using a standard procedure widely used in the literature (Hernquist, 1993; Springel & White, 1999). The substructure has a conventional NFW profile with concentration and a virial mass within the radius kpc. The mass within the scale radius kpc is . We smoothly truncate the density outside . The average density within corresponds to an overdensity of 200 times the critical density in the present universe. The virial velocity of the substructure is 15 km/s.
Setup of the substructure – MW interaction:
We create the appropriate starting position and velocity of the substructure for the vertical case by running a lower resolution simulation of the inverted problem. Specifically, we chose a coordinate frame in which the MW model is centered on the coordinate origin and the angular momentum of the MW disk points in the -direction. We then place the center of the substructure on the -axis a certain distance (7-12 kpc) from the Galactic Center. We further give the substructure velocity components in the and -directions. The subhalo speed is km s-1 ( km s-1) in the low (high) speed set-up. We evolve this system forward past the point at which the substructure turns around and falls back towards the disk.We then record the position and the velocity of the density peak of the substructure. Subsequently, we create the initial conditions for the actual substructure – MW simulation by placing the center of the substructure at position and by assigning the substructure the center-of-mass velocity . We create initial conditions for the inclined cases by rotating the orbital plane of the substructure around the -axis.The specific initial positions and velocities of the substructure for each run can be found in Table 3.
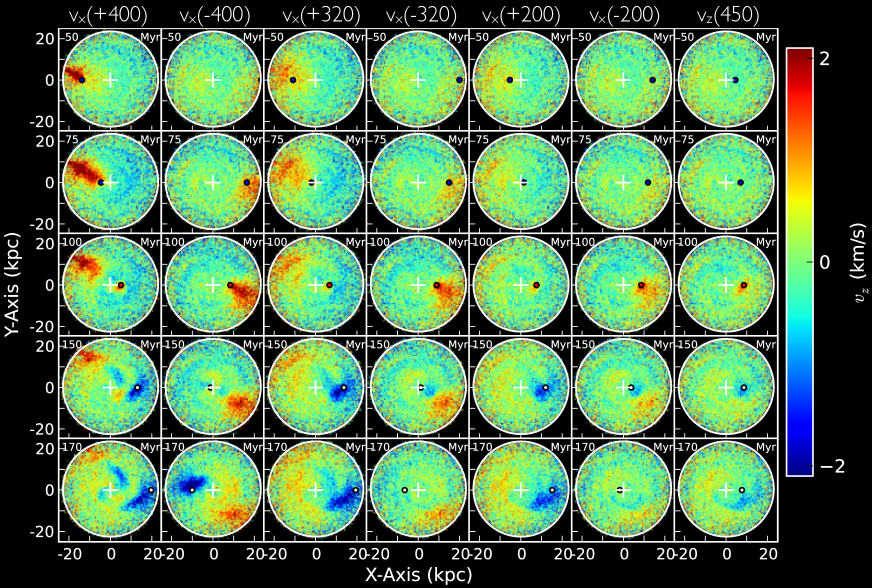
Appendix C Simulations with additional orbital parameters
We provide information about the orbital parameters of each substructure – MW collision simulations in Table 4, including the speed of substructure at impact, the impact coordinates, and velocity components. We use the latter information to estimate the maximum change of the vertical velocity according to equation (7). We expect that the additional (high speed) encounters result in velocity changes of somewhat reduced amplitude compared with the low velocity collisions discussed in the main text. Furthermore, the amplitudes should depend on the inclination of the substructure orbit with respect to the plane of the MW disk. Specifically, orbits with higher in-plane velocity components should show a larger velocity impulse.
These expectations are confirmed by Fig. 10, which plots the vertical velocity changes for each of the additional (high speed) simulations at multiple epochs. The morphologies of the kinematic imprint show some variety, but are generally not too dissimilar from the results shown in Fig. 3. For instance, the , , and runs look similar to the “vertical” case shown in the middle column of Fig. 3, while the , and share similarities (e.g., the wedge-like early velocity peak and the tracing of the velocity trough by the substructure at late times) with the “prograde” case shown in the first column of Fig. 3.
 |
Appendix D The angular and radial velocity of stars in the disk
 |
 |
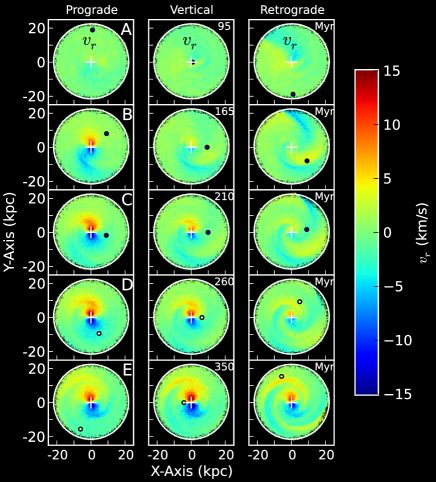
In the left panel of Fig. 11, we plot the change of the mean velocity in the radial direction . Similar to Fig. 5 we notice a dipole-like structure and a wave, but now in velocity rather than in density. The velocity dipole is oriented perpendicular to the impact site of the substructure and has opposite polarity for the prograde and retrograde case. At late times stars move in bulk away from the substructure in the prograde case and stars move toward the substructure in the retrograde case. We note that the density dipole described in the paper is rotated by degrees with respect to the velocity dipole in Fig. 11. In sum, perturbations in the mean motion of track the motion of density perturbation more so than the motion of the satellite.
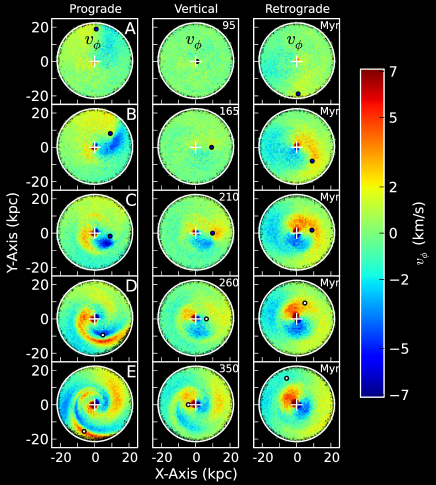
In the right panel of Fig. 11, we plot the change of mean angular velocity . The disk rotates in a clockwise manner in this figure. We have subtracted the average rotation velocity of each star prior to binning. In panels A-D in the prograde case the bulk motion (positive/negative for a satellite above/below the disk) correlates with the position of the satellite. A similar result can be seen in panels B and C in the retrograde and vertical cases. In panel A of the middle column (vertical orbit) the substructure has yet to perturb the motion of the disk significantly. In the bottom row (140 Myr after the substructure – disk collision), a velocity perturbation persists, but does not clearly track the motion of the disk.