Purely dry mergers do not explain the observed evolution of massive early-type galaxies since
Abstract
Several studies have suggested that the observed size evolution of massive early-type galaxies (ETGs) can be explained as a combination of dry mergers and progenitor bias, at least since . In this paper we carry out a new test of the dry-merger scenario based on recent lensing measurements of the evolution of the mass density profile of ETGs. We construct a theoretical model for the joint evolution of the size and mass density profile slope driven by dry mergers occurring at rates given by cosmological simulations. Such dry-merger model predicts a strong decrease of with cosmic time, inconsistent with the almost constant inferred from observations in the redshift range . We then show with a simple toy model that a modest amount of cold gas in the mergers – consistent with the upper limits on recent star formation in ETGs – is sufficient to reconcile the model with measurements of . By fitting for the amount of gas accreted during mergers, we find that models with dissipation are consistent with observations of the evolution in both size and density slope, if % of the total final stellar mass arises from the gas accreted since . Purely dry merger models are ruled out at CL. We thus suggest a scenario where the outer regions of massive ETGs grow by accretion of stars and dark matter, while small amounts of dissipation and nuclear star formation conspire to keep the mass density profile constant and approximately isothermal.
Subject headings:
galaxies: elliptical and lenticular, cD — galaxies: evolution1. Introduction
One of the challenges faced by cosmological models is reproducing the observed population of massive quiescent galaxies across cosmic times. In recent years, there has been growing interest in the problem posed by the apparent rapid size evolution of quiescent galaxies between and (e.g. Daddi et al. 2005; Trujillo et al. 2006; van Dokkum et al. 2008; Cassata et al. 2011). How much the evolution of the mass-size relation corresponds to a physical size growth of individual objects as opposed to progenitor bias is still under debate (Newman et al. 2012; Carollo et al. 2013; Belli et al. 2013).
Theoretical studies aimed at matching the observed size evolution of quiescent galaxies have focused on dissipationless (dry) mergers (Naab et al. 2009; Nipoti et al. 2009a; van der Wel et al. 2009; Hopkins et al. 2010; Oser et al. 2012; Hilz et al. 2013), as the low star formation rates measured in these galaxies leaves little room for a significant occurrence of dissipative (wet) mergers. The predicted and observed merger rates in a dry-merger scenario, while still insufficient to reproduce the size growth observed at , seem to be able to account for the late () size evolution of quiescent galaxies (Nipoti et al. 2012; Newman et al. 2012; Posti et al. 2013). In particular, Nipoti et al. (2012) have shown that, on average, the predictions of a purely dry merger model are marginally consistent with the observationally inferred evolution of the and relations in the redshift range . Dry mergers, however, appear difficult to reconcile with the tightness of the observed scaling relations (Nipoti et al. 2009a, 2012; Shankar et al. 2013). It is not clear then if models based purely on dry mergers can capture the relevant aspects of the evolution of early-type galaxies (ETGs), or if additional physical ingredients are required. In order to make progress, new observational tests are needed.
We introduce in this paper a new test by adding to the size-evolution constraints the recent measurement of the evolution of the slope of the total density profile of massive () ETGs in the range . Sonnenfeld et al. (2013b) show that ETGs increase in mass and size while keeping their density slope approximately constant and close to isothermal (). By combining these two observational constraints we show that an evolution driven by purely dry mergers is ruled out, and some amount of dissipation is needed.
The paper is organized as follows. In Section 2 we construct a dry-merger evolutionary model and we compare with observations the evolution of for a sample of mock galaxies. In Section 3 we extend the model by including dissipation in the mergers and compare the predictions of this new model with observations. In Section 4 we quantify the amount of dissipation needed to fit both observational constraints and compare. We then discuss our results in Section 5 and conclude in Section 6.
2. Dry mergers
2.1. Evolution in mass, size, and density slope
In the dry-merger scenario, galaxies increase their stellar and dark mass by accreting material from other galaxies. No new stars are generated during or after the merging process. Nipoti et al. (2012) presented an analytic model, based on both cosmological and galaxy-merger -body simulations, which allows to compute the dry-merging driven evolution of halo mass , stellar mass , effective radius and velocity dispersion, expected for spheroidal galaxies in CDM cosmology. We refer the reader to Nipoti et al. (2012) for a detailed description of the model: here we just recall that the merger rate, as a function of , and merger mass ratio , is the one measured in the Millennium simulations (Fakhouri et al. 2010) and that the variations in and are related by
| (1) |
where is the logarithmic slope of the stellar mass-size relation (). The model depends on few parameters (essentially and the minimum merger mass ratio ) and on the stellar-to-halo mass relation (SHMR) used to associate halo and stellar masses. Here we adopt the model of Nipoti et al. (2012) with , and Leauthaud et al. (2012) SHMR, but we verified that our results do not depend significantly on these choices.
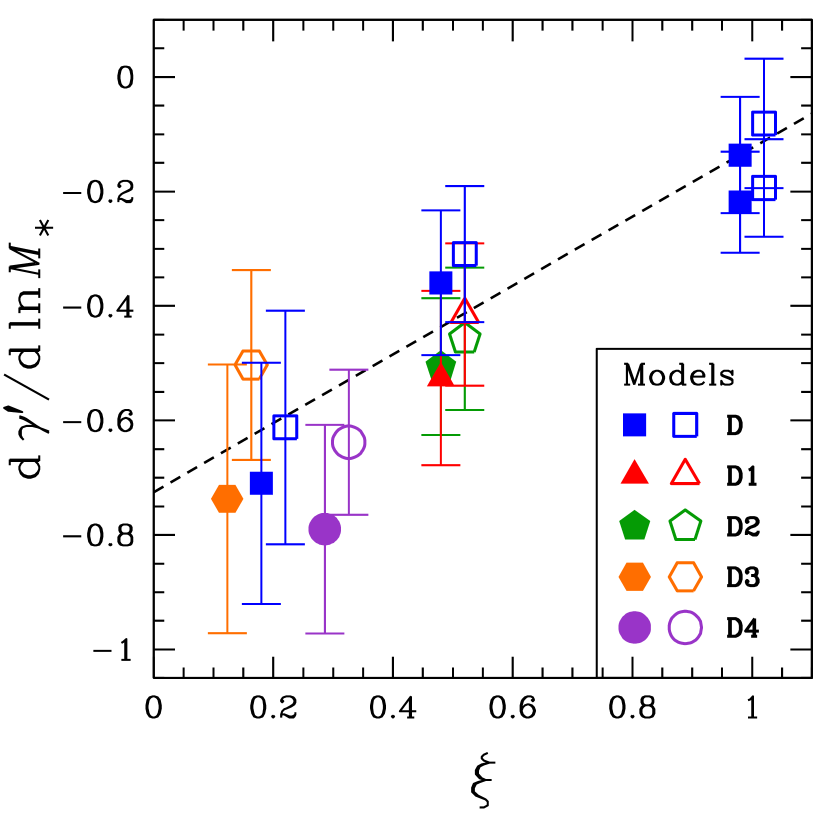
In this paper we extend the model by computing the change in the slope of the total density profile to be compared with measurements of the same quantity from the lensing and stellar kinematics study of Sonnenfeld et al. (2013b). In practice, we need a formula analogous to equation (1), which gives expected for dry mergers as a function of the merger mass ratio of . For this purpose, we use a set of dissipationless binary-merger -body simulations, which are described in Section 2.2. The analysis of these -body calculations leads us to parameterize the change in resulting from mergers of mass ratio as
| (2) |
with and (dashed line in Figure 1). In practice, dry mergers make the density profile shallower and, for the same amount of total accreted mass, minor mergers are more effective at changing the density slope than major mergers.
We note that throughout the paper indicates the dark matter mass ratio between the satellite and the main galaxy. The corresponding stellar mass ratio is in general different from , because depends on . In our model when a halo of mass undergoes a merger with mass ratio the increase in dark matter mass is , and the increase in stellar mass is , where is the ratio of stellar to dark matter mass of the satellite. For given increase in stellar mass, the variation of and depends on , but not on : this is justified because our -body simulations indicate that the effect of varying is small (see Section 2.2).
2.2. -body simulations of binary dissipationless mergers
In order to estimate as a function of the merger mass ratio (see Section 2.1), we collect a set of dissipationless binary-merger -body simulations by combining new simulations and simulations from previous works. In particular we take four simulations with and of Nipoti et al. (2009b, runs named 2D1ph, 2D1po, 4D1ph, 4D1po in table 2 of that paper) and two simulations with and of Nipoti et al. (2012, see section 3.3.2 in that paper). Our reference set of binary-merger simulations (named set D in Table 1 and Figure 1) is supplemented by two new simulations with and (in all runs of this set the main galaxy and satellite have the same ). In these simulations (except runs 4D1ph and 4D1po, which are re-mergers of runs 2D1ph and 2D1po; see Nipoti et al. 2009b) both the progenitor galaxies are represented by the two-component galaxy model D of Nipoti et al. (2009b, see table 1 of that paper). In all the runs of this set the ratio between the effective radius of the satellite and of the main galaxy is and the orbits are parabolic: some encounters are head-on (), others are off-axis ( for and ; see Nipoti et al. (2009b) for the orbital parameters of the runs). Here is the pericentric radius and is the virial radius of the main halo.
| Set | ||||||
|---|---|---|---|---|---|---|
| D | 49 | 8.0 | 11.6 | 49 | 8.0 | 11.6 |
| D1 | 49 | 5.0 | 11.6 | 49 | 5.0 | 11.6 |
| D2 | 49 | 8.0 | 6.0 | 49 | 8.0 | 6.0 |
| D3 | 49 | 8.0 | 11.6 | 35 | 8.5 | 8.8 |
| D4 | 49 | 8.0 | 11.6 | 75 | 8.5 | 15.0 |
Note. — Set: name of the simulation set. : NFW concentration. : NFW scale radius. : effective radius. : total dark-matter mass. : total stellar mass. Subscript is for the main galaxy, subscript for the satellite.
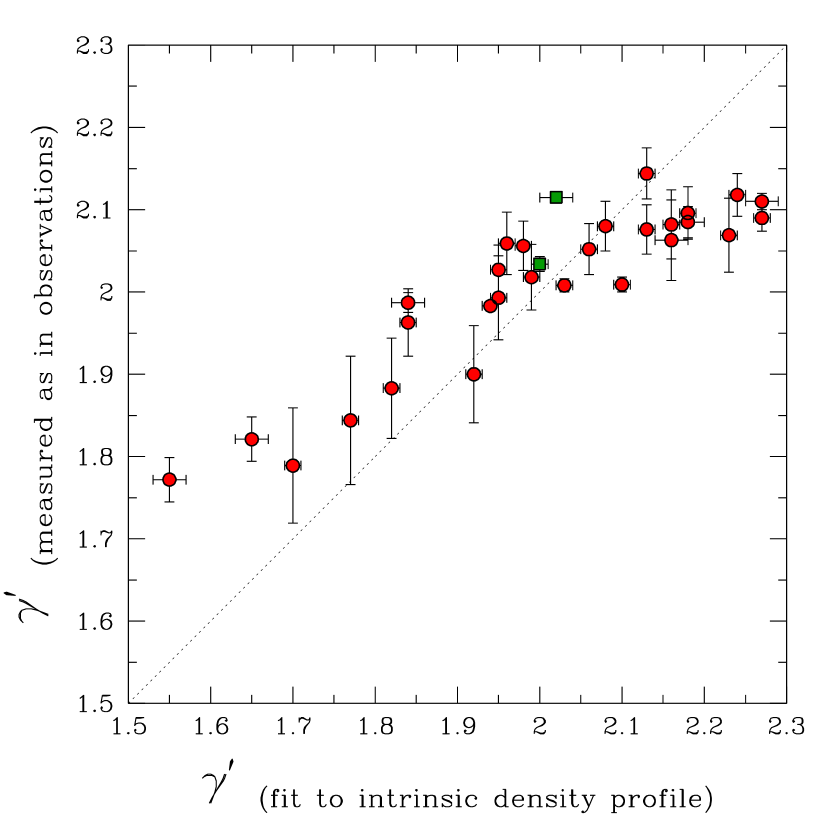
In order to minimize systematic errors, we measure in simulated galaxies with the same method used in observations. In particular, the density slope measured by Sonnenfeld et al. (2013b) is obtained by fitting a power-law to the luminosity-weighted line-of-sight velocity dispersion within a circular aperture of radius and to the total projected mass within a cylinder of radius . For a given lens the value of the Einstein radius depends on the distance of the lensed background source: increases for increasing source redshift . Typical strong lenses such as those of the SLACS (Auger et al. 2009) or SL2S (Sonnenfeld et al. 2013a) surveys have Einstein radii not too different from their effective radii. Sonnenfeld et al. (2013b) showed that measurements of with lensing and stellar dynamics are very stable against variations of the ratio . When measuring in simulated galaxies we will always assume , as varying the ratio has little impact on the measured .
For our reference set of -body simulations (set D) as a function of the merger mass ratio is fitted by Equation 2 with and . The evolution in is obtained by fixing the parameters and in Equation 2 to their best-fit values. We verified that our results are robust against variations of and within the measured uncertainties. Of course, it is important to verify whether the adopted formula for is also robust against variation of the parameters characterizing the galaxy models. For this purpose we ran eight additional simulations with the same orbital and galaxy parameters as the corresponding simulations of set D, but changing the concentration , where is the Navarro Frenk and White (NFW Navarro et al. 1997) scale radius, the stellar-to-halo mass ratio and the ratio of the progenitor galaxies. The values of the parameters of these additional sets of simulations (named D1, D2, D3 and D4) are reported in Table 1 and are chosen to span the range of values expected for real galaxies. We note that in all cases the progenitors have in the range . The results of the runs D1, D2, D3 and D4 are very similar to those of the corresponding runs D (see Figure 1). Thus we conclude that our adopted formula is robust with respect to variations in the properties of the host galaxy and its satellite within realistic ranges.
All the binary-merger -body simulations were run with the parallel -body code FVFPS (Fortran Version of a Fast Poisson Solver; Londrillo et al. 2003; Nipoti et al. 2003). The parameters of the simulations with are given in Nipoti et al. (2009b). In the runs with we adopted the following values of the code parameters: minimum value of the opening parameter and softening parameter , where is the initial effective radius of the main galaxy. The time-step , which is the same for all particles, is allowed to vary adaptively in time as a function of the maximum particle density : in particular, we adopted . The initial conditions of the new simulations are realized as in Nipoti et al. (2009b), but with dark matter particles twice as massive as the stellar particles. The total number of particles used in each simulation is in the range .
In all the simulations used in this work the galaxy collision is followed up to the virialization of the resulting stellar system. We define the merger remnant as the systems composed by the bound stellar and dark matter particles at the end of the simulation. The intrinsic and projected properties of the progenitors and of the merger remnants are determined as in Nipoti et al. (2009b), with the exception of , which, as pointed out above, is computed with the same procedure used for observed lenses by Sonnenfeld et al. (2013b).
2.3. The model sample
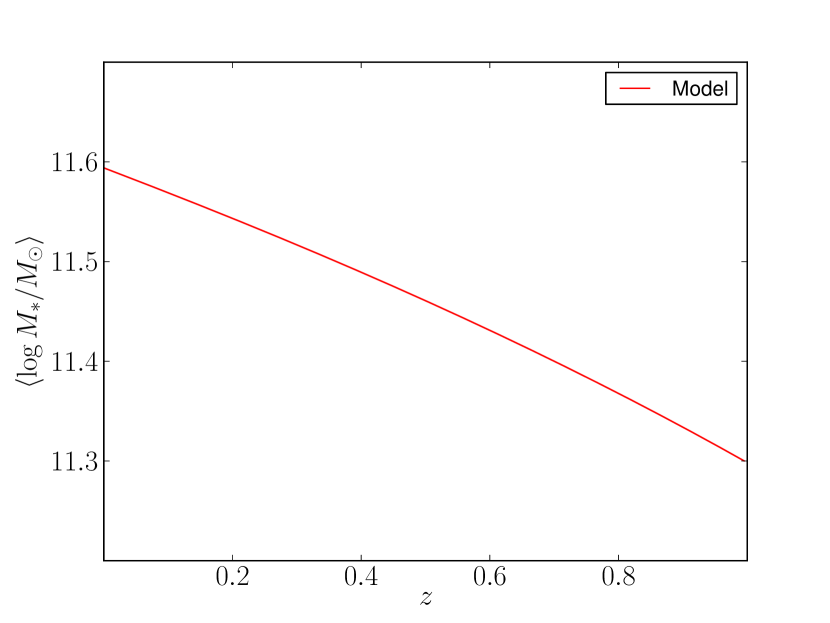
Our goal is to follow the evolution of a sample of model galaxies between and , matching the characteristic of the sample observed by Sonnenfeld et al. (2013b). We thus consider objects with drawn from a Gaussian with mean and dispersion . The starting point of the evolutionary tracks of all galaxies is fixed at , which is the redshift for which observations of are most robust. Effective radii are drawn from the mass-size relation measured by Newman et al. (2012). Halo masses are assigned with the same SHMR used in the galaxy evolution model described in Section 2.1. For fixed , and , the value of is not uniquely determined as this depends on additional parameters, such as the orbital anisotropy and the concentration of the dark matter halo. The initial values of are then drawn from the distribution measured by Sonnenfeld et al. (2013b). Once the initial values are set, , , and are evolved according to our model as described in Section 2.1.
Roughly half of the accreted stellar mass and the corresponding change in is due to mergers with . Since is the smallest mass ratio we consider in our -body simulations, our predictions on the evolution of for the sample of mock galaxies relies in part on an extrapolation of Equation 2. We verified that even in the extreme case in which the function flattens abruptly below the conclusions of our analysis do not change.
2.4. Comparison with observations
The measurements by Sonnenfeld et al. (2013b) constrain the parameter in ETGs as a function of their redshift, stellar mass and half-light radius. The mean change of with one of these parameters and others fixed is measured to be
| (3) |
| (4) |
| (5) |
According to the formalism introduced in Sonnenfeld et al. (2013b), the observed change of with redshift for a galaxy with a mass growth rate and a size growth rate of is
| (6) |
The quantities and are not constrained by the observations, but are directly provided by our model for the dry merger evolution of galaxies.
An implicit assumption of Equation 6 is that the observed trends of with stellar mass and size are determined uniquely by the intrinsic evolution of galaxies, and not by the appearance of new objects with time. This is a reasonable approximation, given that the total number density of quiescent galaxies has little evolution since (Cassata et al. 2013), particularly at the large masses of our sample (Ilbert et al. 2013).
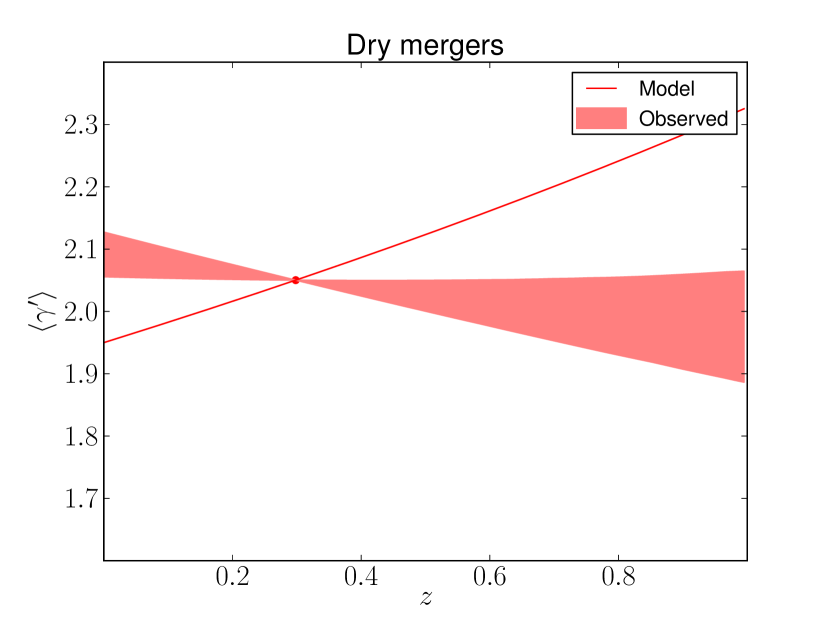
Figure 2 shows the model evolution of the density slope averaged over the sample of galaxies, . The mean change in with redshift for the sample average is , and the scatter over the sample is . The average mass and size growth rates are (galaxies roughly double in stellar mass from to ) and respectively. The figure also shows the observed mean change in calculated following Equation 6. This is . The key result is that predicted and observed evolution in differ significantly.
Equation 6 provides an efficient way to quickly compare model predictions with observations. However, in this context the “observed” evolution of is really a combination of observed quantities (the partial derivatives) and model predictions ( and ). A more direct evaluation of the goodness of the model is obtained by comparing models to the observables, i.e. the partial derivatives. Such a comparison is done in Section 4. Here we simply point out a discrepancy between the predicted evolution of and observed data, the significance of which will be discussed later.
3. Wet mergers
The above analysis is based on the assumption that the growth of galaxies is a result of purely dry mergers. In practice, mergers between galaxies are expected to involve the accretion of gas, which can radiate away energy and sink to the central parts of the main galaxy, eventually leading to star formation episodes. This infall of gas can alter the density profile of the accreting galaxy, making it steeper. Thus introducing dissipation in our model should help reproduce the observed evolution of .
Following the spirit of our approach we introduce dissipation using a simple toy model. In spite of its simplicity this approach allows us to isolate cleanly the effect of dissipation and estimate whether this solution can work at all. Thus it should provide a very good complement to hydrodynamic cosmological simulations which are just starting to achieve the resolution to model the internal structure of ETGs (Feldmann et al. 2010; Oser et al. 2012; Johansson et al. 2012; Remus et al. 2013; Dubois et al. 2013).
We wish to test whether dissipation can work and therefore we consider a plausible yet somewhat extreme model which maximizes the effects on the mass profile. In practice, we assume that a small fraction of the baryonic mass of the merging satellite is cold gas, which, in the merging process, falls exactly to the center of the galaxy and forms stars. We calculate the response of the mass distribution of the galaxy to the infall of cold gas following the adiabatic contraction recipe of Blumenthal et al. (1986), which is stronger than more recent ones based on numerical simulations (e.g. Gnedin et al. 2004).
The galaxies are modeled as spherical de Vaucouleurs stellar bulges and a dark matter halo with an NFW profile. The ratio between halo mass and stellar mass is , and the ratio between the scale radius of the NFW profile and the effective radius of the stellar component is . For given infalling mass we first calculate the new distribution of stellar and dark matter mass following adiabatic contraction. Then we calculate the stellar half-light radius. Finally we calculate consistently with lensing and dynamics measurements.
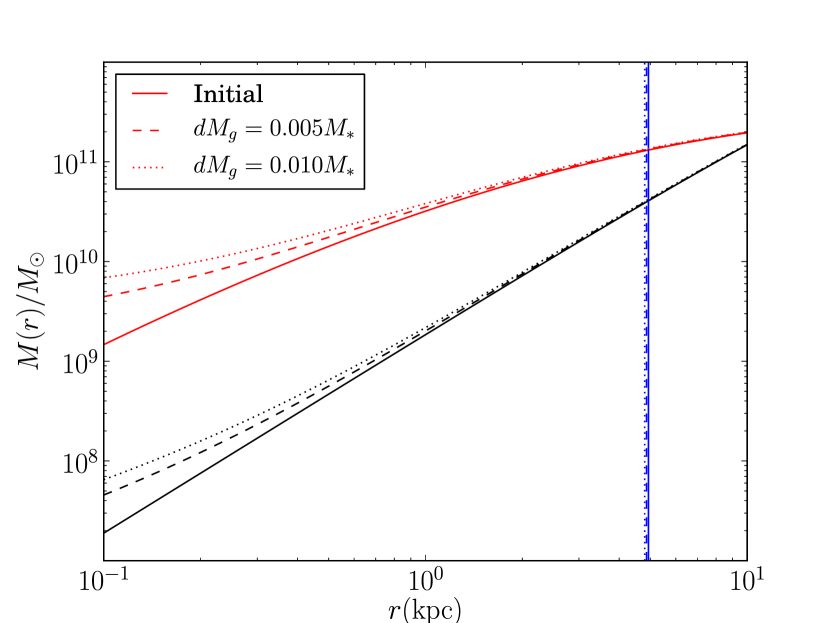
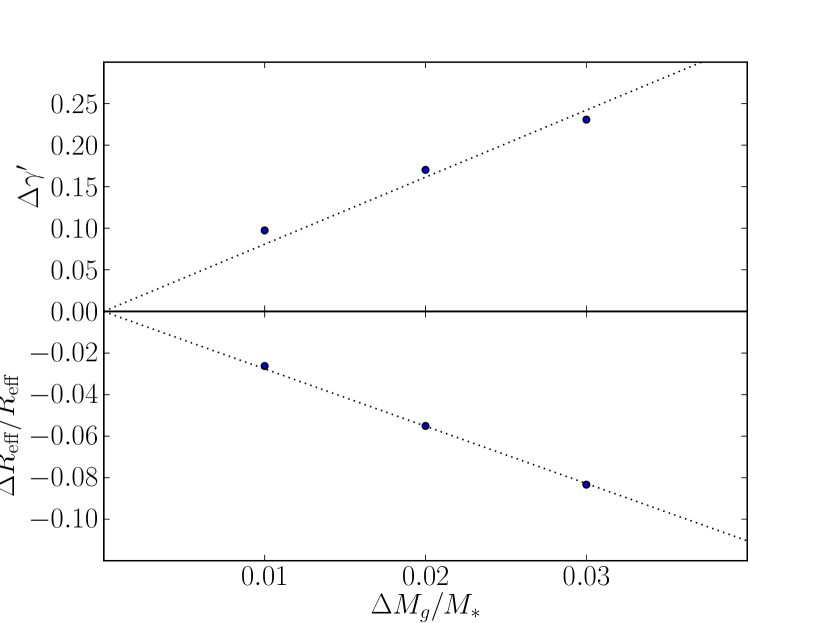
The change in and is caused by both the addition of new material at and by the subsequent contraction of the preexisting mass. The two effects have a comparable impact on . Figure 3 shows the original mass distribution as well as the one following gas infall and adiabatic contraction for a typical system. The relation between the change in due to and the accreted gas mass can be fitted with a linear relation
| (7) |
with (see Figure 4). The exact value of depends on the properties of the main galaxy. However, for the same parameters explored in Section 2.1 and summarized in Table 1 the variation of is smaller than 10%.
This ingredient is then added to the model describing the evolution of in the dry merger case. The accreted gas mass is assumed to be a fraction of the accreted stellar mass, so : for simplicity we assume that is independent of redshift, stellar and halo mass. Then Equation 2 is modified to
| (8) |
The effect of the infall of gas on the effective radius is quantified as
| (9) |
which is a measure of the reduced increase of due to dissipation (see also Ciotti et al. 2007). This term will be added to Equation 1 when calculating the size evolution in the model with wet mergers.
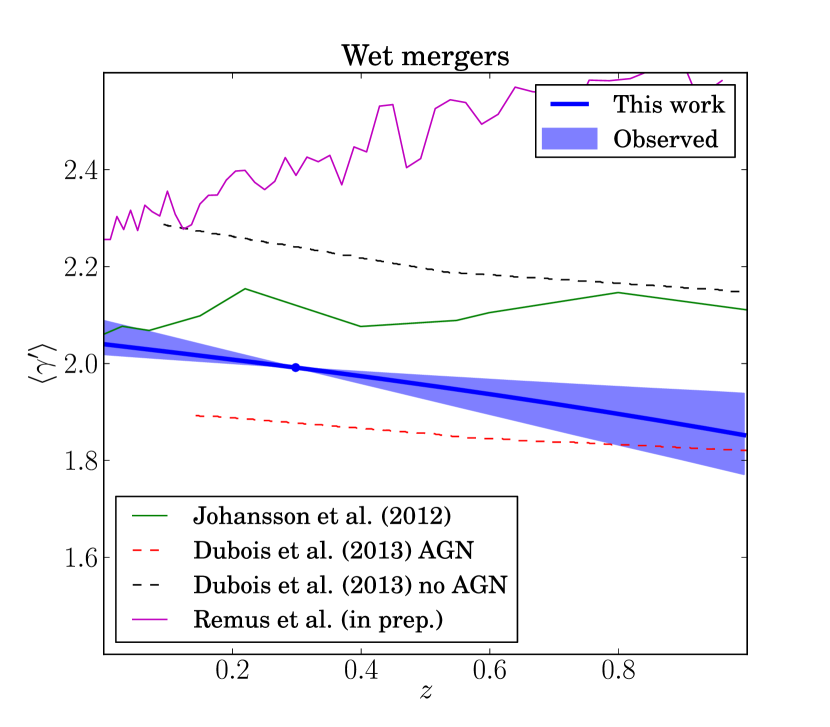
We set and calculate the evolution of the population average of analogously to Section 2.4. Results are plotted in Figure 5, together with the observed evolution calculated with Equation 6. The average change in is now with a scatter of . Note that this new model modifies also the interpretation of the observational results owing to the slightly smaller theoretical size growth entering Equation 6. The key result is that, by introducing a reasonable amount of dissipation, model predictions and observations are now in good agreement.
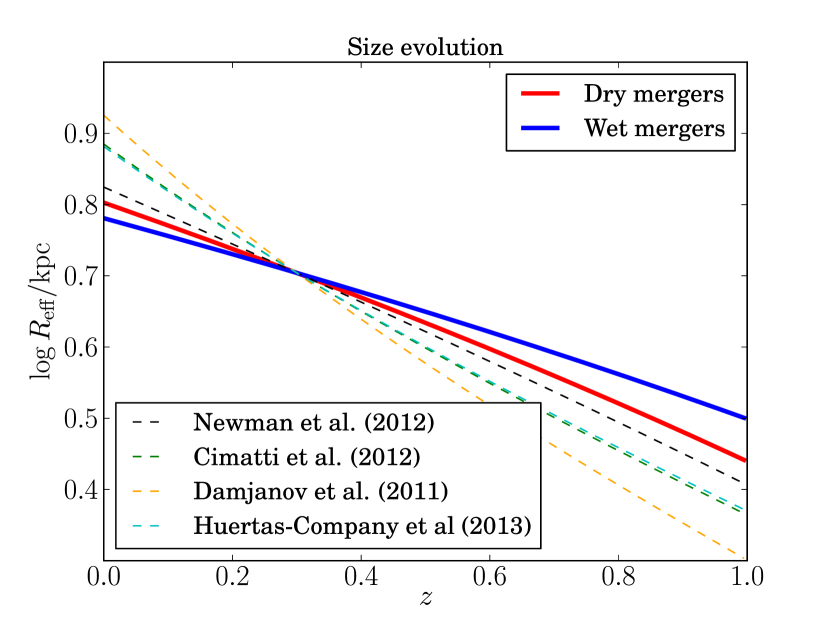
So far we have focused our attention to the evolution of the density slope . There is another important piece of observations that a successful model of galaxy evolution needs to reproduce: the size evolution. We want to verify whether the two models considered so far predict a size growth consistent with observations. This is done in Figure 6, where we plot as a function of for the sample average in both the dry and wet merger model, together with the observed average size evolution of galaxies with the same mass as the model average, for various literature measurements and assuming no progenitor bias. Most measurements imply a stronger size evolution than our model predictions for both the dry and wet merger case, the discrepancy being worse for the wet merger model. Adding dissipational effects then helps matching observations, but increases the tension with size evolution data. Our knowledge of the size distribution of massive ETGs at therefore should rule out models with too much dissipation. In the following section we determine how much disspation is needed, if at all, to best match both sets of observables. This inference will also allow us to perform model selection, i.e to compare how well the purely dry merger scenario compares with the wet merger one.
4. Constraining the amount of dissipation
As shown in Section 3, the infall of cold gas and the subsequent adiabatic contraction help reconcile the predicted evolution of the density profile with observations. At the same time however adiabatic contraction leads to a decrease of the effective radius, such that models with too much dissipation are in tension with size evolution measurements. The importance of these two effects increases with increasing gas fraction, which we parameterize with . We wish to estabilish which values of provide the best match to the data, including both density slope and size measurements. We do this by generating mock populations of ETGs, evolved with different values of , and by comparing scaling relations of and with observations. Our mock population is built by picking, for each one of the mock galaxies described in Section 2.3, a random snapshot on its evolutionary track. This results in a set of galaxies uniformly distributed in redshift in the interval . Sizes and density slopes of these mock galaxies will depend on the amount of dissipation allowed by the model, parameterized by . For fixed , we can infer how the average density slope of the mock population scales with redshift, stellar mass and effective radius by measuring , , with the same method used by Sonnenfeld et al. (2013b). Similarly, we can measure how the average effective radius scales with redshift and stellar mass. We assume the following relation:
| (10) | |||||
We then fit for by comparing the model partial derivatives of and with the values measured by Sonnenfeld et al. (2013b) (Equation 3, Equation 4, Equation 5) and in size evolution studies. The redshift dependence of the average effective radius, , has been measured by different authors. As Figure 6 shows, there is some scatter between the reported values, possibly indicative of an underlying systematic uncertainty in the determination of the size evolution, of differences in the selection function. In order to take this uncertainty into account, we assume as the observed value of the mean between the values measured by Newman et al. (2012), Damjanov et al. (2011), Cimatti et al. (2012), Huertas-Company et al. (2013), and we take their standard deviation as the uncertainty:
| (11) |
The mass dependence of is measured by Newman et al. (2012) to be . The fit is done in a Bayesian framework. The posterior probability distribution for the gas fraction, as well as the redshift evolution of and , is shown in Figure 7.
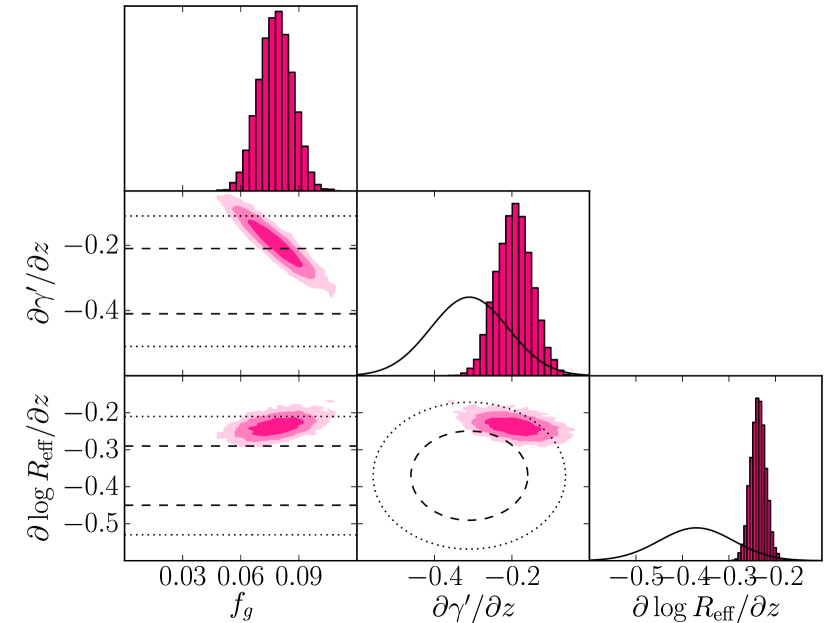
The data prefer non-zero values of the gas fraction, with a median and interval of . Purely dry merger models () are disfavored at more than 99% CL (formally at 8-). The redshift dependence of is well matched by the model, and the -dependence of is consistent with observations at the level. Although not plotted in Figure 7, we verified that the dependences of on and , as well as the dependence of on , are well consistent with observations. This is expected, since the same observed scaling relations were used to initialize the mock sample at .
5. Discussion
In Section 2.4 we evaluated the mean evolution in the slope of the density profile of a mock sample of massive ETGs, under the assumption of growth by purely dry mergers. We found that purely dry mergers produce a strong decrease in , on average, inconsistent with observations. This result is robust against different choices for the SHMR and against variations in the values of the model parameters. We then extended our model allowing for a modest amount of star formation in the mergers, and quantified the resulting effect on .
When considering simultaneously the evolution in density slope and size, we find that models with dissipation are strongly favored over purely dry merger models. The most probable model has , which according to our assumptions means that of the accreted baryonic mass consists of gas that falls to the center of the galaxy and forms stars. The mock galaxies in our sample double their stellar mass between and , on average. This would imply that of the final stellar mass of our galaxies being the result of in-situ star formation at , or a specific star formation rate (sSFR) of . These numbers are consistent with the largest amount of recent star formation allowed by observations of ETGs, including spectral properties (Trager et al. 2000; Treu et al. 2002; Damen et al. 2009; Thomas et al. 2010), the evolution of the Fundamental Plane (Treu et al. 2005), UV (Kaviraj et al. 2011) and mid-IR fluxes (Fumagalli et al. 2013) and spectral energy distribution fitting (van Dokkum et al. 2010; Tonini et al. 2012). Thus we conclude that our model is as wet as it can be without violating known observational constraints. The other extreme assumption of our model is that this cold gas falls all the way to the center before forming stars. Although this is clearly a toy-picture, it is at least qualitatively consistent with the “blue cores” seen in the center of massive ETGs at these redshifts (Menanteau et al. 2001; Treu et al. 2005; Pipino et al. 2009). Observations of color gradients and their evolution (e.g. Szomoru et al. 2013) provide additional tests for the plausibility of the proposed scenario. Preliminary calculations show the predicted change in colors due to wet mergers to be relatively small, and consistent with observations. However a more detailed comparison requires a careful assessment of the observational selection function as well as additional assumptions on the star formation history and stellar populations. This is beyond the scope of this paper and left for future work.
Purely dry mergers maximize the size growth of ETGs for a given increase in mass, and thus introducing some dissipation makes it harder to explain this observation. Even though the tension with the size-growth data is much less than that between purely dry mergers and the evolution of the mass density profiles, it illustrates the challenges of achieving a fully self consistent and quantitative description of the evolution of massive early-type galaxies. The discrepancy might be the result of progenitor bias (e.g. van der Wel et al. 2009; Cassata et al. 2013), which we have not accounted for. López-Sanjuan et al. (2012) estimate that progenitor bias contributes to the observed size evolution at . This however raises the question of whether the observed evolution in the density slope might also be strongly influenced by progenitor bias effects. Can the observation of between and still be consistent with the dry merger model if we allow for the continuous emergence of new systems pushing the population average towards the measured value? This is very unlikely. Our model shows that dry mergers decrease the average density slope of a population of galaxies by between and . On the other hand, the scatter in over the population of massive ETGs is as small as (Sonnenfeld et al. 2013b). In order to reproduce both the observed and scatter at , the descendants of ETGs must be strongly outnumbered by newly born systems, at odds with observations (Ilbert et al. 2013; Cassata et al. 2013).
The toy model developed in Section 3 is far from perfect, given the many simplifying assumptions it is based on. The effect of wet mergers on the density profile of ETGs is probably less pronounced in reality than in the idealized case considered here, and must be studied with dedicated numerical simulations in order to make quantitative statements. Nevertheless, our work shows with great clarity that i) dry mergers cannot be the only mechanism driving the evolution of massive ETGs; ii) a small amount of dissipation, consistent with observations, can bring the predicted evolution of in agreement with lensing measurements, as previously proposed by Ruff et al. (2011). This finding is consistent with results from cosmological simulations that include dissipative effects, which predict trends in in qualitative agreement with the data (Johansson et al. 2012; Remus et al. 2013; Dubois et al. 2013, see Figure 5).
As an alternative to the wet merger scenario, Bolton et al. (2012), based on the results of simulations by Nipoti et al. (2009b), suggested off axis major dry mergers as a way to increase the density slope. However, among the off-axis simulations of Nipoti et al. (2009b), only those with produce remnants with higher than in the progenitor, while decreases sharply in those with the more cosmologically motivated stellar-to-dark mass ratio . Moreover, we stress that a crucial point in connecting models with observations is defining in a consistent way. Theoretical works (e.g. Nipoti et al. 2009b; Johansson et al. 2012; Dubois et al. 2013) often define by fitting with a power law over a range of radii. The two methods give different values of the slope (see Figure 8) and we verified that, by measuring as described in Section 2.1, the higher values of predicted by the simulations of Nipoti et al. (2009b) get revised downward by an appreciable amount. The net effect, and one of the core result of our work, is that dry mergers decrease the density slope , as defined in lensing and dynamics measurements.
Finally, while our results suggest that dissipation plays a role in the evolution of ETGs, the origin of the cold gas involved in the process can still be subject of debate. Gas can for example be produced as a result of stellar mass loss. If internal sources of gas are the dominant ones, then wet mergers might not be necessary to keep the density profile from getting shallower, provided that the gas can effectively cool down and reach the central parts of the galaxy. Mergers might still play a role by inducing starbursts in the pre-existing gas.
6. Conclusions
We studied the effect of dry mergers on the slope of the density profile of massive ETGs. Both minor and major mergers produce a decrease in the density slope , the effect being stronger for minor mergers, at fixed accreted mass. However, purely dry mergers produce a strong decrease in with time, inconsistent with lensing observations at more than significance. We thus developed a toy model to account for the infall of cold gas and star formation following wet mergers. We found that it is sufficient to accrete 4% of total mass in the form of cold gas to match the observed evolution in since , while still be consistent with the observed size evolution. We suggest a scenario where the outer regions of massive ETGs grow by accretion of stars and dark matter, while small amounts of dissipation and nuclear star formation conspire to keep the mass density profile constant and approximately isothermal.
References
- Auger et al. (2009) Auger, M. W., Treu, T., Bolton, A. S., Gavazzi, R., Koopmans, L. V. E., Marshall, P. J., Bundy, K., & Moustakas, L. A. 2009, ApJ, in press
- Belli et al. (2013) Belli, S., Newman, A. B., & Ellis, R. S. 2013, ArXiv e-prints
- Blumenthal et al. (1986) Blumenthal, G. R., Faber, S. M., Flores, R., & Primack, J. R. 1986, ApJ, 301, 27
- Bolton et al. (2012) Bolton, A. S., Brownstein, J. R., Kochanek, C. S., Shu, Y., Schlegel, D. J., Eisenstein, D. J., Wake, D. A., Connolly, N., Maraston, C., & Weaver, B. A. 2012, ArXiv e-prints
- Carollo et al. (2013) Carollo, C. M., Bschorr, T. J., Renzini, A., Lilly, S. J., Capak, P., Cibinel, A., Ilbert, O., Onodera, M., Scoville, N., Cameron, E., Mobasher, B., Sanders, D., & Taniguchi, Y. 2013, ArXiv e-prints
- Cassata et al. (2011) Cassata, P., Giavalisco, M., Guo, Y., Renzini, A., Ferguson, H., Koekemoer, A. M., Salimbeni, S., Scarlata, C., Grogin, N. A., Conselice, C. J., Dahlen, T., Lotz, J. M., Dickinson, M., & Lin, L. 2011, ApJ, 743, 96
- Cassata et al. (2013) Cassata, P., Giavalisco, M., Williams, C. C., Guo, Y., Lee, B., Renzini, A., Ferguson, H., Faber, S. F., Barro, G., McIntosh, D. H., Lu, Y., Bell, E. F., Koo, D. C., Papovich, C. J., Ryan, R. E., Conselice, C. J., Grogin, N., Koekemoer, A., & Hathi, N. P. 2013, ApJ, 775, 106
- Cimatti et al. (2012) Cimatti, A., Nipoti, C., & Cassata, P. 2012, MNRAS, 422, L62
- Ciotti et al. (2007) Ciotti, L., Lanzoni, B., & Volonteri, M. 2007, ApJ, 658, 65
- Daddi et al. (2005) Daddi, E., Renzini, A., Pirzkal, N., Cimatti, A., Malhotra, S., Stiavelli, M., Xu, C., Pasquali, A., Rhoads, J. E., Brusa, M., di Serego Alighieri, S., Ferguson, H. C., Koekemoer, A. M., Moustakas, L. A., Panagia, N., & Windhorst, R. A. 2005, ApJ, 626, 680
- Damen et al. (2009) Damen, M., Labbé, I., Franx, M., van Dokkum, P. G., Taylor, E. N., & Gawiser, E. J. 2009, ApJ, 690, 937
- Damjanov et al. (2011) Damjanov, I., Abraham, R. G., Glazebrook, K., McCarthy, P. J., Caris, E., Carlberg, R. G., Chen, H.-W., Crampton, D., Green, A. W., Jørgensen, I., Juneau, S., Le Borgne, D., Marzke, R. O., Mentuch, E., Murowinski, R., Roth, K., Savaglio, S., & Yan, H. 2011, ApJ, 739, L44
- Dubois et al. (2013) Dubois, Y., Gavazzi, R., Peirani, S., & Silk, J. 2013, MNRAS, 433, 3297
- Fakhouri et al. (2010) Fakhouri, O., Ma, C.-P., & Boylan-Kolchin, M. 2010, MNRAS, 406, 2267
- Feldmann et al. (2010) Feldmann, R., Carollo, C. M., Mayer, L., Renzini, A., Lake, G., Quinn, T., Stinson, G. S., & Yepes, G. 2010, ApJ, 709, 218
- Fumagalli et al. (2013) Fumagalli, M., Labbe, I., Patel, S. G., Franx, M., van Dokkum, P., Brammer, G., da Cunha, E., Forster Schreiber, N. M., Kriek, M., Quadri, R., Rix, H.-W., Wake, D., Whitaker, K. E., Lundgren, B., Marchesini, D., Maseda, M., Momcheva, I., Nelson, E., Pacifici, C., & Skelton, R. E. 2013, ArXiv e-prints
- Gnedin et al. (2004) Gnedin, O. Y., Kravtsov, A. V., Klypin, A. A., & Nagai, D. 2004, ApJ, 616, 16
- Hilz et al. (2013) Hilz, M., Naab, T., & Ostriker, J. P. 2013, MNRAS, 429, 2924
- Hopkins et al. (2010) Hopkins, P. F., Bundy, K., Hernquist, L., Wuyts, S., & Cox, T. J. 2010, MNRAS, 401, 1099
- Huertas-Company et al. (2013) Huertas-Company, M., Mei, S., Shankar, F., Delaye, L., Raichoor, A., Covone, G., Finoguenov, A., Kneib, J. P., Le, F. O., & Povic, M. 2013, MNRAS, 428, 1715
- Ilbert et al. (2013) Ilbert, O., McCracken, H. J., Le Fevre, O., Capak, P., Dunlop, J., Karim, A., Renzini, M. A., Caputi, K., Boissier, S., Arnouts, S., Aussel, H., Comparat, J., Guo, Q., Hudelot, P., Kartaltepe, J., Kneib, J. P., Krogager, J. K., Le Floc’h, E., Lilly, S., Mellier, Y., Milvang-Jensen, B., Moutard, T., Onodera, M., Richard, J., Salvato, M., Sanders, D. B., Scoville, N., Silverman, J., Taniguchi, Y., Tasca, L., Thomas, R., Toft, S., Tresse, L., Vergani, D., Wolk, M., & Zirm, A. 2013, ArXiv e-prints
- Johansson et al. (2012) Johansson, P. H., Naab, T., & Ostriker, J. P. 2012, ApJ, 754, 115
- Kaviraj et al. (2011) Kaviraj, S., Tan, K.-M., Ellis, R. S., & Silk, J. 2011, MNRAS, 411, 2148
- Leauthaud et al. (2012) Leauthaud, A., Tinker, J., Bundy, K., Behroozi, P. S., Massey, R., Rhodes, J., George, M. R., Kneib, J.-P., Benson, A., Wechsler, R. H., Busha, M. T., Capak, P., Cortês, M., Ilbert, O., Koekemoer, A. M., Le Fèvre, O., Lilly, S., McCracken, H. J., Salvato, M., Schrabback, T., Scoville, N., Smith, T., & Taylor, J. E. 2012, ApJ, 744, 159
- Londrillo et al. (2003) Londrillo, P., Nipoti, C., & Ciotti, L. 2003, Memorie della Societa Astronomica Italiana Supplementi, 1, 18
- López-Sanjuan et al. (2012) López-Sanjuan, C., Le Fèvre, O., Ilbert, O., Tasca, L. A. M., Bridge, C., Cucciati, O., Kampczyk, P., Pozzetti, L., Xu, C. K., Carollo, C. M., Contini, T., Kneib, J.-P., Lilly, S. J., Mainieri, V., Renzini, A., Sanders, D., Scodeggio, M., Scoville, N. Z., Taniguchi, Y., Zamorani, G., Aussel, H., Bardelli, S., Bolzonella, M., Bongiorno, A., Capak, P., Caputi, K., de la Torre, S., de Ravel, L., Franzetti, P., Garilli, B., Iovino, A., Knobel, C., Kovač, K., Lamareille, F., Le Borgne, J.-F., Le Brun, V., Le Floc’h, E., Maier, C., McCracken, H. J., Mignoli, M., Pelló, R., Peng, Y., Pérez-Montero, E., Presotto, V., Ricciardelli, E., Salvato, M., Silverman, J. D., Tanaka, M., Tresse, L., Vergani, D., Zucca, E., Barnes, L., Bordoloi, R., Cappi, A., Cimatti, A., Coppa, G., Koekemoer, A., Liu, C. T., Moresco, M., Nair, P., Oesch, P., Schawinski, K., & Welikala, N. 2012, A&A, 548, A7
- Menanteau et al. (2001) Menanteau, F., Abraham, R. G., & Ellis, R. S. 2001, MNRAS, 322, 1
- Naab et al. (2009) Naab, T., Johansson, P. H., & Ostriker, J. P. 2009, ApJ, 699, L178
- Navarro et al. (1997) Navarro, J. F., Frenk, C. S., & White, S. D. M. 1997, ApJ, 490, 493
- Newman et al. (2012) Newman, A. B., Ellis, R. S., Bundy, K., & Treu, T. 2012, ApJ, 746, 162
- Nipoti et al. (2003) Nipoti, C., Londrillo, P., & Ciotti, L. 2003, MNRAS, 342, 501
- Nipoti et al. (2009a) Nipoti, C., Treu, T., Auger, M. W., & Bolton, A. S. 2009a, ApJ, 706, L86
- Nipoti et al. (2009b) Nipoti, C., Treu, T., & Bolton, A. S. 2009b, ApJ, 703, 1531
- Nipoti et al. (2012) Nipoti, C., Treu, T., Leauthaud, A., Bundy, K., Newman, A. B., & Auger, M. W. 2012, MNRAS, 422, 1714
- Oser et al. (2012) Oser, L., Naab, T., Ostriker, J. P., & Johansson, P. H. 2012, ApJ, 744, 63
- Pipino et al. (2009) Pipino, A., Kaviraj, S., Bildfell, C., Babul, A., Hoekstra, H., & Silk, J. 2009, MNRAS, 395, 462
- Posti et al. (2013) Posti, L., Nipoti, C., Stiavelli, M., & Ciotti, L. 2013, ArXiv e-prints
- Remus et al. (2013) Remus, R.-S., Burkert, A., Dolag, K., Johansson, P. H., Naab, T., Oser, L., & Thomas, J. 2013, ApJ, 766, 71
- Ruff et al. (2011) Ruff, A. J., Gavazzi, R., Marshall, P. J., Treu, T., Auger, M. W., & Brault, F. 2011, ApJ, 727, 96
- Shankar et al. (2013) Shankar, F., Marulli, F., Bernardi, M., Mei, S., Meert, A., & Vikram, V. 2013, MNRAS, 428, 109
- Sonnenfeld et al. (2013a) Sonnenfeld, A., Treu, T., Gavazzi, R., Suyu, S. H., & Marshall, P. J. 2013a, apJ in press, available at http://web.physics.ucsb.edu/~sonnen/SL2S-III.pdf
- Sonnenfeld et al. (2013b) Sonnenfeld, A., Treu, T., Gavazzi, R., Suyu, S. H., Marshall, P. J., Auger, M. W., & Nipoti, C. 2013b, apJ in press, available at http://web.physics.ucsb.edu/$∼$sonnen/SL2S-IV.pdf
- Szomoru et al. (2013) Szomoru, D., Franx, M., van Dokkum, P. G., Trenti, M., Illingworth, G. D., Labbé, I., & Oesch, P. 2013, ApJ, 763, 73
- Thomas et al. (2010) Thomas, D., Maraston, C., Schawinski, K., Sarzi, M., & Silk, J. 2010, MNRAS, 404, 1775
- Tonini et al. (2012) Tonini, C., Bernyk, M., Croton, D., Maraston, C., & Thomas, D. 2012, ApJ, 759, 43
- Trager et al. (2000) Trager, S. C., Faber, S. M., Worthey, G., & González, J. J. 2000, AJ, 120, 165
- Treu et al. (2002) Treu, T., Stiavelli, M., Casertano, S., Møller, P., & Bertin, G. 2002, ApJ, 564, L13
- Treu et al. (2005) Treu, T., et al. 2005, ApJ, 633, 174
- Trujillo et al. (2006) Trujillo, I., Förster Schreiber, N. M., Rudnick, G., Barden, M., Franx, M., Rix, H.-W., Caldwell, J. A. R., McIntosh, D. H., Toft, S., Häussler, B., Zirm, A., van Dokkum, P. G., Labbé, I., Moorwood, A., Röttgering, H., van der Wel, A., van der Werf, P., & van Starkenburg, L. 2006, ApJ, 650, 18
- van der Wel et al. (2009) van der Wel, A., Bell, E. F., van den Bosch, F. C., Gallazzi, A., & Rix, H.-W. 2009, ApJ, 698, 1232
- van Dokkum et al. (2008) van Dokkum, P. G., Franx, M., Kriek, M., Holden, B., Illingworth, G. D., Magee, D., Bouwens, R., Marchesini, D., Quadri, R., Rudnick, G., Taylor, E. N., & Toft, S. 2008, ApJ, 677, L5
- van Dokkum et al. (2010) van Dokkum, P. G., Whitaker, K. E., Brammer, G., Franx, M., Kriek, M., Labbé, I., Marchesini, D., Quadri, R., Bezanson, R., Illingworth, G. D., Muzzin, A., Rudnick, G., Tal, T., & Wake, D. 2010, ApJ, 709, 1018