The Effects of Front-Surface Target Structures on Properties of Relativistic Laser-Plasma Electrons
Abstract
We report the results of a study of the role of prescribed geometrical structures on the front of a target in determining the energy and spatial distribution of relativistic laser-plasma electrons. Our 3D PIC simulation studies apply to short-pulse, high intensity laser pulses, and indicate that a judicious choice of target front-surface geometry provides the realistic possibility of greatly enhancing the yield of high energy electrons, while simultaneously confining the emission to narrow () angular cones.
pacs:
52.65.Rr,52.38.Kd,52.38.-rI Generation of Hot Electrons
I.1 Background
The interaction between high intensity, short pulse lasers and solid targets has been a subject of significant research over the last 15 years. The reason for this interest is the experimental observation (and successful computer simulation) of the emission of “hot electrons”, that is, electrons that have energies far in excess of that corresponding to emission from a thermal source. This hot electron production has become an important research topic not only because it represents a useful source of high energy electrons itself, but because it is the mechanism for many important subsequent processes, including X ray Murnane et al. (1989), ray Kmetec et al. (1992); Schnürer et al. (1995), and positron production Shearer et al. (1973); Chen et al. (2009), and seeding even further processes such as ion acceleration Clark et al. (2000). Consequently there have been numerous efforts to increase the number and energy of the hot electrons as well as to increase the efficiency of the conversion of laser energy into hot electron energy. Most of these studies have emphasized the role of the laser pulse energy, duration, and intensity Wilks et al. (1992); Beg et al. (1997); Haines et al. (2009); Kluge et al. (2011); in addition, there is a robust literature describing the effect on electron energy of a “pre-plasma” on the front of the target Paradkar et al. (2011); Scott et al. (2012); Ovchinnikov et al. (2013).
I.2 Target Design
This paper discusses another means of enhancing the energy and directionality of the laser generated hot electrons, quite apart from using higher energy, more intense lasers. We propose, and verify through 3D PIC simulation, target designs that include specific modifications of the front surface geometry that not only substantially increase the number of relativistic electrons from a target, but can greatly decrease the solid angle of emission, all while maintaining or improving the conversion efficiency of overall laser to electron energy.
There is a substantial body of experimental work on the effect of surface roughness of targets on laser-plasma coupling, including the laser absorption and the production efficiency and energy spectrum of the generated x-rays or ions Palchan et al. (2007); Rajeev et al. (2003); Sumeruk et al. (2007); Kulcsar et al. (2000); Murnane et al. (1993); Kahaly et al. (2008); Hu et al. (2010); Margarone et al. (2012). Various simulation works attribute the observed improvement to a surface area increase and the local field enhancement introduced by the roughness Kupersztych et al. (2004); Klimo et al. (2011); Andreev et al. (2011); Kemp et al. (2013). Recently, several authors have shown that larger scale structures can give rise to enhanced production of hot electrons and/or high energy ions Kluge et al. (2012); Gaillard et al. (2011); Zigler et al. (2013). Kluge and Gaillard shot microcone targets on the cone walls and observed a significant increase in electron and proton energies which they attributed to direct laser acceleration of electrons along the cone walls Kluge et al. (2012); Gaillard et al. (2011). Zheng et al. proposed and simulated a “slice cone” target Zheng et al. (2011) attributing the accelerated electrons to a similar mechanism. 2D simulations on similar shaped nanobrush targets have also been published Cao et al. (2010a, b); Zhao et al. (2010); Cao et al. (2011); Wang et al. (2012); Yu et al. (2012a, b).
Our target design employs a similar acceleration mechanism to that of the previous work on microcones, but changes the structures to periodic regular arrays. This change has the virtue of a target for which the analysis and PIC simulations are easier to understand. Additionally, this target configuration has the added feature of being easier to align, in principle being no more difficult than a standard flat foil. In the simulations described here we find that hot electrons start off being extracted from the structures in a manner not dissimilar to that reported by some previous 2D simulations Kluge et al. (2012); Gaillard et al. (2011); Baton et al. (2008); Psikal et al. (2010); Micheau et al. (2010). However, as we discuss in Sec. III, fully 3D simulations are required to reveal accurately the trajectories of hot electrons.
I.3 General Characteristics
We use 3D PIC simulations to study the laser absorption and electron spectrum changes due to front surface target structure. Fig. 1 is a schematic showing a general overview of the results from a 3D PIC simulation of a specific geometric shape placed on the front of a target compared to a regular flat target with pre-plasma. We have chosen these shapes not only to facilitate the discussion of the electron acceleration, but to highlight the limitations of 2D PIC simulations as well. The colored cones on the backside of the target represent the angular distributions of electrons with different energies. Blue, green, yellow and red cones indicate electron energies from low to high. For a regular flat target with pre-plasma (shown at the bottom), electrons usually have divergence angles between Stephens et al. (2004); Akli et al. (2012).
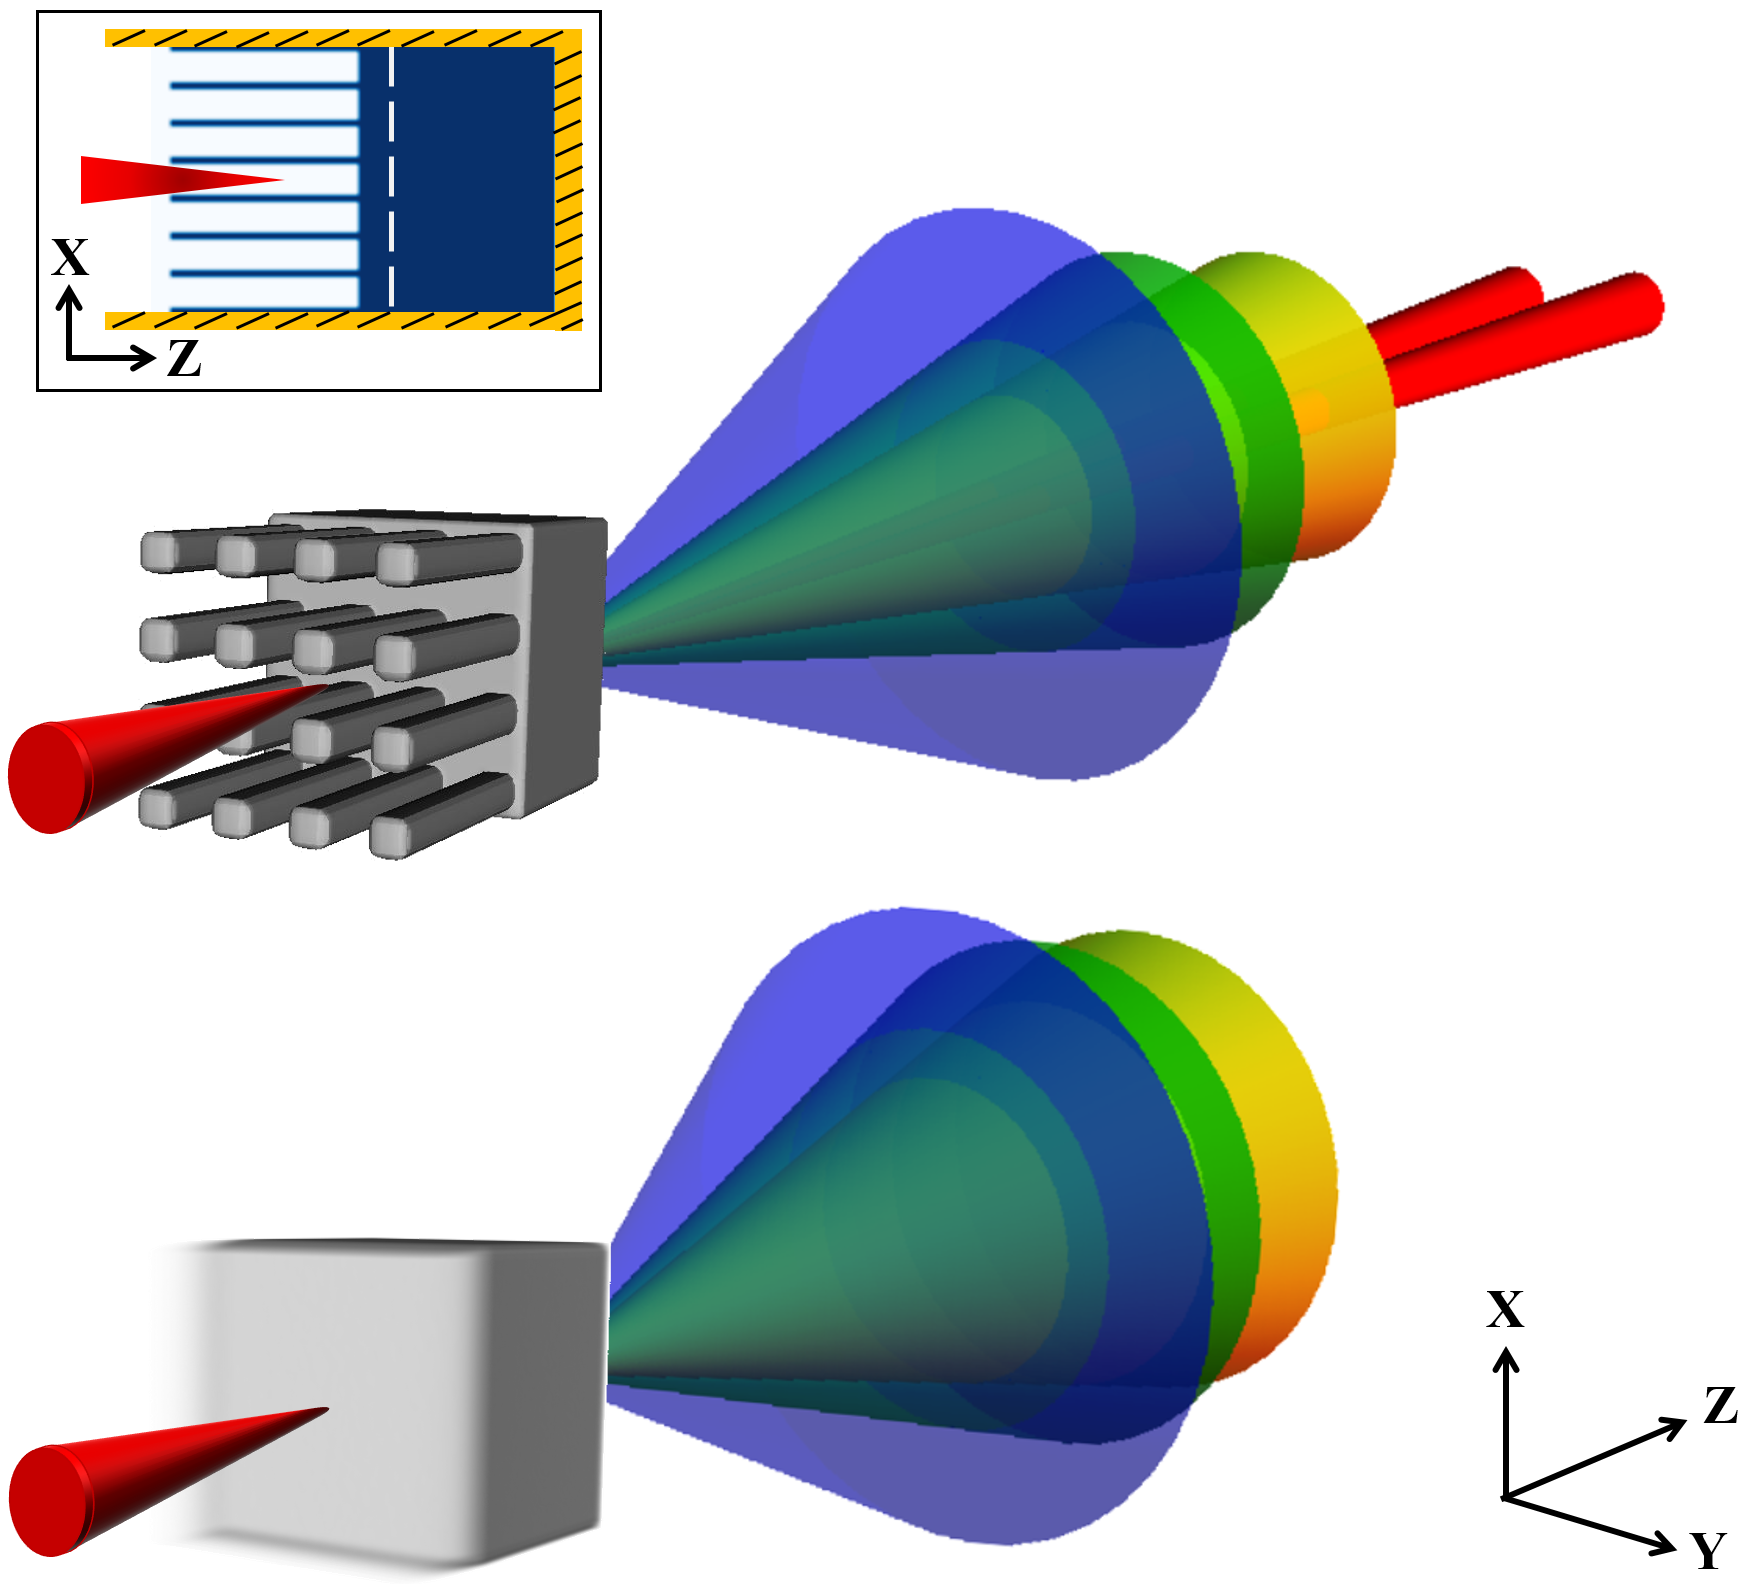
For a target with tower structures on the front (shown at the top), there are considerably more higher energy electrons generated. The highest energy hot electrons form into two narrow cones lining in the y direction (red), whereas the laser is polarized along x. The inset on the top left shows a typical 2D simulation setup, where only x and z dimensions can be modeled.
II Simulation Setup
Our simulations use the 3D PIC code LSP Welch et al. (2006). Three types of targets are studied, and are indicated by Fig. 2(a), (b) and (c).
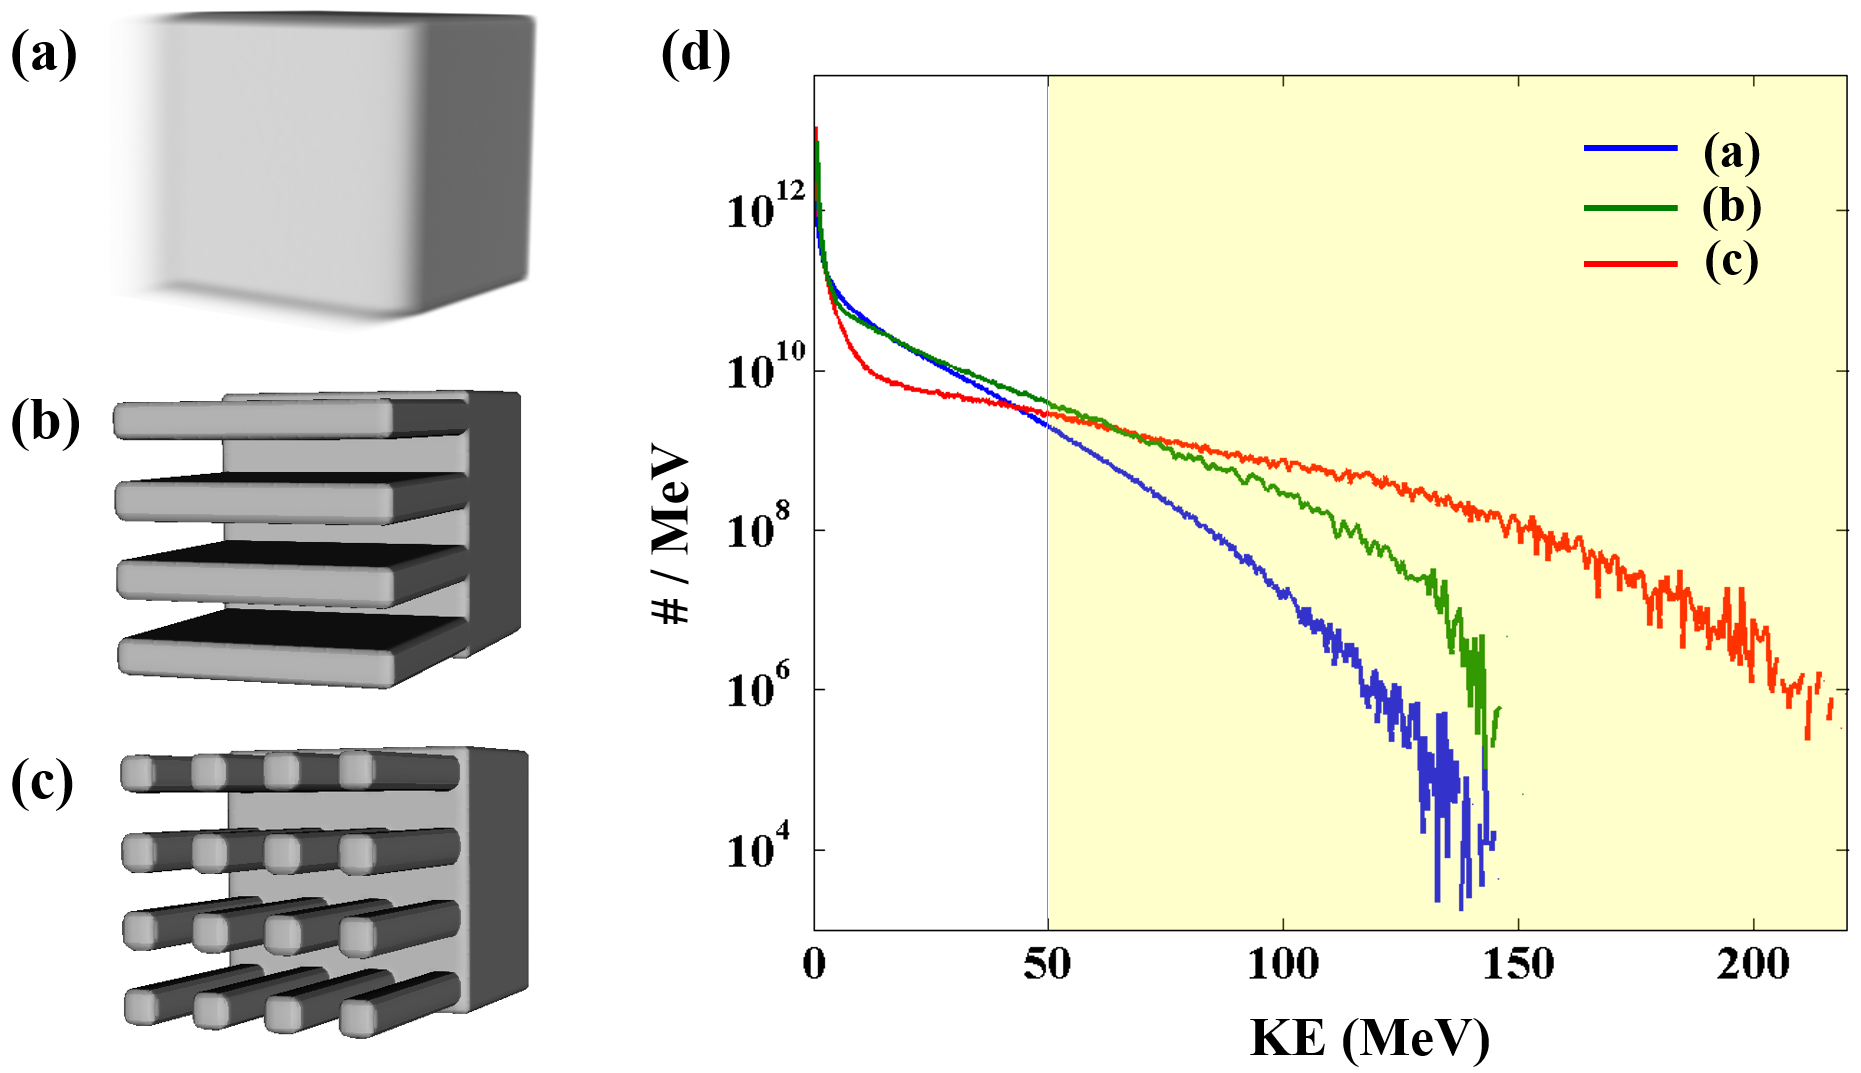
Fig. 2(a) shows a normally flat target with an exponentially decaying pre-plasma on the front. The scale length of the pre-plasma is . The target in Fig. 2(b) is chosen to be an example of a target that apparently lends itself to a 2D simulation; we refer to this as a slab target. The slabs are deep in the laser z direction, and wide in the perpendicular laser polarization direction. The spacing between the slabs is . The third type is shown in(c), what we have labeled as a tower target. The towers are also deep and wide. Here again the transverse spacings are . Both structures in (b) and (c) have sharp interfaces. The base of each target is on a side. The material is Al, initialized as singly ionized, but subsequently treated by ADK ionization model; collisions are not included. (2D simulations using Spitzer cross-sections with collision frequency capped to a maximum value of do not show significant changes in hot electron distributions either spectrally or angularly.) The simulation box is made of cells with mesh sizes , . (We checked the appropriateness of these parameters using short simulations with cells and . We found little difference in either the energies or the trajectories of the hot electrons compared to the coarser grid.) The boundary conditions are absorbing, and the time step is 0.03fs. In the simulation, a Gaussian laser pulse is used with a wavelength of , energy, FWHM pulse duration and a focal spot diameter of , yielding peak intensity. Electron energy and spatial distributions are measured at a plane inside the target. In all of our simulations reported here, we do not take into account changes to the electron spectrum due to target charging when the hot electrons leave the target, but we note that charging will have a minimal effect on the simulation for the higher energy ( MeV) hot electrons that are of interest here Link et al. (2011). Finally, we employed a direct-implicit advance with an energy conserving particle push which greatly reduces numerical heating.
III 2D vs. 3D Simulations
While we have found it important to use full 3D PIC simulations in our study, the use of 3D simulations is not common in the literature of hot electron production. Largely because of the often prohibitively large computational demands of 3D PIC simulations, 2D PIC simulations of hot electron production have been the de facto standard. However, in our studies we observe multiple features of the hot electrons’ behavior in 3D that simply cannot be addressed in 2D. For example, note that our slab (Fig. 2(b)) and tower structures (Fig. 2(c)) cannot be differentiated using a 2D simulation; while in fact, we find that using 3D simulations the electron acceleration dynamics are significantly different for the two geometries. These differences show up most clearly and significantly in the predicted angular spectrum. It is only with a fully 3D simulation that we discover the remarkably narrow angular divergence pattern discussed in IV.2.
The use of 2D results as a proxy to predict 3D electron energy spectra and angular distributions requires significant and in many cases suspect assumptions. Fundamentally, the conversion is only possible when the desired quantity depends only on aspects of the target-laser interaction such as material, degree of pre-pulse etc. that have no transverse asymmetry. For a linearly polarized laser pulse striking a plane, unstructured target, the low energy part of the 2D simulated energy spectrum of hot electrons can be generalized to 3D by appropriately symmetrizing the 2D spectrum through 360 degrees. This method can be useful for calculating quantities that are dominated by low energy electrons, such as radiation, but not simulating the high energy electrons in the kind of structured targets we discuss here.
In this study our main interest is in the highest energy electrons. As we show later, these are produced by direct laser acceleration. The inset in the upper left of Fig. 1 shows a setup for both towers and slabs if 2D simulations were to performed. Clearly this configuration fails the test for meaningful 2D simulation, for the target geometry is not cylindrically symmetric within the laser spot dimensions and the laser-plasma dynamics clearly do not depend only on local conditions. There are other, more subtle reasons why this specific problem cannot be treated in 2D: The background plasma density generated by the short pulse laser itself is higher in 2D than in 3D because of the translational invariance in the virtual-y dimension. As we discuss below, the maximum electron energy from DLA is quite sensitive to the background plasma density. In addition, because the transverse dimensions of our structures are on the order of the laser wavelength, they tend to act as waveguides which changes the laser phase velocity. The DLA mechanism is strongly affected by the phase velocity of the laser relative to the accelerating hot electron, so that only a 3D simulation can capture this physics (see V.1) .
IV 3D Simulation Results
IV.1 Energy Spectrum
The electron energy spectrum for the 3 types of targets is shown in Fig. 2(d). These simulations are for the laser conditions outlined in 2. The blue curve is for the simple unstructured flat target. Pre-plasma, modeled as an exponential with a scale length of , is included in all of our unstructured flat target simulations because most experimental situations involve generation of some pre-plasma and because it provides a more interesting comparison since pre-plasma increases the laser absorption and coupling to the target. We calculate a conversion efficiency from laser energy to fast electron kinetic energy (electrons with energies ). For the slab type target (b), the conversion efficiency is enhanced to , with substantially more electrons generated above . The tower target yields yet another, different spectrum. With a conversion efficiency of , comparable to that of the flat target with pre-plasma, the spectrum shows a large reduction in the yield of low energy electrons and a dramatic increase in the yield of high energy electrons. Specifically, the conversion efficiencies for fast electrons with energies above are , and for the flat, slab and tower targets respectively. This is a significant re-shaping of the energy spectrum with respect to that from a flat target such that the low energy portion of the electron spectra is shifted to higher energies. These target geometries substantially increase the number of electrons with the highest energies, while maintaining the overall efficiency of coupling. This result constitutes one of the two primary findings of our work. The other concerns the electron angular distribution.
IV.2 Angular Distribution
The simulations show a striking modification of the angular distribution by our targets, as is shown in Fig. 3.
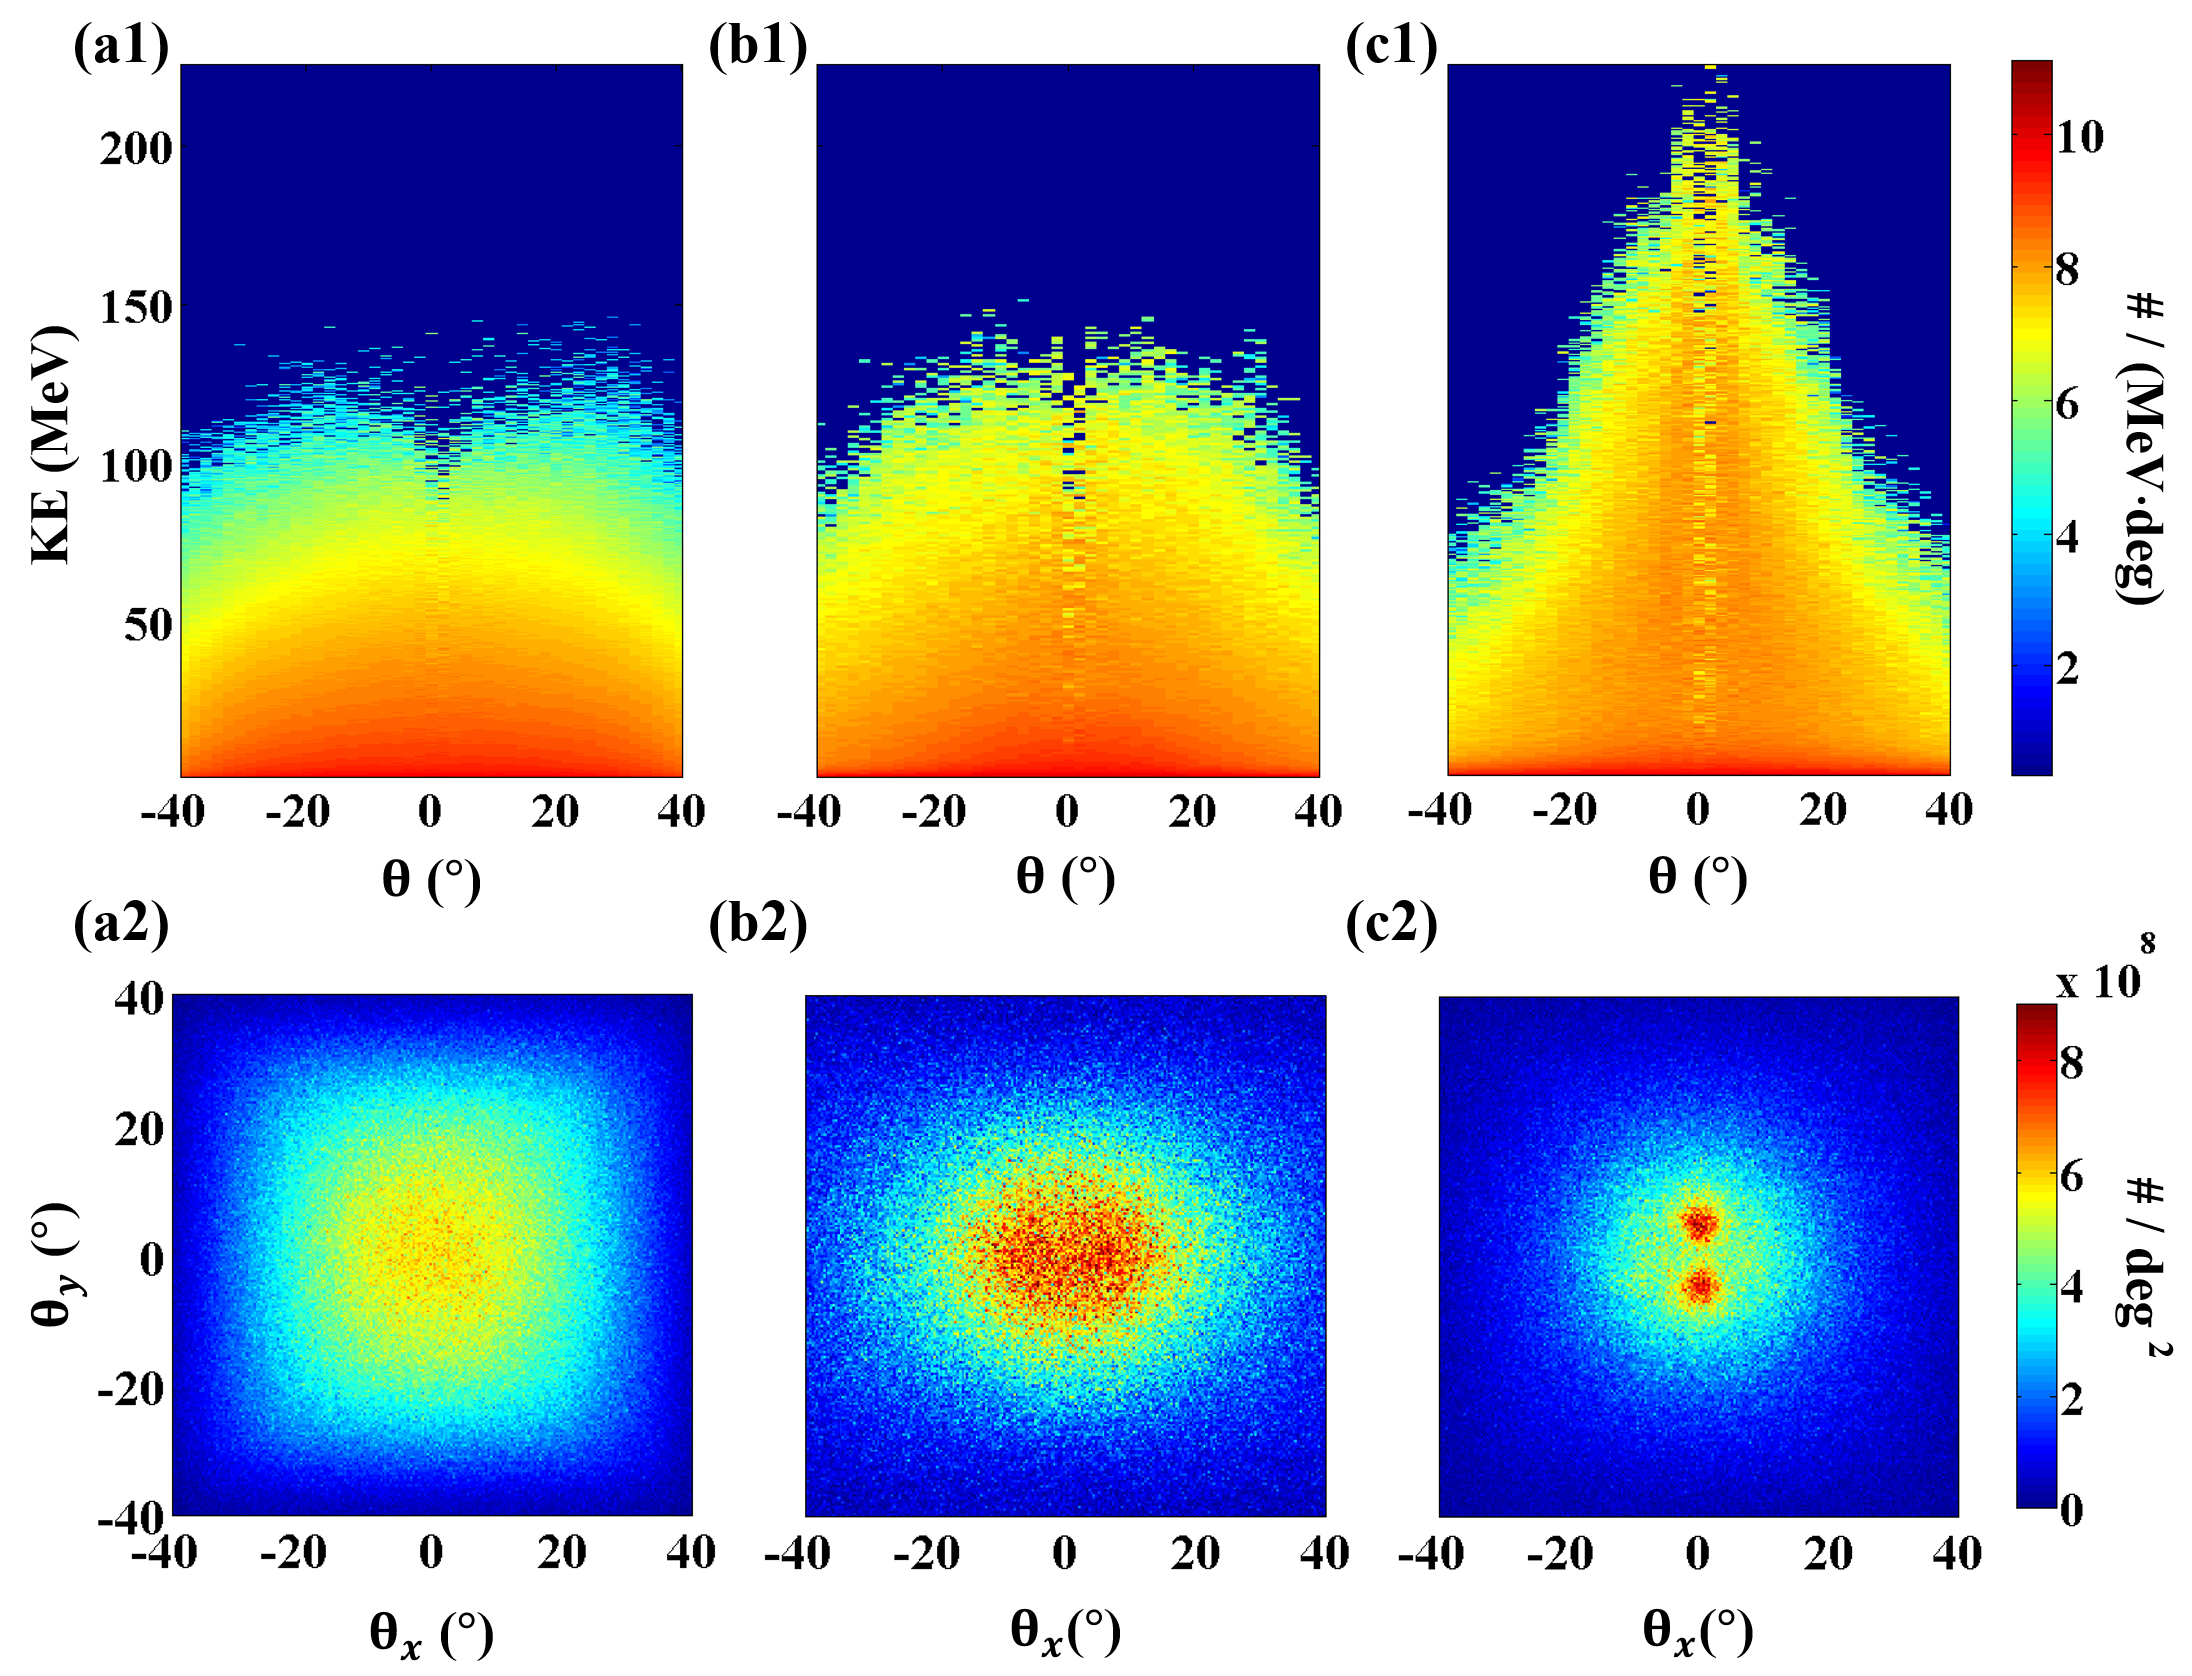
The top row is electron number distribution as a function of kinetic energy and angle. The angle indicates the direction of electron velocities in a solid angle, , where . The bottom row shows the 2D projected divergence map of fast electrons (). The three graphs are the fast electron number distributions as a function of and , where , . Subplots (a1,a2), (b1,b2) and (c1,c2) correspond to targets (a), (b) and (c) in Fig. 2 respectively. Comparing (a1), (b1) and (c1), in general the electron divergence reduces with increasing energy. However, for the flat target, the decrease is small compared to the two types of structured targets. While some collimation is seen in the high energy portion of the electrons generated by the slab target (b1), the tower target (c1) shows a significant improvement in the collimation. This result is clearer in the bottom graphs of Fig. 3. The flat target (a1) shows a cylindrically symmetric angular distribution, with a large divergence angle of about . Both the shape of slab and tower breaks the rotational symmetry, so that, as expected, the corresponding angular distributions do not maintain such symmetry. For the slab target (b1) , the distribution is wider in the x direction than in the y direction. For the tower target (c1), although the target shape itself has rotational symmetry, the angular distribution does not. The distribution shows 2 peaks centered at , each peak is about FWHM.
Remarkably, in the case of the tower target, the highest energy electrons tend to preferentially fall into these 2 small cones. For electrons , approximately of the electrons (or in number) fall into the two full angle cones. We find that for the tower targets the fast electron bunch has a pulse duration of . More importantly, for electrons , the pulse is even shorter, about leading to an average current of . Assuming a source diameter of approximately , this electron source brightness at is on the order of .
V Discussion
We attribute the enhancement in the high energy electron spectrum to direct laser acceleration (DLA) Yang (2009); Krygier (2013); Krygier et al. . Electrons undergoing DLA gain energy directly from the laser fields. This mechanism requires the accelerated electrons to be injected into the pulse at the right phase, and then to travel along with the pulse over a significant length, and then be injected into the target at the critical surface.
V.1 Direct Laser Acceleration
In DLA the highest energies are achieved by electrons which are optimally injected: injected at a point as far from the critical surface as allowed by the laser and evolving plasma and at an ideal phase of the laser. By its nature, DLA is exquisitely sensitive to the initial velocity and position of the accelerated electron relative to the phase of the laser electric field. If a low energy electron is injected into a weak plane wave at a node of the electric field, the electron will gain energy in the first half of the laser cycle and then return it to the pulse during the second half of the cycle. Net energy gain is possible if the electron can remain in the accelerating half-cycle of the laser field long enough and, crucially, can subsequently escape before experiencing the decelerating half-cycle. When the laser intensity is well into the relativistic regime, the Lorentz force accelerates the electron’s longitudinal velocity to roughly the speed of light within the first quarter cycle of the wave. Provided the phase velocity of the laser pulse is close to as well, the appropriately phased moving electron will experience a positive acceleration from the wave over an extended distance and will gain substantial energy. For example, an electron starting at rest introduced into a node of a plane wave in vacuum with an intensity of will accelerate for a distance of , gaining a peak energy of before it begins to decelerate. The purpose of the structure on the front surface of the target is to provide a means for inserting the electrons into the plane wave (see below) as well as permit an extended acceleration length followed by an abrupt exit (at the relativistic critical surface). It is important to note that the vast majority of the electrons, even in the structured targets we propose, do not fulfill the requirement of DLA Krygier (2013); Krygier et al. . This is consistent with the observation that only a small proportion of the laser-plasma electrons are observed to have high energy Link et al. (2011).
In a plasma the phase velocity of the laser pulse depends upon the plasma density and is given by , where ; thus the de-phasing length for an electron undergoing DLA is also sensitive to plasma density. As an example, for an intensity of , if , where is the critical density (, the acceleration length is about and the maximum energy is ; however, increasing the density by a factor of 5, the acceleration length reduces to with a maximum energy of . When we compare the 2D simulation results for the slabs with 3D simulations for both the slabs and the towers, we find the electron cut-off energy for 3D towers to be much higher. This is because the 3D simulation of the towers has the most vacuum space thus lowest background electron density. With lower background density the acceleration length is longer. As discussed in III, this is one reason why 3D simulations are required to accurately predict the production mechanism of hot electrons on non-flat targets. Although 3D slabs have a lower background density than 2D slabs, the cut-off energy is lower due to a different effect that we discuss in V.4.
V.2 Electron Injection
While the DLA mechanism makes it possible in principle to accelerate electrons to significant energies, the practical issue that arises is the need for placing, or injecting, the electrons into the laser field at the proper position and time relative to the oscillating laser fields. A successful injection technique must fulfill four conditions: 1) A significant number of electrons need to be injected; 2) The position where the electrons are injected needs to be far enough from (relativistic) critical density so that there is a sufficient acceleration length; 3) The point of injection should be at a position where the laser intensity is high; 4) Over the course of the acceleration length there must be a channel with a relatively low electron density so the laser can propagate with a phase velocity on the order of, but not significantly larger than, .
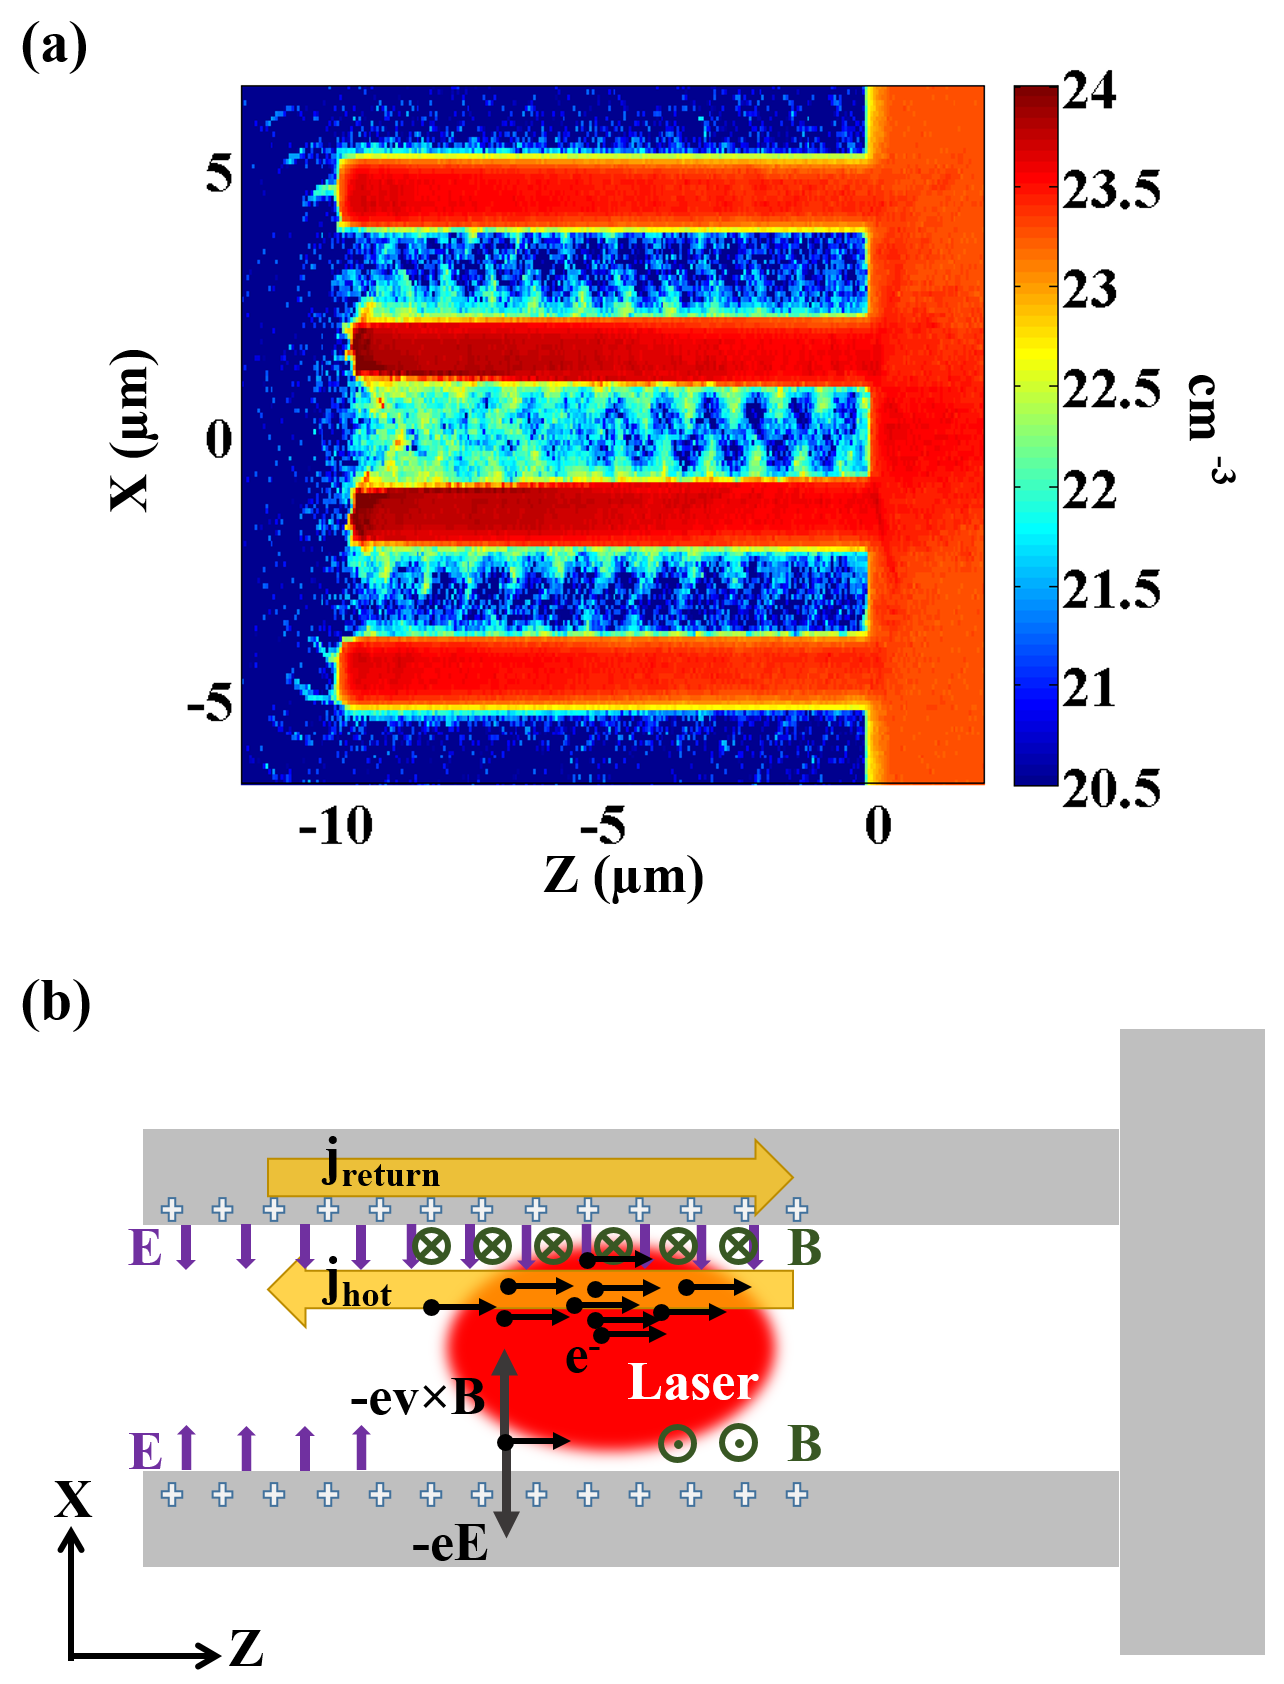
With these conditions in mind, we now address DLA using Fig. 4(a), which shows the electron density from a 2D simulation. (Below we compare this 2D simulation to 3D next where we find that the injection process is similar but the electron confinement to be very different). The laser is incident from the left and the plot is at a time when the laser pulse is roughly half way down the length of the structures. The target and laser parameters are the same as in the 3D simulations: the transverse gap size is , the structures are in width, and in depth. The electrons are pulled out of the structures by the laser E field, as is indicated by the bunches along the structure surfaces. There are several noteworthy characteristic features: The bunches are located in such a way that they are separated by one laser wavelength on one side and are -phase shifted on opposite facing sides, corresponding to regions where ( is the surface normal). At a given time, the bunching maximizes at the point of the electric field anti-nodes. For this intensity, , each bunch has an electron density of more than .The electron density in the center of the gaps is considerably lower such that the pulse has a phase velocity approximately equal to the speed of light. These bunches constitute the injected electrons into the DLA acceleration channel: the final energy of any bunch depends upon when it is formed relative to the laser pulse and the position of its original location. The most energetic electrons originate from the tip of the structures, as long as the structure is shorter than the de-phasing length.
We have found through trial and error that the maximum number of the highest energy electrons occurs when the spacing between the structures is slightly smaller than the laser focal spot, and the laser intensity at the structure surface is sufficiently large to ionize electrons while simultaneously not increasing the electron density in the acceleration channel to the point that the acceleration lengths are reduced due to increased phase velocity of the laser pulse. A full optimization of our structures would require numerous 3D simulations, and these have not been done here. In fact we know that the target size parameters are certainly not optimum: in order to keep the grid size small, and the 3D simulation manageable, we chose a small focal spot so we could have a small spacing between the structures. However, the problem is not scalable: spacing between the structures results in some wave-guiding of the wavelength laser (with its attendant modification of the phase velocity) and the background density between the structures fills too rapidly to preserve the acceleration length.
V.3 Electron Confinement in 2D
In our 2D simulations we observe that electrons are guided by the structure shape. This observation is consistent with other recent 2D simulations Sentoku et al. (2004); Nakamura et al. (2004). The responsible physics based upon the 2D simulation is diagrammed in Fig. 4(b). Once electrons are pulled out into the pulse, some of them with the right initial conditions accelerate with the laser pulse. They form a current density near the slab surface, leaving positive charges at the surface of the structures. These positive charges draw return currents just inside the structure with a current density of in the opposite direction of . Now these two surface currents are uniform in the virtual-y direction in a 2D xz coordinate system, giving rise to a field also uniform in the y direction. At the same time, the charge separation induces an electric field pointing away from the structure surface. These two fields, and , can be quite large; in our simulations, they are approximately 0.3 of the peak laser B and E fields. When the electron velocity in the z direction is approximately the speed of light the Coulomb force from and the magnetic force from are equal and opposite along the surface of the slab, resulting in electrons being guided forward along the structure.
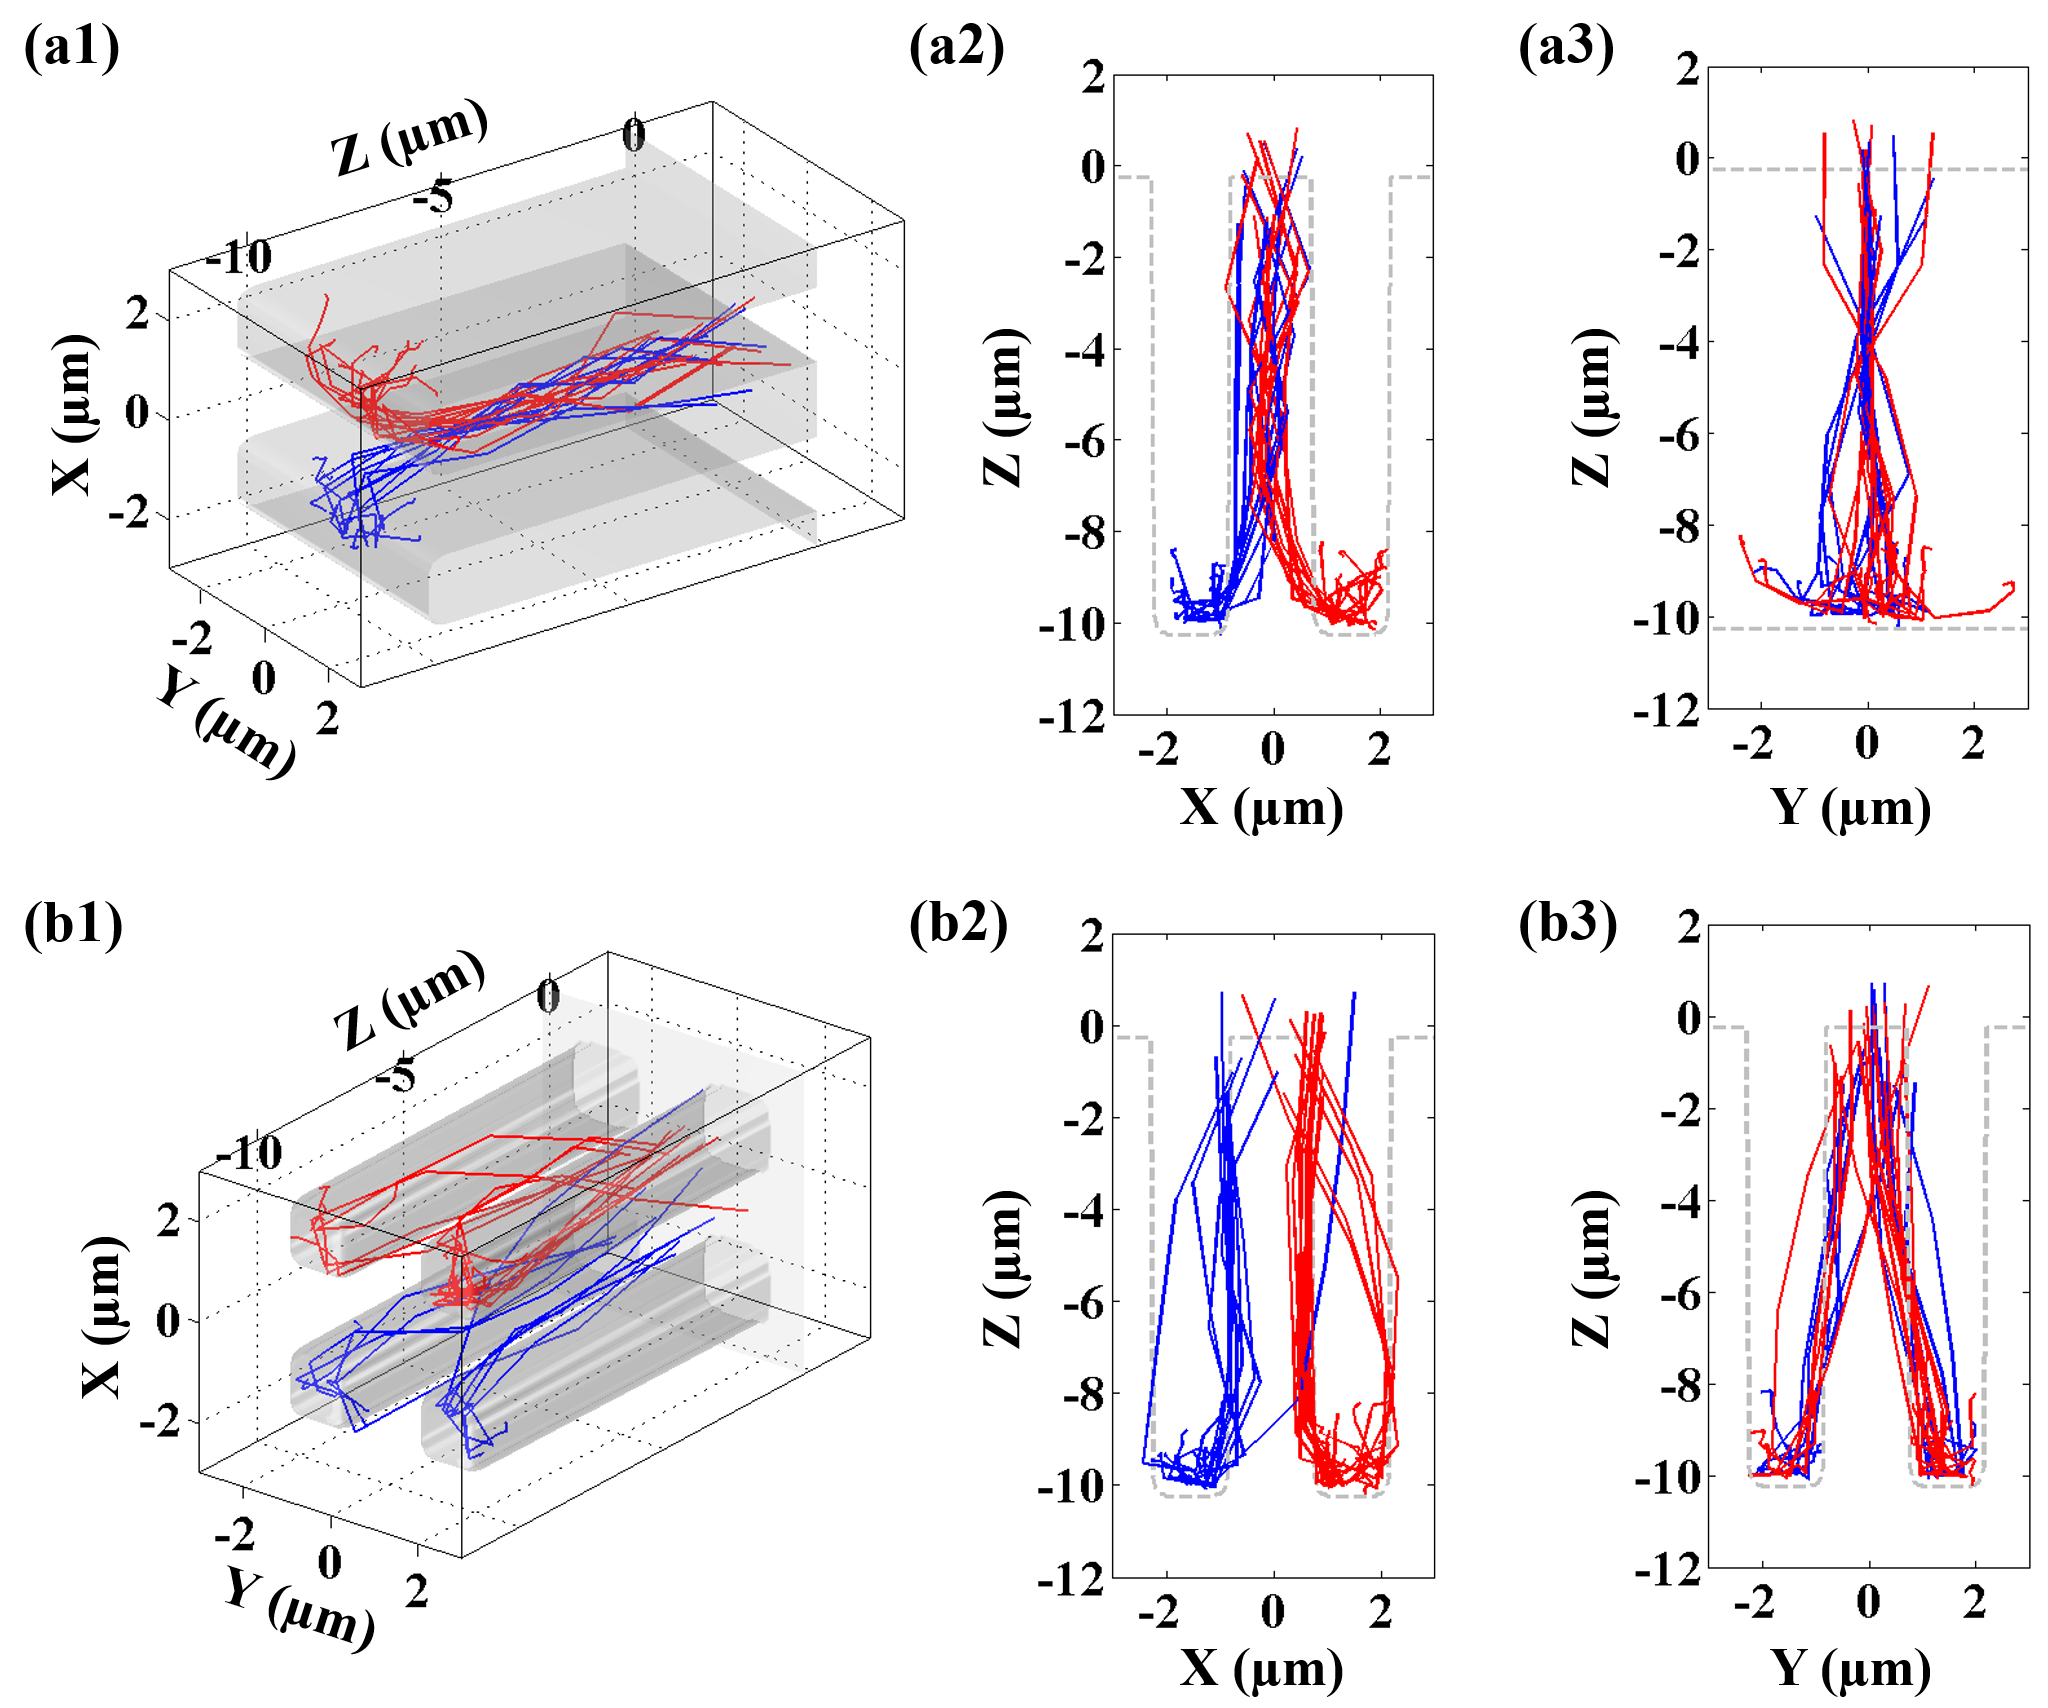
Because the slab targets are invariant in y near the central region where the laser is incident, one might expect them to be essentially well modeled by a 2D simulation and it is tempting to accept the physical picture of electron trapping in the slabs presented above. But, as we discussed earlier, the simulation problem is in fact, not 2D because the laser fields provide forces on the electrons that have an essential 3D element, specifically forces in the y dimension. Fig. 5 (a) shows the trajectories of the high energy hot electrons from the 3D simulation; in contrast to the 2D simulation, they do not propagate along the structure surfaces.
V.4 Electron Confinement in 3D
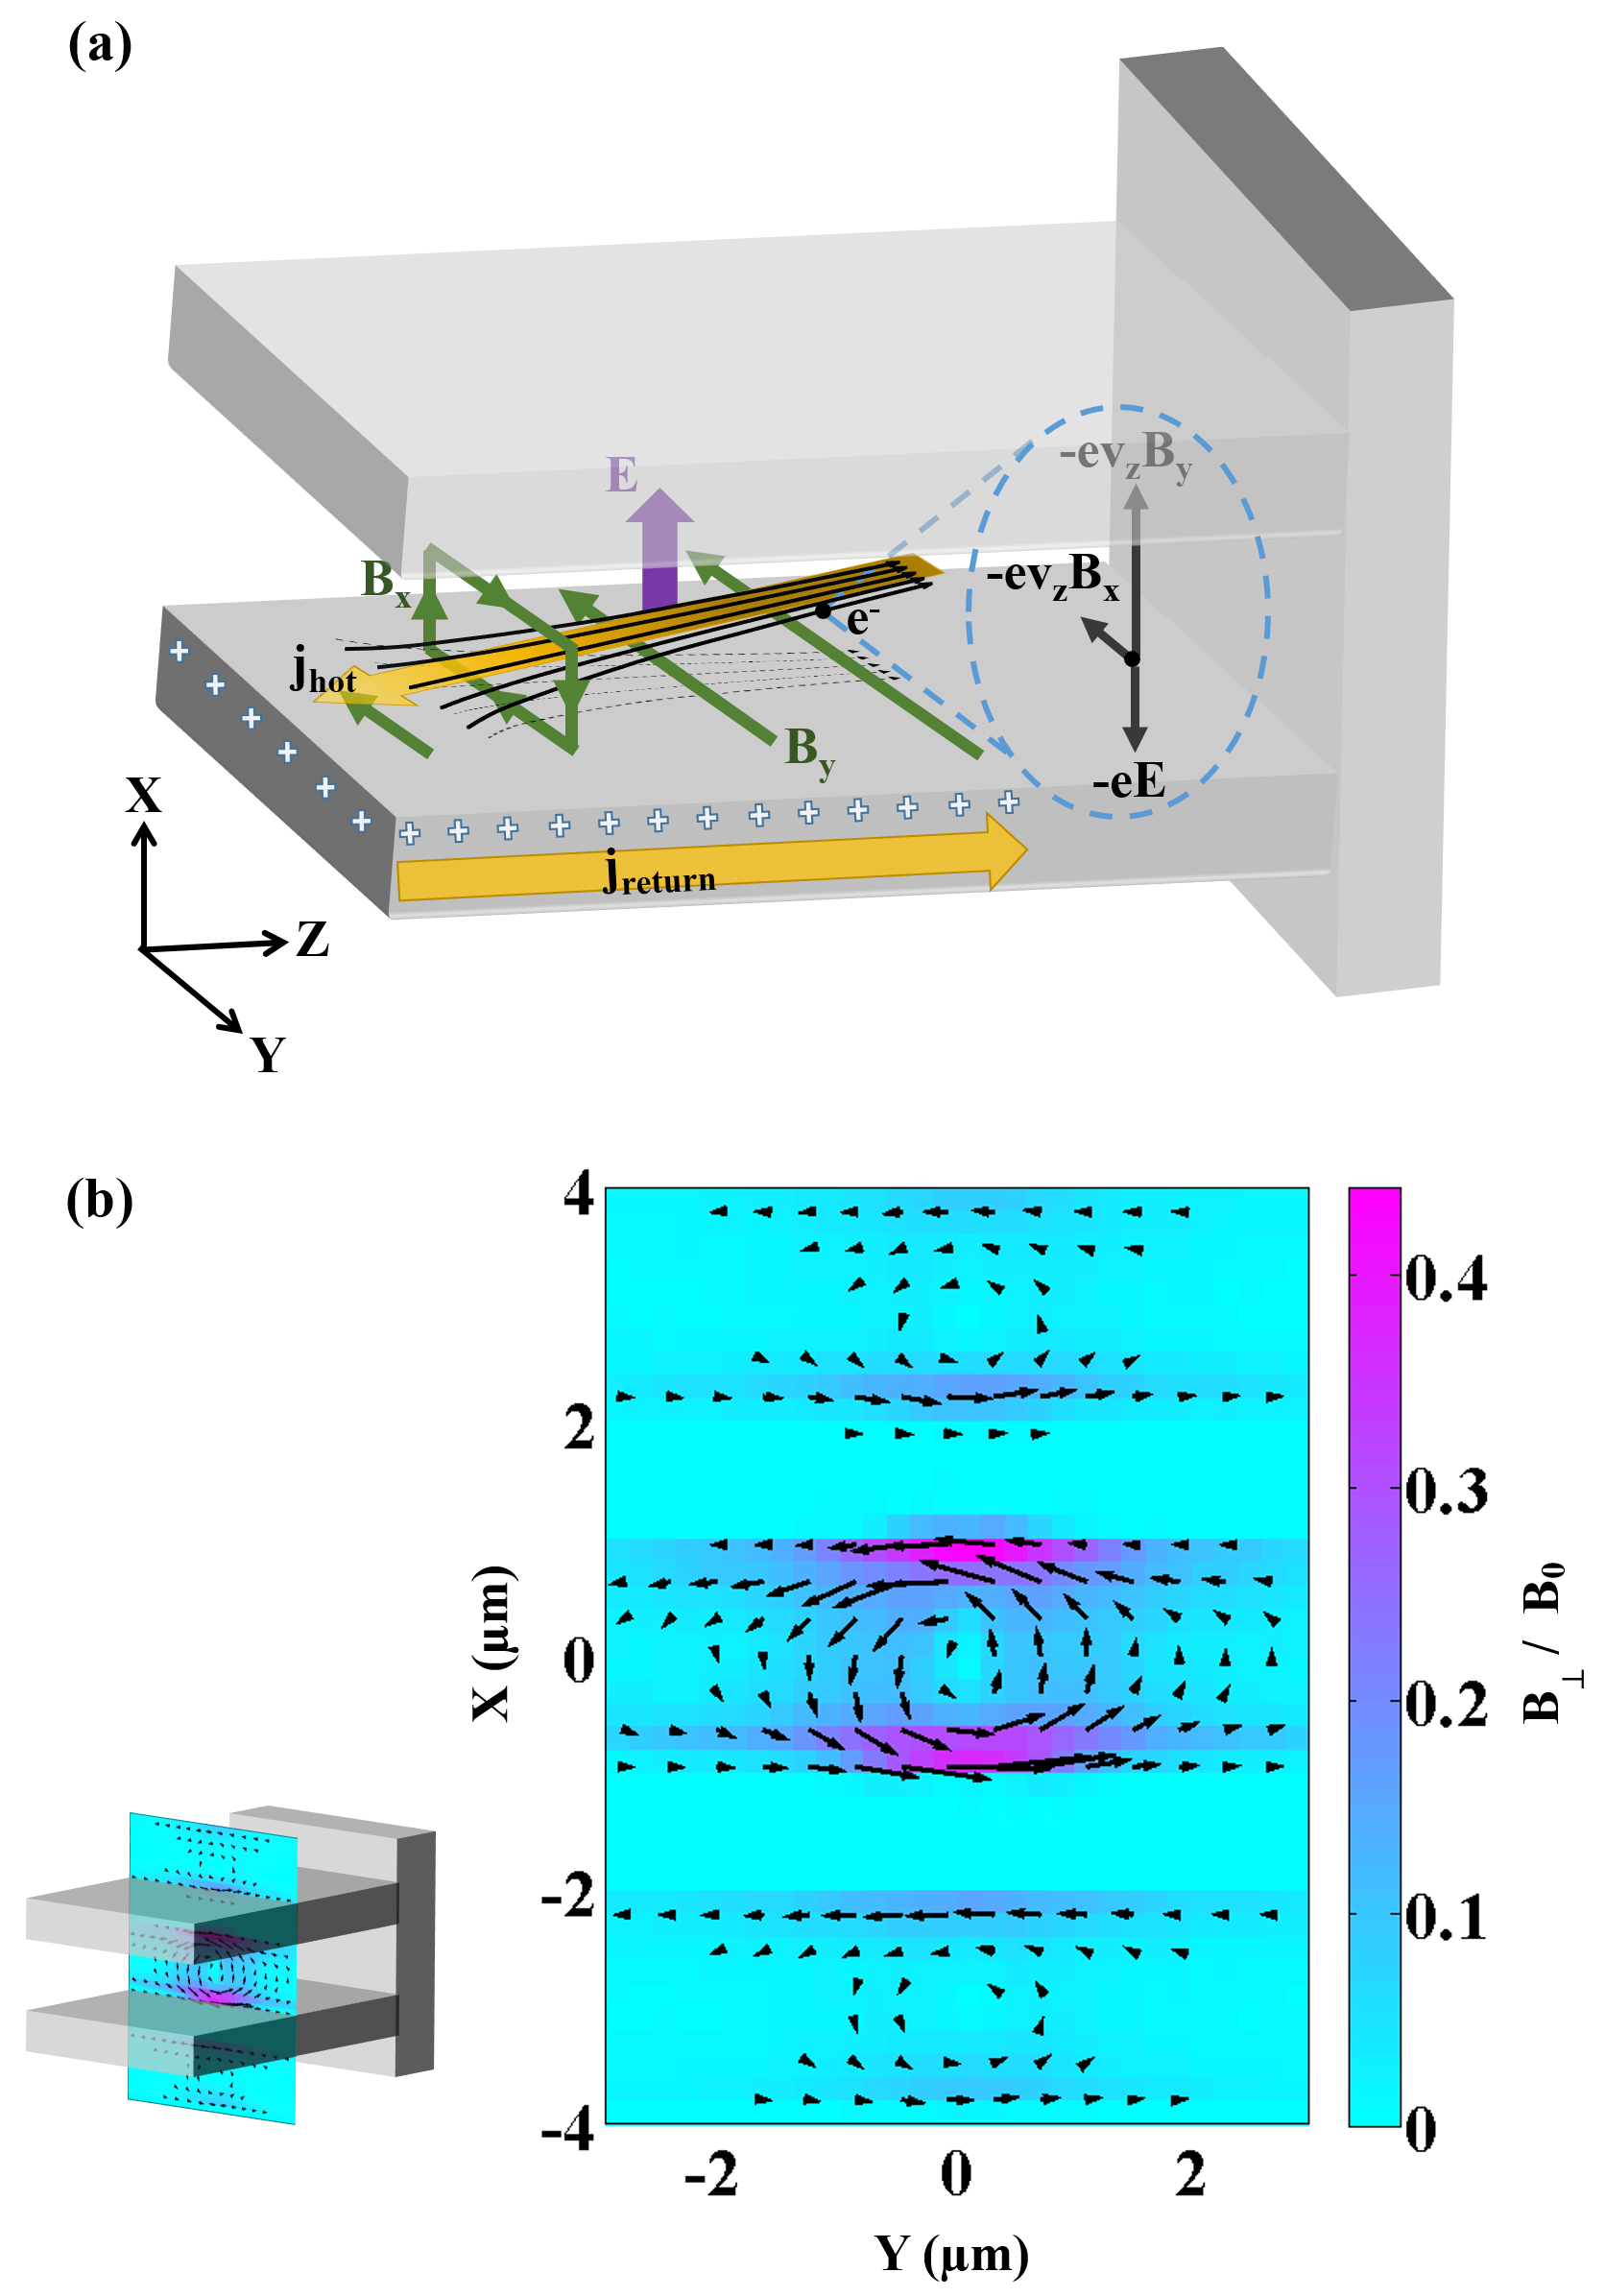
Fig. 6(a) indicates the responsible physics: After the electrons are pulled out into the gap, in addition to a field, there is also a field around the hot electron current. This field pinches the hot electron current in the y direction, leading to an increase in the current density as it propagates. A plot of the B field in the simulation is shown in Fig. 6(b). It is an xy section of , the B field normal to z. The color map shows the magnitude while the black arrows indicate the directions. While the return current remains the same as in the 2D simulation, here the field stemming from both and grows such that the Lorentz force exceeds the Coulomb force. Electrons are thus pulled away from the slab surface, and since the spacing between the slabs is much smaller than the length of the slabs, electrons can easily hit the slab on the other side and again bounce back into the gap. In general, the 3D simulation shows that the electrons are pinched in the y dimension, and bounce back and forth in the x dimension. For the electrons, each bounce off of a surface means a sudden reversal of sign in , and the DLA force, , becomes a decelerating force, effectively terminating the acceleration length and thus restraining the energy gain in the forward direction. This physics is responsible for the fact that the cutoff energy found in our 3D simulations of the slabs is consistently smaller than the cutoff energy found in our 2D simulations. In addition, these bounces also widen the angular distribution of the emitted electrons in the x direction while, in the y direction, the angular spread is determined by the pinching. This explains the asymmetry in Fig. 3(b2)
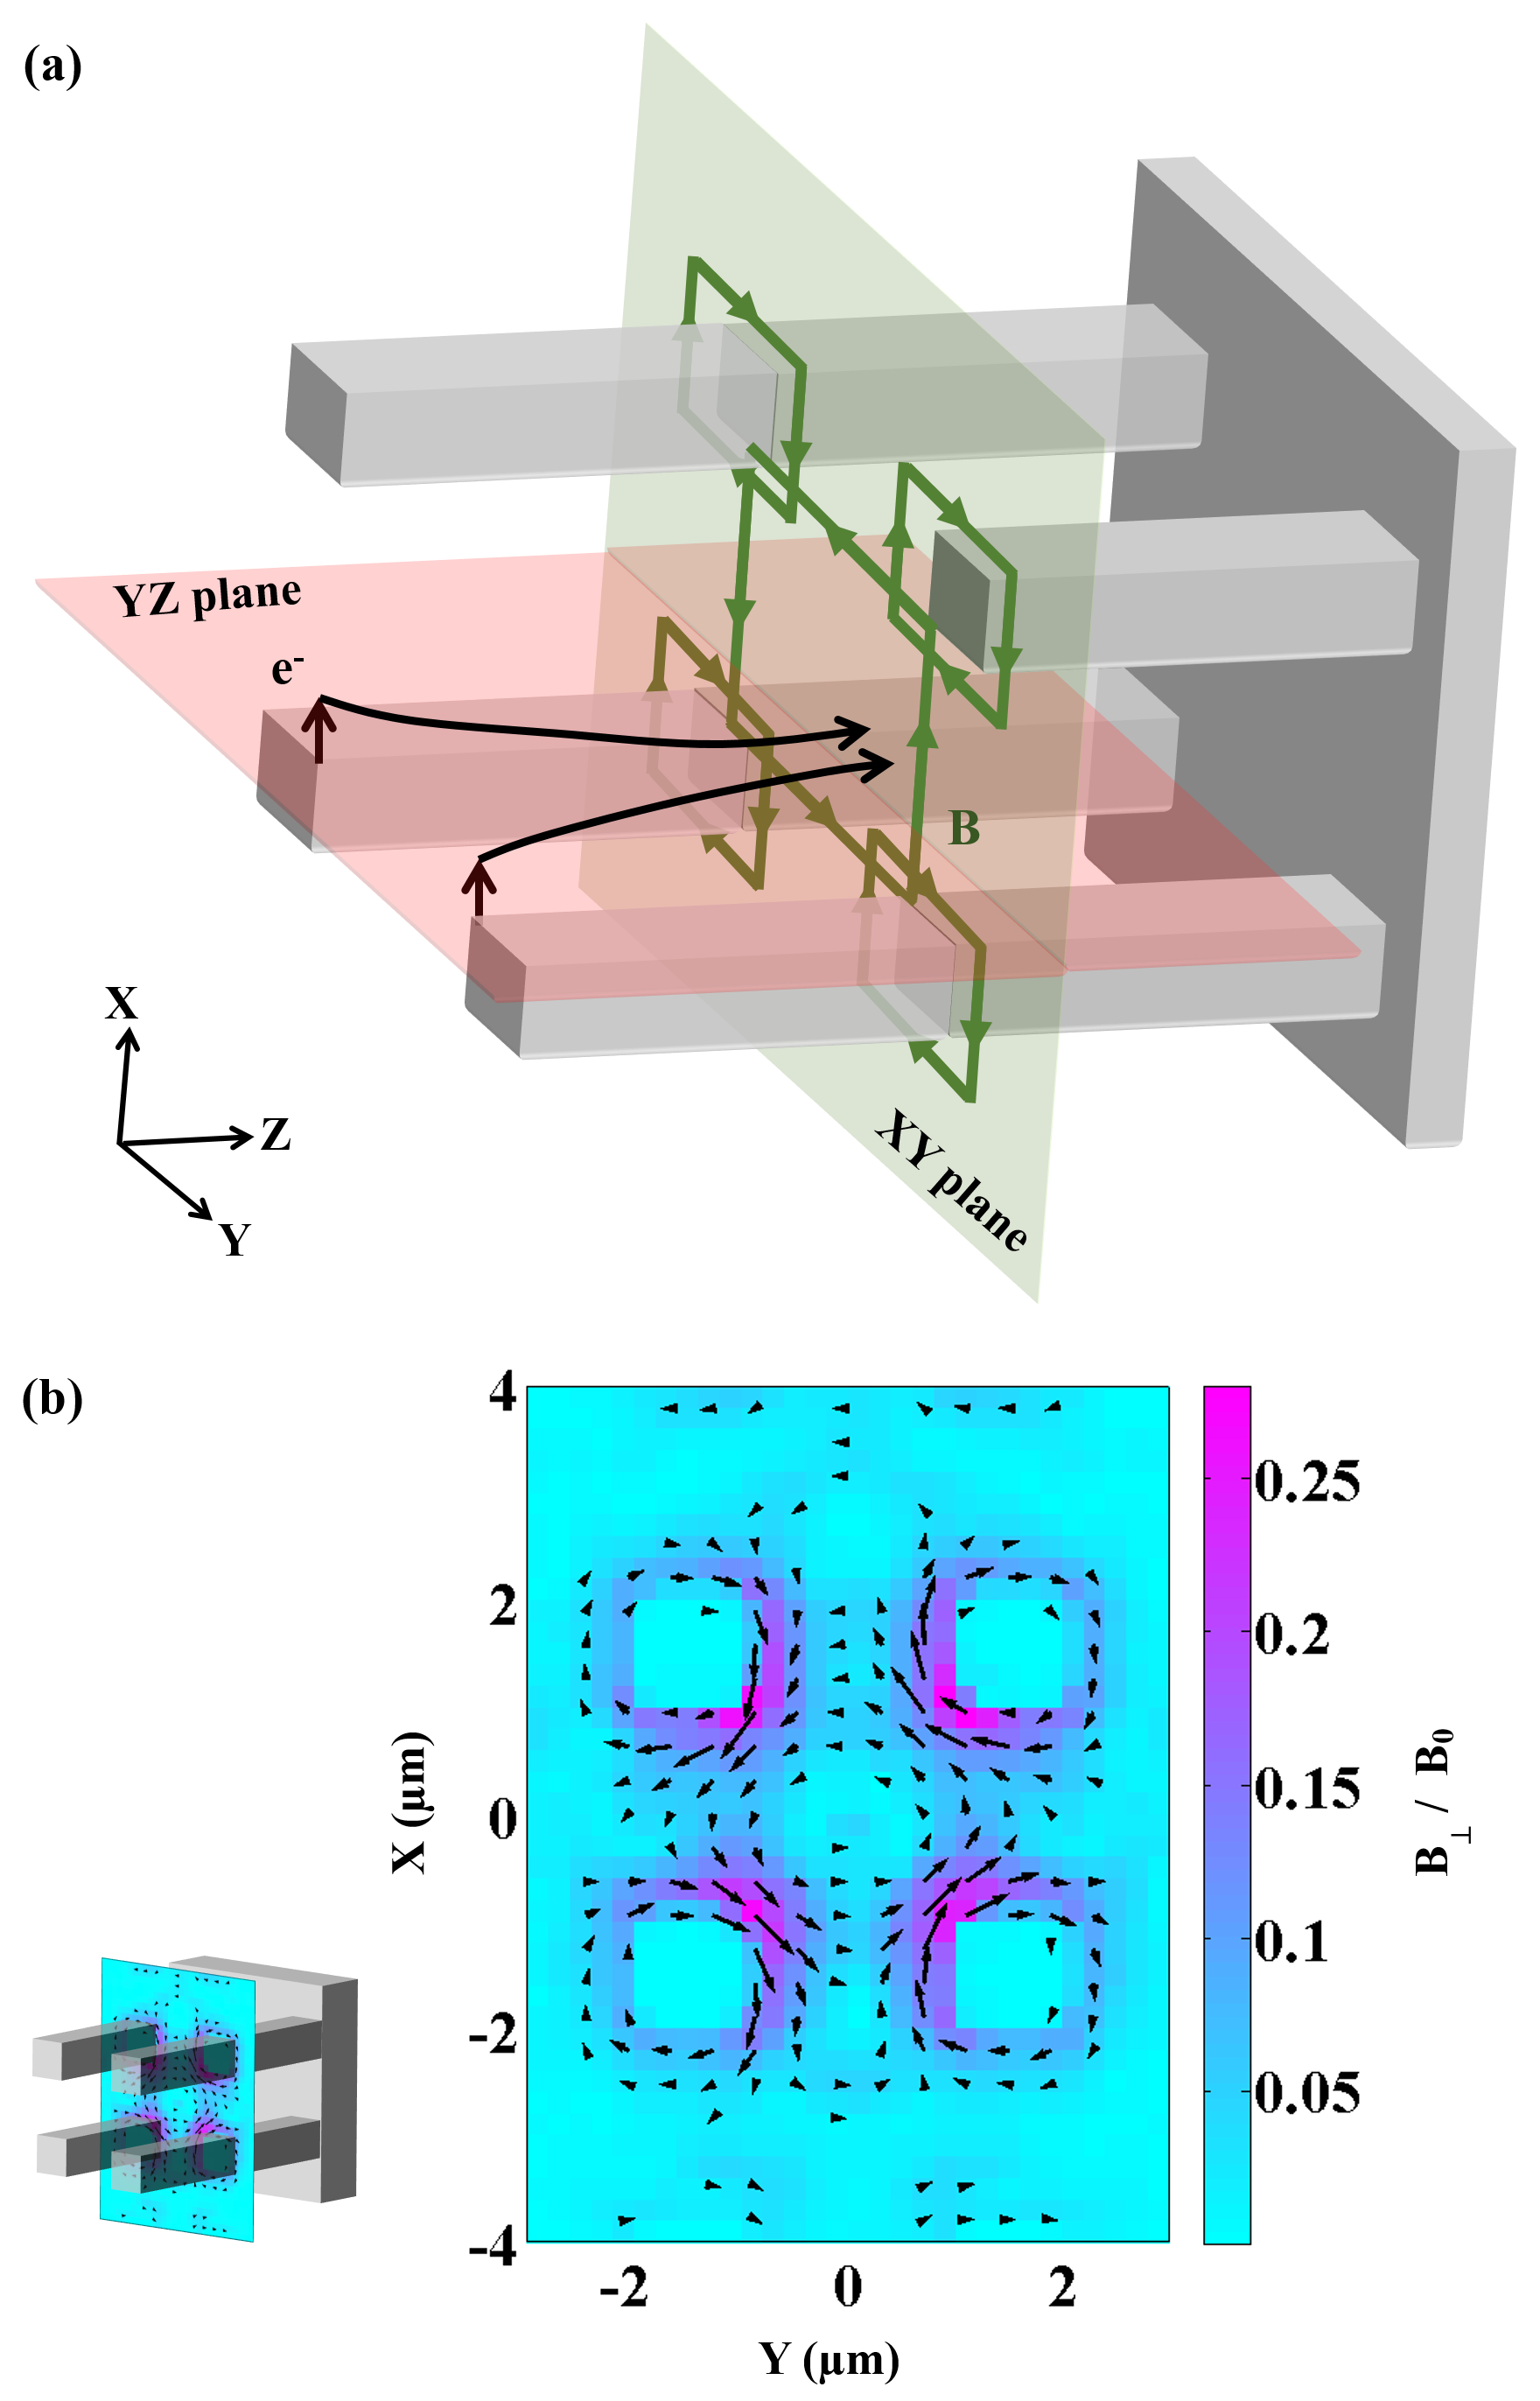
Because the 3D simulation of the slab targets suggests that the acceleration length is constrained by the collisions with the walls, an obvious improvement is to reduce the probability of collision with the walls by replacing the slabs with towers (see Fig. 2). A field analysis of the tower target structure is shown in Fig. 7. The green arrows in Fig. 7(a) are a cartoon of the B field directions in the xy plane consistent with the directions of and . Fig. 7(b) is an xy field map taken from the simulation indicating at the plane where the laser peak is located. Electrons start off by being pulled out by the laser E field in the x direction, where they spill into the gaps in the XZ plane between the towers. Inside these gaps, because the E field points mainly in the charge separation direction x, its force on the electrons can balance that due to when the electrons are along the tower surfaces. However, the component of the Lorentz force causes the electrons to move in the y direction towards y=0. The general trend of the high energy fast electron trajectories is shown by the black curves in Fig. 7(a). Electrons are mostly confined in the yz plane (red plane in Fig. 7(a)) close to the towers. They are bent towards the center in the y direction, where the field is small and plays no important role in the electron trajectories. This explains the two peaks along the y direction in the angular distribution map Fig. 3(c2).
Fig. 5 shows the trajectories of a sampling of electrons above in simulations for both slab and tower targets. Electrons originating from () are labeled red (blue). For the slab-structured target, it is clear that electrons bounce between the slab walls looking down the y axis (Fig. 5(a2)), and pinch looking down the x axis (Fig. 5(a3)). For the tower-structured target, the confinement is in the XZ plane (Fig. 5(b2)) and the pinching is in the YZ plane (Fig. 5(b3)).
VI Conclusion
We have proposed front surface target structures (towers and slabs) for use in the generation of high energy, collimated electrons. We have shown that these targets cannot be adequately studied in 2D PIC simulations, but require 3D. This will generally be the case for structured targets. Compared to regular flat targets with pre-plasma, the yield of electrons at the high energy end can be improved by several orders of magnitude, while the FWHM divergence angle of the most energetic hot electrons can be greatly reduced to 5∘. For electrons above , the average current can be as high as . For high energy electrons, e.g. electrons at , the brightness is on the order of . The conversion efficiency from laser to fast electrons using towers is comparable to that using a flat target with pre-plasma, while using slabs the conversion efficiency is improved by . For electrons with energies above , the conversion efficiencies are , and for the three targets respectively. This makes front surface targets ideal for applications requiring collimated high-energy electrons. We have shown that the hot electrons generated using our structured targets are accelerated through the direct laser acceleration mechanism (DLA) and are guided by surface fields. Since the guiding effect is a sensitive function of the details of the target shape, a precise description of the target shape in 3D is required not only to determine the correct guiding fields, but is also important in terms of getting correct background plasma density and wave guiding effects, both of which can drastically change the electron energy.
Acknowledgements.
This work is supported by the AFOSR Young Investigator Program (YIP) under contract No.FA9550-12-1-0341. Sheng Jiang would like to thank Dr. Morrison for useful discussions. Computational time was granted by the Ohio Supercomputer Center.References
- Murnane et al. (1989) M. M. Murnane, H. C. Kapteyn, and R. W. Falcone, Phy. Rev. Lett. 62, 155 (1989).
- Kmetec et al. (1992) J. D. Kmetec, C. L. Gordon, J. J. Macklin, B. E. Lemoff, G. S. Brown, and S. E. Harris, Phy. Rev. Lett. 68, 1527 (1992).
- Schnürer et al. (1995) M. Schnürer, M. P. Kalashnikov, P. V. Nickles, T. Schlegel, W. Sandner, N. Demchenko, R. Nolte, and P. Ambrosi, Phys. Plasmas 2, 3106 (1995).
- Shearer et al. (1973) J. W. Shearer, J. Garrison, J. Wong, and J. E. Swain, Phys. Rev. A 8, 1582 (1973).
- Chen et al. (2009) H. Chen, S. C. Wilks, J. D. Bonlie, E. P. Liang, J. Myatt, D. F. Price, D. D. Meyerhofer, and P. Beiersdorfer, Phys. Rev. Lett. 102, 105001 (2009).
- Clark et al. (2000) E. L. Clark, K. Krushelnick, J. R. Davies, M. Zepf, M. Tatarakis, F. N. Beg, A. Machacek, P. A. Norreys, M. I. K. Santala, I. Watts, et al., Phy. Rev. Lett. 84, 670 (2000).
- Wilks et al. (1992) S. C. Wilks, W. L. Kruer, M. Tabak, and A. B. Langdon, Phy. Rev. Lett. 69, 1383 (1992).
- Beg et al. (1997) F. N. Beg, A. R. Bell, A. E. Dangor, C. N. Danson, A. P. Fews, M. E. Glinsky, B. A. Hammel, P. Lee, P. A. Norreys, and M. Tatarakis, Phys. Plasmas 4, 447 (1997).
- Haines et al. (2009) M. G. Haines, M. S. Wei, F. N. Beg, and R. B. Stephens, Phy. Rev. Lett. 102, 045008 (2009).
- Kluge et al. (2011) T. Kluge, T. Cowan, A. Debus, U. Schramm, K. Zeil, and M. Bussmann, Phy. Rev. Lett. 107, 205003 (2011).
- Paradkar et al. (2011) B. S. Paradkar, M. S. Wei, T. Yabuuchi, R. B. Stephens, M. G. Haines, S. I. Krasheninnikov, and F. N. Beg, Phys. Rev. E 83, 046401 (2011).
- Scott et al. (2012) R. H. H. Scott, F. Perez, J. J. Santos, and C. P. Ridgers, Phys. Plasmas 19, 053104 (2012).
- Ovchinnikov et al. (2013) V. M. Ovchinnikov, D. W. Schumacher, M. McMahon, E. A. Chowdhury, C. D. Chen, A. Morace, and R. R. Freeman, Phy. Rev. Lett. 110, 065007 (2013).
- Palchan et al. (2007) T. Palchan, S. Pecker, Z. Henis, S. Eisenmann, and A. Zigler, App. Phys. Lett. 90, 041501 (2007).
- Rajeev et al. (2003) P. P. Rajeev, P. Taneja, P. Ayyub, A. S. Sandhu, and G. R. Kumar, Phy. Rev. Lett. 90, 115002 (2003).
- Sumeruk et al. (2007) H. A. Sumeruk, S. Kneip, D. R. Symes, I. V. Churina, A. V. Belolipetski, T. D. Donnelly, and T. Ditmire, Phy. Rev. Lett. 98, 045001 (2007).
- Kulcsar et al. (2000) G. Kulcsar, D. AlMawlawi, F. W. Budnik, P. R. Herman, M. Moskovits, L. Zhao, and R. S. Marjoribanks, Phy. Rev. Lett. 84, 5149 (2000).
- Murnane et al. (1993) M. M. Murnane, H. C. Kapteyn, S. P. Gordon, J. Bokor, and E. N. Glytsis, App. Phys. Lett. 62, 1068 (1993).
- Kahaly et al. (2008) S. Kahaly, S. K. Yadav, W. M. Wang, S. Sengupta, Z. M. Sheng, A. Das, P. K. Kaw, and G. R. Kumar, Phy. Rev. Lett. 101, 145001 (2008).
- Hu et al. (2010) G. Hu, A. Lei, J. Wang, L. Huang, W. Wang, X. Wang, Y. Xu, B. Shen, J. Liu, W. Yu, et al., Phys. Plasmas 17, 083102 (2010).
- Margarone et al. (2012) D. Margarone, O. Klimo, I. J. Kim, J. Prokupek, J. Limpouch, T. M. Jeong, T. Mocek, J. Pšikal, H. T. Kim, J. Proška, et al., Phy. Rev. Lett. 109, 234801 (2012).
- Kupersztych et al. (2004) J. Kupersztych, M. Raynaud, and C. Riconda, Phys. Plasmas 11, 1669 (2004).
- Klimo et al. (2011) O. Klimo, J. Psikal, J. Limpouch, J. Proska, F. Novotny, T. Ceccotti, V. Floquet, and S. Kawata, New J. Phys. 13, 053028 (2011).
- Andreev et al. (2011) A. Andreev, N. Kumar, K. Platonov, and A. Pukhov, Phys. Plasmas 18, 103103 (2011).
- Kemp et al. (2013) G. E. Kemp, A. Link, Y. Ping, D. W. Schumacher, R. R. Freeman, and P. K. Patel, Phys. Plasmas 20, 2033104 (2013).
- Kluge et al. (2012) T. Kluge, S. A. Gaillard, K. A. Flippo, T. Burris-Mog, W. Enghardt, B. Gall, M. Geissel, A. Helm, S. D. Kraft, T. Lockard, et al., New J. Phys. 14, 023038 (2012).
- Gaillard et al. (2011) S. A. Gaillard, T. Kluge, K. A. Flippo, M. Bussmann, B. Gall, T. Lockard, M. Geissel, D. T. Offermann, M. Schollmeier, Y. Sentoku, et al., Phys. Plasmas 18, 056710 (2011).
- Zigler et al. (2013) A. Zigler, S. Eisenman, M. Botton, E. Nahum, E. Schleifer, A. Baspaly, I. Pomerantz, F. Abicht, J. Branzel, G. Priebe, et al., Phy. Rev. Lett. 110, 215004 (2013).
- Zheng et al. (2011) J. Zheng, Z.-M. Sheng, J.-L. Liu, W.-M. Zhou, H. Xu, and J. Zhang, Phys. Plasmas 18, 113103 (2011).
- Cao et al. (2010a) L. Cao, Y. Gu, Z. Zhao, L. Cao, W. Huang, W. Zhou, X. T. He, W. Yu, and M. Y. Yu, Phys. Plasmas 17, 043103 (2010a).
- Cao et al. (2010b) L. Cao, Y. Gu, Z. Zhao, L. Cao, W. Huang, W. Zhou, H. B. Cai, X. T. He, W. Yu, and M. Y. Yu, Phys. Plasmas 17, 103106 (2010b).
- Zhao et al. (2010) Z. Zhao, L. Cao, L. Cao, J. Wang, W. Huang, W. Jiang, Y. He, Y. Wu, B. Zhu, K. Dong, et al., Phys. Plasmas 17, 123108 (2010).
- Cao et al. (2011) L. Cao, M. Chen, Z. Zhao, H. Cai, S. Wu, et al., Phys. Plasmas 18, 054501 (2011).
- Wang et al. (2012) H. Wang, L. Cao, Z. Zhao, M. Y. Yu, Y. Gu, and X. T. He, Laser and Particle Beams 30, 553 (2012).
- Yu et al. (2012a) J. Yu, Z. Zhao, X. Jin, F. Wu, Y. Yan, et al., Phys. Plasmas 19, 053108 (2012a).
- Yu et al. (2012b) J. Yu, W. Zhou, L. Cao, Z. Zhao, L. Cao, B. Li, and Y. Gu, App. Phys. Lett. 100, 204101 (2012b).
- Baton et al. (2008) S. D. Baton, M. Koenig, J. Fuchs, A. Benuzzi-Mounaix, P. Guillou, B. Loupias, T. Vinci, L. Gremillet, C. Rousseaux, M. Drouin, et al., Phys. Plasmas 15, 042706 (2008).
- Psikal et al. (2010) J. Psikal, V. T. Tikhonchuk, J. Limpouch, and O. Klimo, Phys. Plasmas 17, 013102 (2010).
- Micheau et al. (2010) S. Micheau, A. Debayle, E. d’Humières, J. J. Honrubia, B. Qiao, M. Zepf, M. Borghesi, and M. Geissler, Phys. Plasmas 17, 122703 (2010).
- Stephens et al. (2004) R. B. Stephens, R. A. Snavely, Y. Aglitskiy, F. Amiranoff, C. Andersen, D. Batani, S. D. Baton, T. Cowan, R. R. Freeman, T. Hall, et al., Phys. Rev. E 69, 066414 (2004).
- Akli et al. (2012) K. U. Akli, M. J. Storm, M. McMahon, S. Jiang, V. Ovchinnikov, D. W. Schumacher, and R. R. Freeman, Phys. Rev. E 86, 026404 (2012).
- Welch et al. (2006) D. R. Welch, D. V. Rose, M. E. Cuneo, R. B. Campbell, and T. A. Mehlhorn, Phys. Plasmas 13, 063105 (2006).
- Link et al. (2011) A. Link, R. R. Freeman, D. W. Schumacher, and L. D. V. Woerkom, Phys. Plasmas 18, 053107 (2011).
- Yang (2009) J.-H. Yang, Ph.D. thesis, University of Rochester (2009).
- Krygier (2013) A. Krygier, Ph.D. thesis, The Ohio State University (2013).
- (46) A. Krygier, D. W. Schumacher, and R. R. Freeman, (unpublished).
- Sentoku et al. (2004) Y. Sentoku, K. Mima, H. Ruhl, Y. Toyama, R. Kodama, and T. E. Cowan, Phy. Rev. Lett. 11, 3083 (2004).
- Nakamura et al. (2004) T. Nakamura, S. Kato, H. Nagatomo, and K. Mima, Phy. Rev. Lett. 93, 265002 (2004).