Phase-space dependence of particle-ratio fluctuations in Pb+Pb collisions from 20A to 158A GeV beam energy
Abstract
A novel approach, the identity method, was used for particle identification and the study of fluctuations of particle yield ratios in Pb+Pb collisions at the CERN Super Proton Synchrotron (SPS). This procedure allows to unfold the moments of the unknown multiplicity distributions of protons (p), kaons (K), pions () and electrons (e). Using these moments the excitation function of the fluctuation measure [A,B] was measured, with A and B denoting different particle types. The obtained energy dependence of agrees with previously published NA49 results on the related measure . Moreover, was found to depend on the phase space coverage for [K,p] and [K,] pairs. This feature most likely explains the reported differences between measurements of NA49 and those of STAR in central Au+Au collisions.
I Introduction
By colliding heavy ions at high energies one hopes to heat and/or compress the matter to energy densities at which the production of the Quark-Gluon Plasma (QGP) begins QGP1 ; QGP2 . Lattice QCD calculations can study this non-perturbative regime of QCD LatticeQCD and allow a quantitative investigation of the QGP properties. A first order phase boundary is expected to separate high temperature hadron matter from the QGP for large net baryon density and is believed to end in a critical point Stephanov . A wealth of ideas have been proposed to explore the properties and the phase structure of strongly interacting matter. Event-by-event fluctuations of various observables may be sensitive to the transitions between hadronic and partonic phases StepRajShur ; Koch . Moreover, the location of the critical point may be signalled by a characteristic pattern in the energy and system size dependence of the measured fluctuation signals.
Pb+Pb reactions were investigated at the CERN SPS since 1994 by a variety of experiments at the top SPS energy. Many of the predicted signals of the QGP were observed HeinzJacob , but their uniqueness was in doubt. Motivated by predictions of the Statistical Model for the Early Stage of nucleus-nucleus collisions SMES of characteristic changes of hadron production properties at the onset of QGP creation (onset of the deconfinement) the NA49 experiment performed a scan of the entire SPS energy range, from 158A down to 20A GeV. The predicted features were found at an energy of about 30A GeV in central Pb+Pb collisions NA49_horn , thereby indicating the onset of deconfinement in collisions of heavy nuclei in the SPS beam energy range. These observations have recently been confirmed by the RHIC beam energy scan and the expected trend towards higher energy is consistent with LHC data NA49_Rustamov .
Motivated by these findings the NA49 Collaboration has started to explore the phase diagram of strongly interacting matter, with the aim of searching for indications of the first order phase transition and the critical point by studying several measures of fluctuations. In particular, the energy dependence of dynamical event-by-event fluctuations of the particle composition was investigated using the measure (A/B) with A and B denoting the multiplicities of different particle species. An increasing trend of for both K/p and K/ ratios towards lower collision energies was observed NA49_fluct1 ; NA49_fluct2 ; NA49_fluct3 . In contrast, recent results of the STAR experiment from the Beam Energy Scan (BES) at the Relativistic Heavy Ion Collider (RHIC) show practically no energy dependence of the related event-by-event fluctuation measure voloshin_nu for [K, p] and [K, ] pairs STAR_fluct . The comparison between NA49 and corresponding STAR results was performed using the relation
| (1) |
However, the accuracy of this relation decreases inversely with multiplicity, i.e. at lower energies this relation is only approximate. In order not to rely on this approximation the fluctuation measure was directly reconstructed in this paper using a novel identification scheme, the Identity Method identity1 ; identity2 . The procedure avoids event-by-event particle ratio fits and the use of mixed events necessary to subtract the artificial correlations introduced by the fits. Moreover, the much improved statistical power allows to study the effects of the different phase space coverage of the NA49 (forward rapidities) and STAR (central rapidity, without low- range) experiments.
The paper is organized as follows. Details about the detector setup and the data are given in section II. Section III discusses the event and track selection criteria. The novel features of this analysis, i.e. the particle identification procedure and the extraction of the moments of the multiplicity distributions, are discussed in sections IV and V, respectively. Section VI presents the estimates of statistical and systematic uncertainties. Results on and their phase-space dependence are discussed in sections VII and VIII. Finally, section IX summarizes the paper.
II Experimental setup and the data
This paper presents results for central Pb+Pb collisions at projectile energies of 20A, 30A, 40A, 80A and 158A GeV, recorded by the NA49 experiment (for a detailed description of the NA49 apparatus cf. Ref. NA49_NIM ). The principal tracking detectors are four large volume Time Projection Chambers (TPC) with two of them, Vertex TPCs (VTPC1 and VTPC2), placed inside superconducting dipole magnets with a combined maximum bending power of 9 Tm for a length of 7 m. Care was taken to keep the detector acceptance approximately constant with respect to midrapidity by setting the magnetic field strength proportional to the beam energy. Particle identification in this analysis is achieved by simultaneous measurement of particle momenta and their specific energy loss dE/dx in the gas volume of the main TPCs (MTPC-L and MTPC-R). These are located downstream of the magnets on either side of the beam, have large dimensions (4 m 4 m 1.2 m) and feature 90 readout pad rows, providing an energy loss measurement with a resolution of about 4. In the experiment Pb beams with an intensity of 104 ions/s were incident on a thin lead foil located 80 cm upstream of the VTPC-1. For 20A - 80A GeV and 158A GeV the target thicknesses amounted to 0.224 g/cm2 and 0.336 g/cm2, correspondingly. The centrality of a collision was determined based on the energy of projectile spectators measured in the veto calorimeter (VCAL) which is located 26 m behind the target and covers the projectile-spectator phase space region. A collimator in front of the calorimeter was adjusted for each energy in such a way that all projectile spectator protons, neutrons and beam fragments could reach the veto calorimeter while keeping the number of produced particles hitting the calorimeter as small as possible.
| Beam energy | ||||
| [GeV] | [GeV] | |||
| 20A | 6.3 | 169k | 63 | 46 |
| 30A | 7.6 | 179k | 113 | 75 |
| 40A | 8.7 | 195k | 159 | 99 |
| 80A | 12.3 | 136k | 315 | 181 |
| 158A | 17.3 | 125k | 560 | 310 |
III Event and track selection criteria
The only event selection criterion used in this analysis is a centrality cut based on the energy (E) of forward going projectile spectators measured in VCAL. The data were recorded with an online VCAL cut accepting the 7 and 10 most central Pb+Pb collisions for 20A - 80A GeV and 158A GeV, respectively. Using an offline cut on E, event samples of the 3.5 most central reactions were selected, which in the Glauber Monte Carlo Model corresponds to about 367 wounded nucleons and an impact parameter range of 0 b 2.8 fm glauber . To ensure better particle separation only the tracks with large track length (better energy loss resolution) in the MTPCs were used for further analysis. For this purpose we distinguish between the number of potential and the number of reconstructed dE/dx points. The former was estimated according to the position of the track in space together with the known TPC geometry, while the latter represents the number of track points reconstructed by the cluster finder algorithm. In addition, to avoid the usage of track fragments (split tracks from different TPCs which were not matched together), it is required that more than 50 of potential points have to be found by the reconstruction algorithm. The following track selection criteria, referred to as the ”loose cuts”, are used for the main analysis:
-
•
The number of reconstructed points in the MTPCs should be more than 30.
-
•
The ratio of the number of reconstructed points in all TPCs (VTPCs + MTPCs) to the number of potential points in all TPCs should exceed 0.5.
These selections reduce the acceptance of the particles to the forward rapidity regions in the center-of-mass reference frame. In order to study the systematic uncertainties of the final results due to the applied track cuts another set of cuts (”tight cuts”) was employed in addition to the ”loose cuts”:
-
•
The number of potential points in at least one of the vertex TPCs (VTPC1 or VTPC2) and in the MTPCs should be more than 10 and 30, respectively.
-
•
The ratio of the number of reconstructed points to the number of potential points in the selected TPC(s) should exceed 0.5.
-
•
The distance between the closest point on the extrapolated track to the main vertex position should be less than 4 cm in (bending plane) and less than 2 cm in (vertical).
The statistics used in this analysis, with applied ”loose cuts”, is shown in Table 1.
IV Particle identification
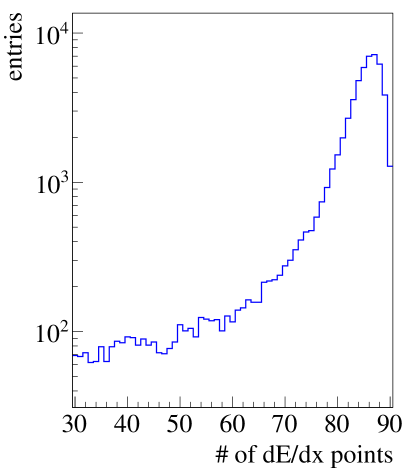
Particle identification (PID) in this analysis is achieved by correlating the measured particle momentum with its specific energy loss dE/dx in the gas volume of the MTPCs. The key problem of particle identification by dE/dx measurement is the fluctuation of ionization losses. The energy loss distribution has a long tail for large values. Its shape was first calculated in Ref. dedx_Landau and is referred to as the Landau distribution. To improve the resolution of the dE/dx measurement, multiple samplings in pad rows along the track are performed. An appropriate estimate of the dE/dx is then calculated as a truncated mean of the distribution of deposited charge measurements. To obtain the contributions of different particle species, fits of the inclusive dE/dx distributions (see Ref. dedx_Marco for details) were performed separately for negatively and positively charged particles in bins of total laboratory momentum , transverse momentum () and azimuthal angle (). Bins with less than 3000 entries were not used in the analysis to ensure sufficient statistics in each bin for the fitting algorithm. The distribution of the number of measured dE/dx points in a representative bin is illustrated in Fig. 1. As for each track the energy loss is measured multiple times, the inclusive dE/dx distribution (averaged over all events for the particular bin) for each particle type ( = p, K, , e) is represented by a weighted sum of Gaussian functions:
| (2) |
Here, is the number of tracks with dE/dx measurements, is the fitted mean energy loss (later referred to as position) of particle type , and is the width of the Gaussian distribution which depends on particle type and the number of dE/dx measurements, . The asymmetry parameter was introduced to account for the tails of the Landau distributions, which are still present even after truncation. The normalization constant in Eq.(2) is , while is parametrized as:
| (3) |
where was estimated from the data and set to 0.625 dedx_Marco .
The parameterization of the total energy loss distribution is obtained by summing the functions over the particle types:
| (4) |
with being the yield of particle in a given bin. As a result of fitting this function to the experimental dE/dx distributions one obtains in each phase space bin the yield of particle , , the ratio of mean ionization loss , the parameter , and the asymmetry parameter . The total number of fitted parameters is 2(+1) with denoting the number of particles. Obtained fit parameters, which are later used to access the dE/dx distribution functions (DFs) of different particles, are stored in a lookup table. In the case of positive particles, DFs of kaons are masked by the protons and the mean values for protons and kaons cannot be fitted uniquely. To circumvent this problem the fitting procedure was performed in two steps:
-
1.
The fitting procedure is started with negatively charged particles. As for the studied energy range the number of antiprotons is small, the pion and kaon peaks are essentially separated. Furthermore, to enhance the statistics, integration is performed over the transverse momentum bins at this stage.
-
2.
The fitting procedure is repeated separately for negatively and positively charged particles in bins of , and with the ratio fixed from step 1.
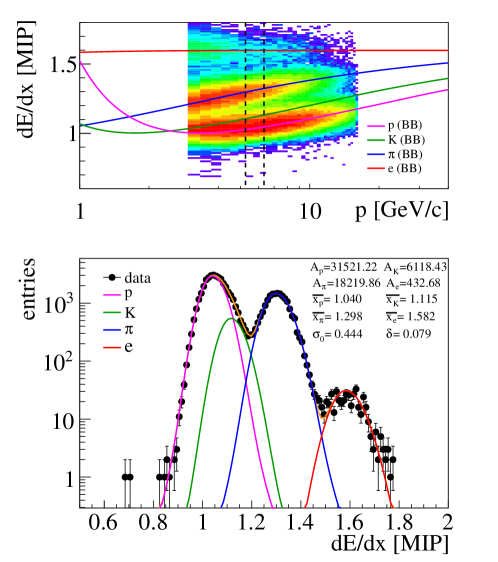
As an example, we present in the upper panel of Fig. 2 a plot of measured dE/dx values versus the reconstructed momenta. The lower panel of Fig. 2 shows the projection of the upper plot onto the dE/dx axis in the selected momentum interval indicated by dashed vertical lines. The distribution functions of different particles obtained from Eq.(2) using the fit parameters listed in the figure are displayed by colored lines.
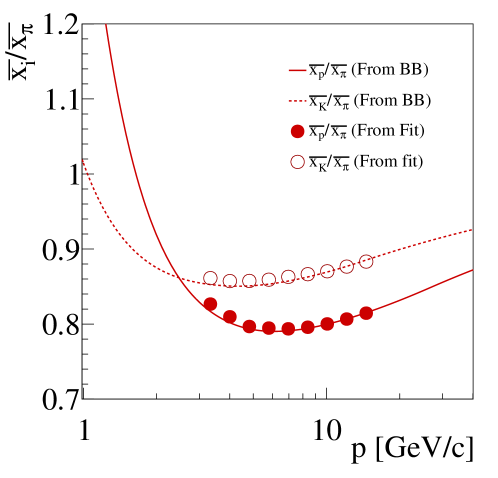
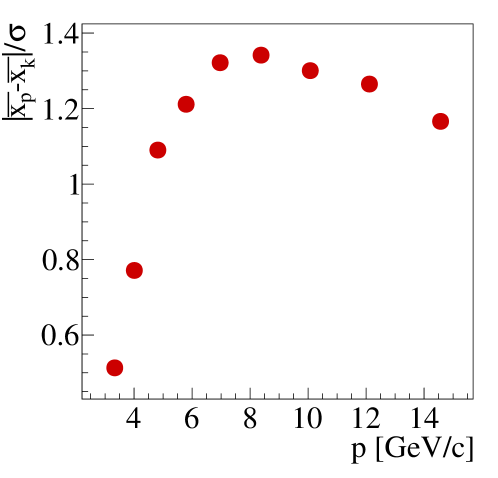
In Fig. 3 the ratios of mean energy losses of different particles are compared to the corresponding ratios from the Bethe-Bloch parameterization. Figure 4 demonstrates the separation between fitted mean energy loss values of kaons and protons quantified as with and denoting the mean energy loss values for protons and kaons respectively, and stands for . Here the ( = p, K) is calculated as:
V Analysis Method
Most measures proposed for event-by-event fluctuations are defined as functions of moments of the unknown multiplicity distributions. In particular, the fluctuation measure depends on the first and all second (pure and mixed) moments of the multiplicity distributions of the studied particles species. For example, second (pure) moment for pions and the second mixed moment for protons and pions are defined as:
| (6) |
and
| (7) |
where, is the probability distribution of pion multiplicity, while is the joint probability distribution for pion and proton multiplicities. and in Eqs. (6) and (7) stand for the pion and proton multiplicities.
The standard approach of finding the moments is to count the number of particles event-by-event. However, this approach is hampered by incomplete particle identification (overlapping dE/dx distribution functions), which can be taken care of by either selecting suitable phase space regions (where the distribution functions do not overlap) or by applying an event-by-event fitting procedure . The latter typically introduces artificial correlations which are usually corrected for by the event mixing technique. Here a novel approach, called Identity Method identity1 ; identity2 ; identity3 , is applied for the first time. The method follows a probabilistic approach which avoids the event-by-event fitting and determines the moments of the multiplicity distributions by an unfolding procedure which has a rigorous mathematical derivation identity2 . Thus there is no need for corrections based on event mixing. The method employs the fitted inclusive dE/dx distribution functions of particles, , with standing for proton, kaon, pion and electron. Each event has a set of measured dE/dx values, , corresponding to each track in the event. For each track in an event a probability was estimated of being a particle :
| 20A GeV | 30A GeV | 40A GeV | 80A GeV | 160A GeV | |
| 27.1 | 34.7 | 38.0 | 47.0 | 68.7 | |
| 30.5 | 66.4 | 103.0 | 226.7 | 414.6 | |
| 4.7 | 9.4 | 13.9 | 31.5 | 57.8 | |
| 759.94 | 1238.09 | 1475.89 | 2254.35 | 4780.52 | |
| 963.6 | 4485.36 | 10731.4 | 51764.4 | 172811.0 | |
| 26.4 | 98.06 | 207.27 | 1030.06 | 3415.69 | |
| Cov | 2.13 | 4.34 | 9.05 | 22.62 | 44.03 |
| Cov | -0.75 | -0.69 | 0.39 | 2.41 | 10.92 |
| Cov | -1.02 | -1.39 | 0.29 | 15.84 | 81.75 |
| (8) |
where the values of are calculated using the parameters stored in the lookup table of fitted DFs in the appropriate phase space bin, and
| (9) |
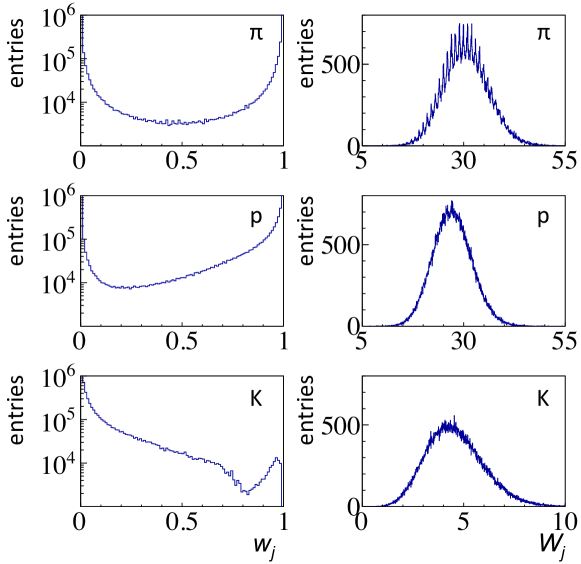
Note that the functions are just DFs normalized to the total number of events. Further an event variable (an approximation of the multiplicity of particle in the event) is defined as:
| (10) |
where is the total number of selected tracks in the given event. Examples of distributions of and for , and are shown in Fig. 5.
As the introduced quantities are calculated for each event, one obtains all second moments of the quantities by straightforward averaging over the events. Finally, using the Identity Method one unfolds the second moments of the true multiplicity distributions from the moments of the quantities identity2 . Obtained results (second moments) for the most central Pb+Pb collisions at different projectile energy are listed in the lower part of Table 2. The mean multiplicities (first moments) shown in the upper part of Table 2 are the results of integration of the respective DFs. The Identity Method has been successfully tested for numerous simulations in Ref. identity3 . A direct experimental verification of the method can be provided by investigating the energy dependence of the scaled variance of the negatively charged pion multiplicity distribution, where is
| (11) |
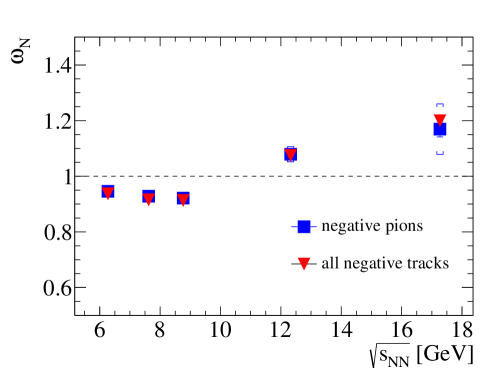
For this purpose two independent analyses were performed: (i) using the reconstructed moments for negatively charged pions (from the Identity Method) and (ii) counting the negatively charged particles event-by-event (i.e., without employing the Identity Method). The results of these analyses are presented in Fig. 6 by blue squares for case (i) and by red triangles for case (ii). As the majority of negative particles are pions the remarkable agreement between the results of these two independent approaches is a direct experimental verification of the Identity Method.
VI Statistical and systematic error estimates
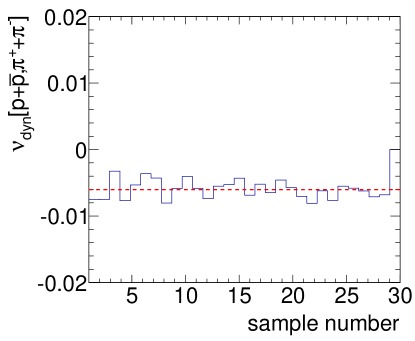
The statistical errors of the reconstructed moments of the multiplicity distributions result from the errors on the parameters of the fitted distributions and from the errors of the quantities. Typically these two sources of errors are correlated. Fluctuation observables are usually built up from several moments of the multiplicity distributions. Since the standard error propagation is impractical, the subsample approach was chosen to evaluate the statistical uncertainties. One first randomly subdivides the data into subsamples and for each subsample then reconstructs the moments listed in Table 2. In the second step the statistical error of each moment is calculated as:
| (12) |
where
| (13) |
and
| (14) |
The same procedure is followed for the fluctuation quantities, e.g., , which are functions of the moments. An example is shown in Fig. 7.
Next, systematic uncertainties of the analysis procedure are discussed. One possible source of systematic bias might be the specific choice of event and track cuts. In order to obtain an estimate of this uncertainty, results for the moments were derived for ”loose” and ”tight” cuts (see scetion III). The small observed differences were taken as one component of the systematic error.
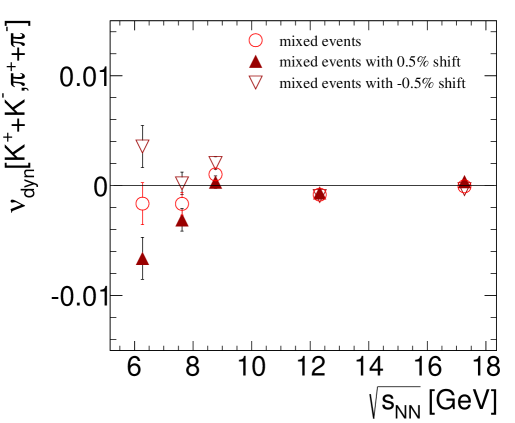
Possible biases of the identification procedure were studied using mixed events. Each event was constructed by randomly selecting a reconstructed track (including the dE/dx measurement) from each of the following events, with corresponding to the number of reconstructed tracks in the event . The results for for mixed events are presented in Fig. 8 by red open circles. As expected the reconstructed values of are vanishing independently of energy.
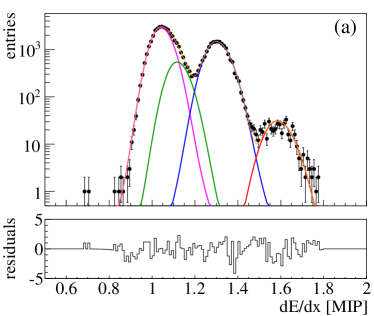
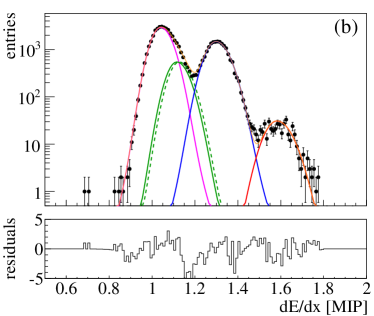
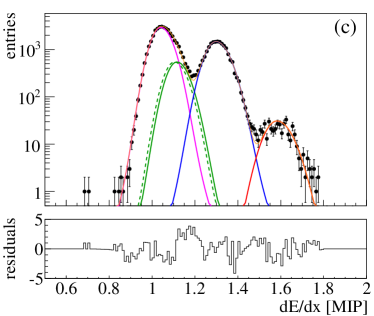
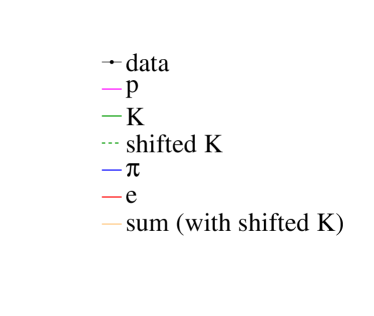
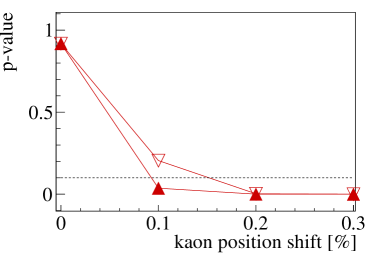
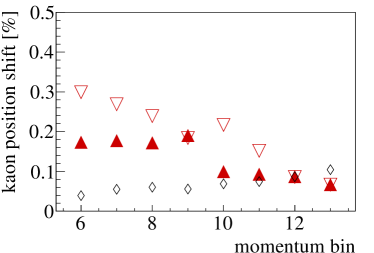
Furthermore, systematic uncertainties stemming from the quality of the fit functions were investigated with the help of mixed events. Even though the 2-step fitting procedure discussed in section IV was used to determine the DFs, it remains a challenge to properly fit the kaon positions. In nearly all relevant phase-space intervals the measured energy loss distributions of kaons are overlapping with those of pions and protons. To study the influence of possible systematic shifts in fit parameters on the extracted moments, the fitted positions of kaons were shifted artificially by 0.5 in both directions. The dashed-green lines in Fig. 9 show the artificially shifted dE/dx distribution functions of kaons. Results for obtained with these shifted kaon distribution functions for the mixed events are plotted as red triangles in Fig. 8. At lower beam energies one observes a significant dependence of the results on kaon positions. In order to gain quantitative estimates of a possible shift of the kaon position, we performed hypothesis testing using the Kolmogorov-Smirnov (K-S) statistics. For this purpose we test the null hypothesis that measured dE/dx distributions and fit functions are similar within a given significance level of 10 . We repeat the test by shifting the fitted kaon positions in both directions. The obtained results from the K-S test in a selected phase space bin are presented in the left panel of Fig. 10 for the 30A GeV data. The maximum value of the kaon position shift is taken to be the abscissa of the intersection point of the red lines with the dashed line. We conclude that with a 10 significance level the null hypothesis is rejected for 0.09 and 0.15 up and down shifts correspondingly. In the right panel of Fig. 10 the dependence of the kaon position shift is presented as function of the momentum bin in a selected bin of transverse momentum and azimuthal angle. The shift values for all other phase space bins were obtained in a similar way. Emerging systematic errors on the fluctuation measure , added in quadrature with other sources of systematics, are depicted in Fig. 11 by the shaded bands (see the next section).
VII Results on the fluctuation measure
| 20A GeV | -6.139 | 0.243 | |
|---|---|---|---|
| 30A GeV | -5.282 | 0.191 | |
| 40A GeV | -5.058 | 0.125 | |
| 80A GeV | -4.361 | 0.134 | |
| 160A GeV | -2.706 | 0.329 | 0.025 |
| 20A GeV | 6.503 | 2.226 | |
|---|---|---|---|
| 30A GeV | 2.210 | 1.122 | |
| 40A GeV | -0.949 | 0.759 | |
| 80A GeV | -2.498 | 0.587 | |
| 160A GeV | -2.135 | 0.460 | 0.001 |
| 20A GeV | 11.738 | 2.207 | |
|---|---|---|---|
| 30A GeV | 5.651 | 0.943 | |
| 40A GeV | 3.41816 | 0.485 | |
| 80A GeV | 1.564 | 0.322 | |
| 160A GeV | 1.523 | 0.257 | 0.139 |
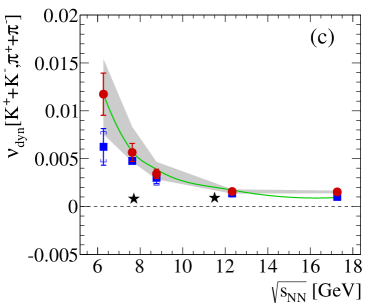
The measure of dynamical event-by-event fluctuations of the particle composition is defined as voloshin_nu :
| (15) |
where A and B stand for multiplicities of different particle species. As seen from the definition, Eq.(15), the value of vanishes when the multiplicity distributions of particles A and B follow the Poisson distribution and when there are no correlations between these particles (). On the other hand, a positive correlation term reduces the value of , while an anticorrelation increases it. Inserting the values of the reconstructed moments (see Ref. EDMS for precise values) into Eq.(15) one obtains the values of , and . These results are represented by red solid circles in Fig. 11. Statistical errors were estimated using the subsample method discussed in section VI. Systematic uncertainties due to the applied track selection criteria were estimated by calculating separately for tracks selected by ”loose” () and ”tight” () cuts, while the systematic errors stemming from the uncertainty of the kaon fit were estimated using the K-S test (see section III). The shift values of the fitted kaon positions, obtained from the K-S test for each phase-space bin, were used to obtain the values of and . Final results (red solid circles in Fig. 11) are then presented as:
| (16) |
the statistical errors are estimated using the Eq. 12, while the systematic errors, presented with shaded areas in Fig. 11 are calculated as:
| (17) |
with k=(up, down).
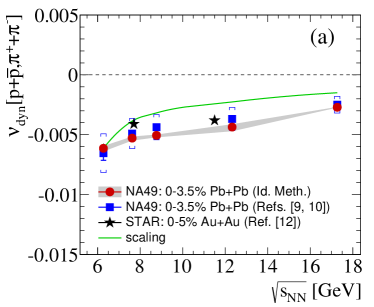
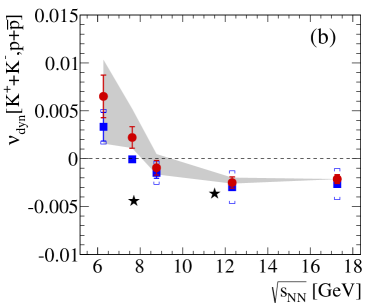
These results (see Fig. 11 and Tables 3, 4 and 5) are consistent with the values of obtained via Eq. 1 from the previously published NA49 measurements of the related measure NA49_fluct1 ; NA49_fluct2 (blue squares in Fig. 11). Note that the source of systematic errors due to the uncertainties in kaon position were not considered in previously published NA49 results, hence the presented systematic errors (blue horizontal bars) were underestimated. We thus conclude that the increasing trend of the excitation functions of and towards low energies is confirmed by two independent analyses of the NA49 data on central Pb+Pb collisions. Also presented in Fig. 11 are the STAR results (black stars) from the RHIC Beam Energy Scan (BES) program STAR_fluct for central Au+Au collisions, which clearly differ at low energies. However, as mentioned above, the phase space coverage of NA49 and STAR are not the same. The consequences will be discussed below.
VIII Phase space dependence of measurements
The investigation presented in this section attempts to shed light on the cause of the differences between the results from STAR and NA49 on fluctuations of identified hadrons. Two sources were studied: the dependence of on the multiplicity of the particles entering the analysis and a possible sensitivity of to the covered phase space region.
Indeed, it was found in Ref. Tim_Volker that exhibits an intrinsic dependence on the multiplicities of accepted particles. Since multiplicities increase with increasing collision energy, this leads to a trivial energy dependence of :
| (18) |
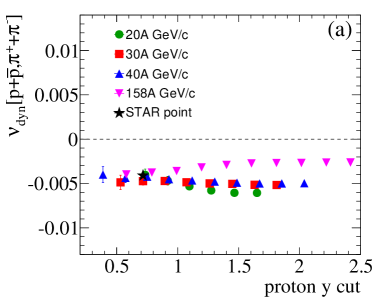
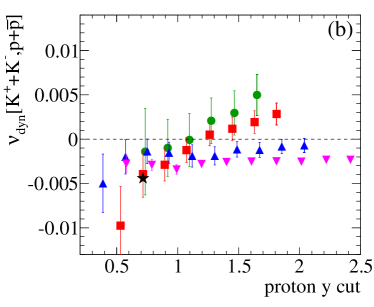
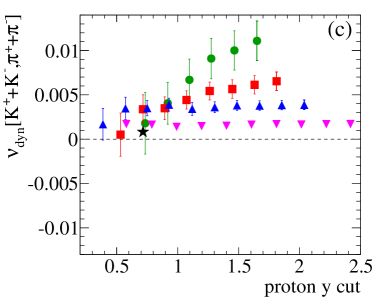
where is the energy at which the reference value of was chosen and the denotes the energy at which the value of is estimated. The energy dependence predicted by Eq.(18), with a reference energy of 6.3 GeV (corresponding to 20 GeV laboratory energy), is illustrated for and in Fig. 11(a and c) by the green curves. However, this scaling prescription cannot reproduce the sign change observed for the energy dependence of as shown in Fig. 11(b). Moreover, using the multiplicities of Table 2 and the corresponding numbers for the STAR experiment Tarnowsky_private one would expect only about a factor 2 decrease of the value of at GeV which does not lead to agreement with the STAR result.
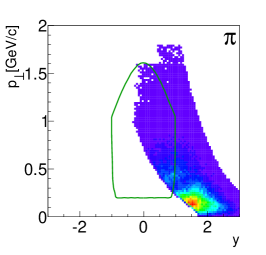
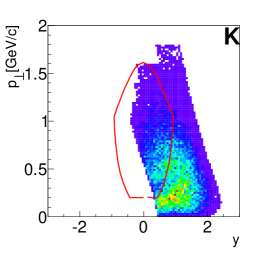
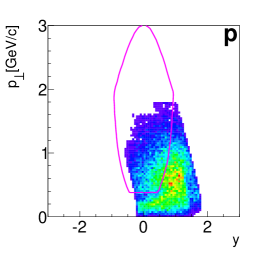
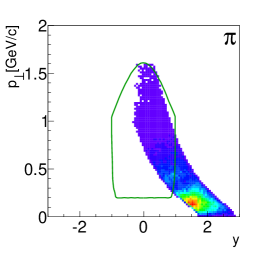
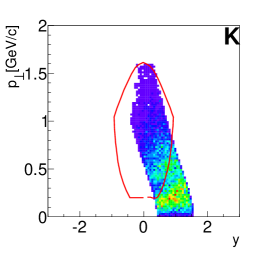
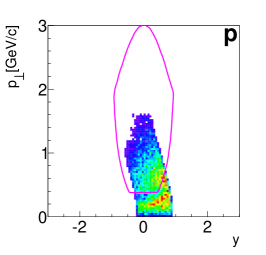
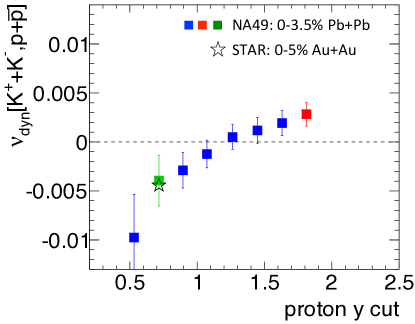
Next, the sensitivity of to the covered regions of phase space will be studied since these differ for the NA49 and STAR measurements. As an example Fig. 12 illustrates the phase space coverage for pions, kaons and protons at 30 GeV projectile energy in the acceptance of the NA49 detector. In the same figure the acceptance of the STAR apparatus at corresponding center-of-mass energy is presented by colored lines. The dependence of on the selected phase space region was studied by performing the analysis in different phase space bins stretching from a forward rapidity cut to mid-rapidity. Technically different phase space bins were selected by applying upper momentum cuts to the reconstructed tracks where the cut value corresponded to the momentum of a proton at =0 with a chosen maximum rapidity. Thereafter this quantity will be called a proton rapidity cut. The upper panels of Fig. 12 illustrate one such phase space bin for 30A GeV Pb+Pb data. The reconstructed value of in this bin is plotted as a red square in Fig. 13. Similarly the green square in Fig. 13 represents the reconstructed value of corresponding to the phase space bin plotted in the lower panel of Fig. 12. Note that in this particular bin the NA49 point is consistent with the STAR result, which is shown by the purple star. This study demonstrates a strong dependence of the resulting value of on the phase space covered by the measurement. Fig. 14 shows the dependence of for different combinations of particles at different energies. At 20A and 30A GeV and show a strong dependence on the extent of the phase space region and eventually hit the STAR point in a particular bin. Interestingly the acceptance dependence weakens above 30A GeV where no difference was observed with STAR. It is also remarkable that shows little dependence on the covered phase space region. This detailed study of in different phase space regions appears to explain to a large extent the difference between the STAR BES and NA49 measurements.
Some final remarks are in order concerning the properties and the significance of the fluctuation measure . To reveal the physics underlying the studied event-by-event fluctuations, the fluctuation signals measured in heavy-ion (A+A) collisions should be compared systematically to a reference from nucleon-nucleon (N+N) collisions at corresponding energies per nucleon. It is however important to properly take into account trivial differences between A+A and N+N collisions e.g. in the size of the colliding systems. An additional complication in the experimental study of fluctuations in A+A collisions are unavoidable volume fluctuations from event to event. To take account of these considerations a set of ”strongly intensive” fluctuation measures has been proposed in Ref. S_I . In fact, the scaled (see Eq.(18)) is related to the strongly intensive measure (cf. Eq.(13) in Ref. S_I ):
| (19) |
Future studies of strongly intensive measures may lead to a better understanding of the underlying source of correlations.
IX Summary
In summary several scenarios were investigated to understand the differences between the NA49 and STAR measurements of the excitation functions of and . For this purpose the particle identification procedure formerly employed by NA49 was replaced by a different approach, the Identity Method, to reconstruct the fluctuation measure . The increasing trend of and towards lower energies reported in previous publications of NA49 in terms of the quantity was confirmed by this analysis. A detailed study of reveals a strong dependence on the phase space coverage at low energies for and which might explain the different energy dependences measured by NA49 (central Pb+Pb collisions) and STAR (BES program for central Au+Au collisions). As an outlook it is worth mentioning that since the Identity Method reconstructs first and second moments of the multiplicity distributions of identified particles one will be able to investigate the energy dependence of all the fluctuation measures proposed in Ref. S_I . These quantities are better suited for phase transition studies because (within the grand canonical ensemble) they depend neither on the volume nor on its fluctuations which cannot be tightly controlled in experiments.
Acknowledgments: This work was supported by the US Department of Energy Grant DE-FG03-97ER41020/A000, the Bundesministerium fur Bildung und Forschung (06F 137), Germany, the German Research Foundation (grant GA 1480/2.1), the National Science Centre, Poland (grants DEC-2011/03/B/ST2/02617 and DEC-2011/03/B/ST2/02634), the Hungarian Scientific Research Foundation (Grants OTKA 68506, 71989, A08-77719 and A08-77815), the Bolyai Research Grant, the Bulgarian National Science Fund (Ph-09/05), the Croatian Ministry of Science, Education and Sport (Project 098-0982887-2878) and Stichting FOM, the Netherlands.
References
- (1) J. C. Collins and M. J. Perry, Phys. Rev. Lett. 34, 1353 (1975).
- (2) E. V. Shuryak, Phys. Rept. 61, 71 (1980), Phys. Rept. 115, 151 (1984).
- (3) for recent results see: C. Schmidt (RBC-Bielefeld and HotQCD Collaborations), Nucl. Phys. A820, 41c (2009); Z. Fodor and S. Katz (Wuppertal Collaboration), Acta Phys. Pol. B42, 2791 (2011).
- (4) M. Stephanov, Int. J. Mod. Phys. A20, 4387 (2005).
- (5) M. Stephanov, K. Rajagopal and E. Shuryak, Phys. Rev. D60, 114028 (1999).
- (6) V. Koch, arXiv:0810.2520 (2008).
- (7) U. Heinz and M. Jacob, arXiv:nucl-th/0002042 (2000).
- (8) M. Gazdzicki and M. Gorenstein, Acta Phys. Pol. B30, 2705 (1999).
- (9) C. Alt et al. (NA49 Collab.), Phys. Rev. C77, 024903 (2008).
- (10) A. Rustamov, Central Eur. J. Phys. 10, 1267-1270 (2012), arXiv:1201.4520v1 [nucl-ex] (2012).
- (11) C. Alt et al. (NA49 Collab.), Phys. Rev. C79, 044910 (2009).
- (12) T. Anticic et al. (NA49 Collab.) Phys. Rev. C83, 061902(R) (2011).
- (13) T. Anticic et al. (NA49 Collab.), Phys. Rev. C87, 024902 (2013).
- (14) C. Pruneau, S. Gavin, S. Voloshin, Phys. Rev. C66, 044904 (2002).
- (15) T. Tarnowsky (STAR Collab.) J. Phys. G: Nucl. Part. Phys. 38 124054 (2011).
- (16) M. Gazdzicki et al., Phys. Rev. C83, 054907 (2011).
- (17) M. I. Gorenstein, Phys. Rev. C84, 024902 (2011).
- (18) S. Afanasiev et al. (NA49 Collab.), Nucl. Instrum. Meth. A430, 210 (1999).
- (19) K. J. Eskola, K. Kajantie and J. Lindfors, Nucl. Phys. B323, 37 (1989)
- (20) L. Landau, Journal of Physics (USSR), vol. 8, p. 201 (1944).
- (21) M. van Leeuwen, PhD thesis, NIKHEFF, Amsterdam (2003), CERN EDMS Id 816033; NA49 technical notes G. Veres, CERN EDMS Id 815871 (2000), M. van Leeuwen, CERN EDMS Id 983015.
- (22) https://edms.cern.ch/file/1311963/1/NA49_paper_moments.pdf.
- (23) A. Rustamov, M. I. Gorenstein, Phys. Rev. C86, 044906 (2012).
- (24) V. Koch and T. Schuster, Phys. Rev. C81, 034910 (2010).
- (25) T. Tarnowsky (STAR Collab.), private communication.
- (26) M. I. Gorenstein and M. Gazdzicki, Phys. Rev. C84, 014904 (2011).