Near-infrared spectroscopic and photometric evolution of Nova V476 Scuti - a nova that formed optically thin dust–LABEL:lastpage
Near-infrared spectroscopic and photometric evolution of Nova V476 Scuti - a nova that formed optically thin dust
Abstract
We present results of near-infrared (near-IR) (1.07 - 2.5 m) spectroscopic and photometric observations of Nova V476 Scuti (V476 Sct) which was discovered in outburst in 2005 September. The near-IR observations of the nova presents the evolution of the post-maxima spectra and near-IR light curve. The spectra of V476 Sct, observed on 9 different epochs, show prominent lines due to HI, OI, CI and NI. Based on the IR spectral signatures we independently identify it as a Fe II type of nova, consistent with the same classification obtained from optical spectra. A detailed identification of the observed spectral lines is presented. The near-IR light curve extending for a period of about 59 days after outburst clearly shows the formation of a optically thin dust shell, a phenomenon which is not commonly observed in novae. By fitting black body curves to the spectral energy distributions (SEDs) the temperatures of the dust shell on different epochs have been estimated. Dust formation in V476 Sct is consistent with the presence of lines of elements with low-ionization potential like Na and Mg in the early spectra which had earlier been suggested by us to be potential indicators of dust formation at a later phase in a nova’s development.
keywords:
infrared: stars – line: identification – stars: novae, cataclysmic variables – stars: individual: V476 Sct – techniques: spectroscopic – techniques: photometric1 Introduction
Nova V476 Scuti (V476 Sct) was discovered in outburst towards the end of September 2005 independently by several observers. Takao (2005) reported its presence (mag 10.3) on an unfiltered CCD image taken on September 30.522 UT. Yamaoka (2005), reported that the new object appeared at a magnitude of about 10 on ASAS-3 images taken on September 28.088 and October 1.025, but was not present on September 24.629 (limiting mag perhaps 13). This implies that the object was caught early in its outburst. Independent discoveries of the object at magnitude about 10.9 was also made by Haseda (2005) from photographs taken on September 30.417 and 30.422 and also by Gilmore & Kilmartin (2005) from short unfiltered CCD exposures taken on October 1.393 showing the new object at mag 10.0. However, for the present purpose we assume that September 30.522 UT is the outburst day. Gilmore & Kilmartin (2005) provide precise coordinates for the nova ( = 18h 32m 04.75s, = - 0.6∘ 43′ 34′′) with an accuracy of 0.1′ and show that a comparison with a Digitized Sky Survey (DSS) red plate from 1988 August 10 presents no obvious precursor at the nova’s position though a star of red mag 17.9 lies slightly to the east of the nova.
A low-resolution spectrogram (range 550-1050 nm) was obtained on October 6.36 UT by Kiss et al. (2005), showing that V476 Sct had a spectrum typical of a classical nova. Strong emission lines of hydrogen, oxygen, calcium, magnesium, carbon, and iron were identified with H having a symmetric profile with FWZI exceeding 4000 km s-1. The strongest emission lines seen include H, the Oi 777.3, 844.6, and 926.4 nm lines, members of the hydrogen Paschen series, the infrared (IR) Ca triplet, and the Ci 940.6 nm line, all with FWZI greater than 2000 km s-1. The authors remark that the overall spectral appearance is similar to that of the Fe II nova V443 Sct (N Sct 1989), two weeks after its maximum (Williams et al. 1991). CCD photometry and spectroscopy were also done by Munari et al. (2006) who showed it to be a fast nova, characterized by = 15 and = 28 d and affected by an E(B-V) 1.9 magnitude reddening. From an MMRD (maximum magnitude vs. rate of decline) analysis they estimate the distance to the nova to be is 41 kpc, and its height above the Galactic plane to be z = 8020 pc. They classified the nova as belonging to the Fe II type. The classification is consistent with the theoretical result obtained by Hachisu Kato (2007). Their model light curve generated for CO nova 2 ( = 0.35, , = 0.02) nicely fitted with the observed visual and V magnitudes. From this model calculation the mass of white dwarf in nova V476 Sct was estimated to be 0.950.05 .
The only IR study of the object was done by Perry et al. (2005) who obtained 0.47- to 2.5-m spectroscopy of V476 Sct on November 15.108 UT. The nova was still quite early in its spectral development, showing structured emission in the lines of Ci, Ni, and Feii with FWHM of 1600 km s-1. Hei lines were just emerging and were still very weak. The strongest lines in the visible and IR spectrum were from Oi, and these are produced almost completely by Lyman fluorescence. The authors estimate the reddening as indicated by the Oi lines to be E(B-V) = 2.0. In the X-ray regime, no super soft X-ray phase was detected from the source and only an upper limit could be placed (Ness et al. 2007).
In this study we present near-infrared (near-IR) spectra of the object taken during the early decline and analyze their general properties. We also present near-IR photometric coverage of the object that shows the development of a dust shell around the nova. Although novae are known to form dust, the distinguishing characteristic of the dust shell in V476 Sct is that it is optically thin. The present study presents an example, not too often encountered in the literature, of the IR development of such an optically thin dust shell.
| Date UT | Days since | Magnitudes | ||
|---|---|---|---|---|
| (2005) | outburst | |||
| 06.664 Oct | 6.14 | 7.24 0.06 | 6.53 0.04 | 6.02 0.12 |
| 11.615 Oct | 11.09 | 7.80 0.09 | 7.06 0.09 | 6.77 0.12 |
| 12.611 Oct | 12.09 | 7.85 0.07 | 7.35 0.04 | 7.05 0.10 |
| 15.692 Oct | 15.17 | 8.06 0.06 | 7.78 0.16 | 7.34 0.50 |
| 16.688 Oct | 16.17 | 8.24 0.08 | 7.73 0.11 | 6.82 1.14 |
| 20.634 Oct | 20.11 | 8.28 0.11 | 7.07 0.03 | 6.18 0.06 |
| 25.645 Oct | 25.12 | 8.37 0.06 | 7.09 0.07 | 5.75 0.13 |
| 26.587 Oct | 26.07 | 8.29 0.04 | 7.01 0.03 | 5.69 0.04 |
| 07.572 Nov | 38.05 | 8.78 0.06 | 6.72 0.08 | 5.02 0.03 |
| 08.607 Nov | 39.09 | 8.64 0.19 | 6.51 0.02 | 5.02 0.06 |
| 14.588 Nov | 45.07 | 9.20 0.09 | 6.98 0.04 | 5.25 0.04 |
| 17.592 Nov | 48.07 | 9.52 0.03 | 7.18 0.04 | 5.40 0.02 |
| 24.572 Nov | 55.05 | 10.10 0.05 | 7.59 0.08 | 5.66 0.08 |
| 01.564 Dec | 62.04 | 11.39 0.52 | 8.70 0.25 | 6.15 0.14 |
| 02.562 Dec | 63.04 | 11.54 0.35 | 8.70 0.14 | 6.33 0.16 |
| Date | Days | Integration time | |||
|---|---|---|---|---|---|
| 2005 | since | (sec) | |||
| (UT) | outburst | J | H | K | |
| Oct 5.666 | 5.876 | 40 | 40 | 60 | |
| Oct 6.618 | 6.826 | 120 | 120 | 120 | |
| Oct 11.669 | 11.877 | 120 | 120 | 120 | |
| Oct 15.610 | 12.798 | 180 | 180 | 180 | |
| Oct 16.623 | 15.820 | 60 | 45 | 60 | |
| Oct 19.621 | 16.832 | 60 | 60 | 60 | |
| Oct 21.618 | 19.831 | 200 | 200 | 200 | |
| Oct 25.593 | 21.830 | 300 | 300 | 300 | |
| Nov 03.591 | 34.802 | 300 | 300 | 300 |
2 Near-IR Mount Abu observations
The near-IR spectroscopic and photometric observations of V476 Sct were carried out from
1.2m Mount Abu telescope, operated by the Physical Research Laboratory.
The spectra were
obtained at similar dispersions of 9.5 Angstrom/pixel in each of the
bands using the Near-Infrared Imager/Spectrometer which uses a
256256 HgCdTe NICMOS3 array. A set of two spectra were
taken with the object dithered to two positions along the slit which were subtracted from each other to
eliminate the sky contribution and the detector dark counts. The
spectra were then extracted using APEXTRACT package in IRAF and wavelength calibration was
done using a combination of OH sky lines and telluric lines that
register with the stellar spectra. Following the standard procedure,
the object spectra were then ratioed with the spectra of a comparison
star (SAO 143021; spectral type B9V; = 3.427) observed at similar airmass as the object and from whose spectra
the Hydrogen Paschen and Brackett absorption lines had been removed. The ratioed spectra were then multiplied by a blackbody curve at the effective temperature of the comparison star to yield the final spectra. Though the ratioing process removes the telluric features
sufficiently well, some residuals are still left in the wavelength regions where
telluric absorption is strong. This applies significantly to the regions around 1.12 m in the band
and between 2 to 2.05 m in the band. Hence care should be taken while interpreting any feature appearing in these regions.
Photometry in the bands was done under photometric sky conditions using the imaging mode of the NICMOS3 array. Several frames, at five dithered positions offset typically by 20 arcsec, were obtained of both the nova and a selected standard star (SAO 162177) in each of the filters. Near-IR magnitudes were then derived using APPHOT package in IRAF tasks following the regular procedure followed by us for photometric reduction (e.g. Banerjee & Ashok 2002; Naik et al. 2010). The log of the photometric and spectroscopic observations are given in Tables 1 and 2 respectively. We could not extend our observations beyond early December because the object had at that stage begun to approach conjunction with the Sun.

3 Results
3.1 General characteristics of the near-IR spectra
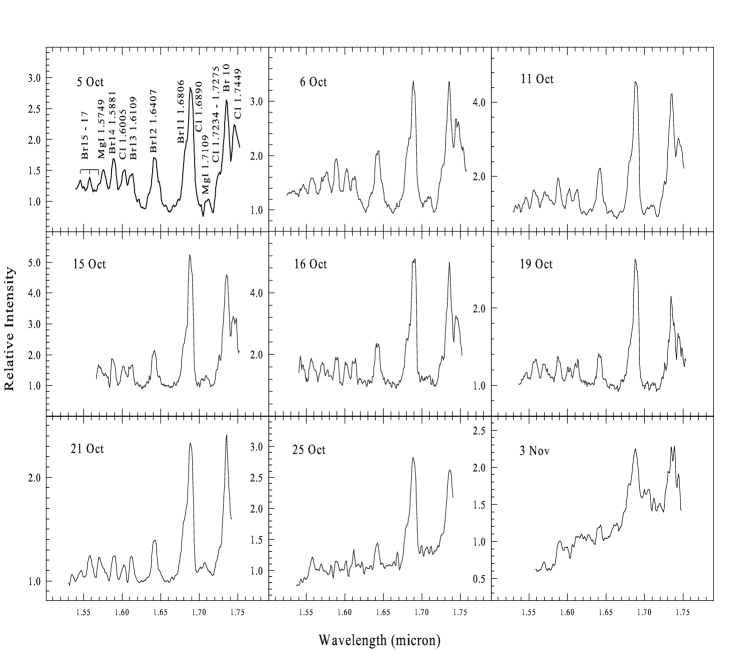
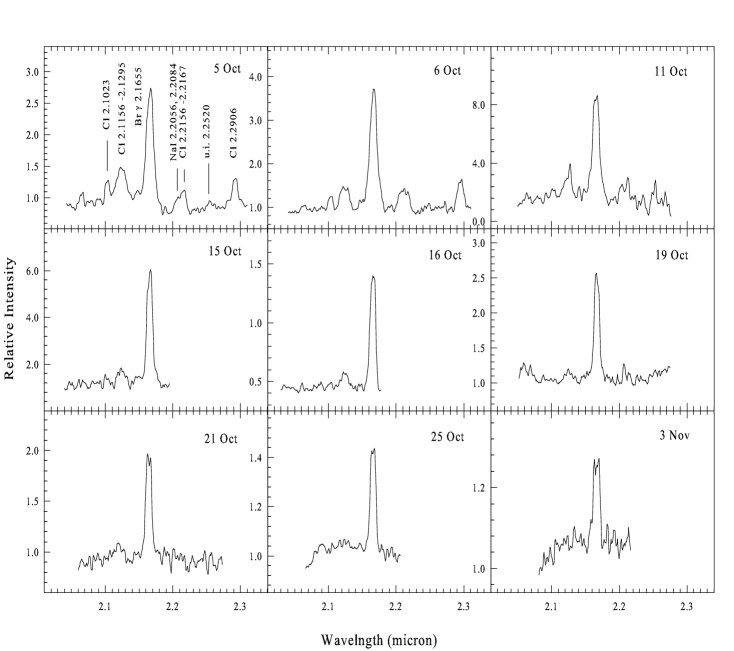
The mosaics of , and band spectra of V476 Sct observed on 9 different epochs are presented in Figs. 1, 2 and 3 respectively. Prominent lines are marked on the Figures. In addition to the strong lines due to Hi, Oi, Ci and Ni as marked on Figs. 1, 2 and 3, weaker features may also be seen when the spectra are magnified. A detailed list of the lines is presented in Table 3. The early spectra of V476 Sct display the typical IR signatures which are expected of a FeII nova. In addition to lines of H, N and O, these novae show strong lines of carbon e.g. in the band in the 1.16 to 1.18 m wavelength region and in the band in the spectral region around Br 10 at 1.73 m and further redwards. These Ci lines are strongly seen in the spectra presented here. In contrast, such carbon lines are absent or very weak in the spectra of He/N novae e.g. in the novae V597 Pup and V2491 Cyg (Naik et al. 2009). A detailed paper showing the IR classification of novae spectra and the differences between FeII and He/N novae is given in Banerjee & Ashok (2012). The FeII nova classification, independently arrived at from the IR spectra, is consistent with its optical classification as a FeII type nova. Examples of similar IR spectra of FeII novae may be seen in V1280 Sco (Das et al. 2008) and V2615 Oph (Das et al. 2009), V2274 Cyg (Rudy et al. 2003), V1419 Aql (Lynch et al. 1995) and V5579 Sgr (Raj et al. 2011)
The most prominent lines in the spectra of V476 Sct are the Paschen and Brackett hydrogen recombination lines. The average FWHM (full width at half maxima) of Pa and Br are respectively 1529 km s-1 and 1425 km s-1 which yields the expansion velocity 738 km s-1. This result is in line with the value of 600 km s-1 estimated from the optical data (Munari et al. 2006). The Oi line at 1.1287 is very strong compared to the continuum fluoresced Oi 1.3164 m indicating that Lyman fluorescence significantly contributes to the strength of Oi 1.1287. We do not see signs of any Hei lines which is consistent with the report of Perry et al. (2005) that Hei lines were just emerging and were still very weak even on 2005 November 15.
The region between 1.2 to 1.275 m contains the complex blend of a large number of Ni and Ci lines that are often seen in the early spectra of FeII novae. The presence of lines of Nai at 2.2056 and 2.2084 m are worth noting as it may be inferred, from their presence, that dust will form in a nova. During the analysis of V1280 Sco, one of the conclusions that emerged, was that the lines of Nai particularly are associated with low excitation and ionization conditions (Das et al. 2008). Such conditions necessarily imply the existence of a cool zone which is conducive for dust formation. Such regions could be associated with clumpiness in the nova ejecta which likely provide the cool dense sites needed for molecule and dust formation. From our earlier studies (Banerjee Ashok, 2012) we have observed that whenever these lines are seen, dust did indeed form in the nova. Examples of such novae which showed these lines and simultaneously formed dust are V2274 Cyg (Rudy et al. 2003), V1419 Aql (Lynch. et al. 1995), NQ Vul (Ferland et al. 1979), V705 Cas (Evans et al. 1996), V842 Cen (Wichmann et al. 1991), V1280 Sco (Das et al. 2008), V5579 Sgr (Raj et al. 2011) and V496 Sct (Raj et al. 2012). The presence of these lines in V476 Sct, and the dust formation witnessed subsequently, is consistent with this scenario. In addition to the presence of the Na and Mg lines, it is possible that there are other parameters which influence and correlate with dust formation (see for e.g. Gehrz 1988; Bode & Evans 2008 and references therein). However a detailed discussion or review of all such parameters is beyond the scope of this work. We are also unable to comment whether CO formed in this nova, as it did for e.g. in V2615 Oph (Das et al. 2009) and V496 Sct (Raj et al. 2012 and references therein), because our band spectra do not extend much beyond 2.29 m where the CO first overtone bands are expected.
| Wavelength | Species | Other contributory | Wavelength | Species | Other contributory |
|---|---|---|---|---|---|
| (m) | species/ remarks | (m) | species/ remarks | ||
| 1.0938 | Pa | 1.5749 | Mgi | Mgi 1.5741, 1.5766, | |
| 1.1190 | Nai | & Ci 1.5784 | |||
| 1.1287 | Oi | 1.5881 | Br 14 | Ci 1.5853 | |
| 1.1330 | Ci | 1.6005 | Ci | ||
| 1.1381 | Nai | Ci 1.1373 | 1.6109 | Br 13 | |
| 1.1404 | Nai | Ci 1.1415 | 1.6335 | Ci | |
| 1.1600-1.1674 | Ci | strongest lines | 1.6419 | Ci | |
| at 1.1653, 1.1659, | 1.6407 | Br 12 | Ci lines between | ||
| 1.16696 | 1.6806 | Br 11 | 1.6335-1.6505 | ||
| 1.1748-1.1800 | Ci | strongest lines | 1.690 | Ci | |
| at 1.1748, 1.1753, | 1.7045 | Ci | |||
| 1.1755 | 1.7109 | Mgi | |||
| 1.1828 | Mgi | 1.7234 - | Ci | Several Ci lines | |
| 1.1819-1.1896 | Ci | strongest lines at | 1.7275 | in this region | |
| 1.1880, 1.1896 | 1.7362 | Br 10 | Ci 1.7339 | ||
| 1.1949 | u.i | 1.7449 | Ci | ||
| 1.2074,1.2095 | Ni | Ci 1.2088 | 2.1023 | Ci | |
| 1.2187,1.2204 | Ni | 2.1156 - | Ci | strongest lines at | |
| 1.2249,1.2264 | Ci | 2.1295 | 2.1156, 2.1191, | ||
| 1.2329 | Ni | 2.1211, 2.1260, | |||
| 1.2382 | Ni | and 2.1295 | |||
| 1.2461,1.2469 | Ni | Oi 1.2464 | 2.1452 | Nai | |
| 1.2562,1.2569 | Ci | Oi 1.2570 | 2.1655 | Br | |
| 1.2601,1.2614 | Ci | 2.2056 | Nai | ||
| 1.2818 | Pa | 2.2084 | Nai | ||
| 1.2950 | Ci | 2.2156 - | Ci 2.2156, | ||
| 1.3164 | Oi | 2.2167 | 2.2160, 2.2167 | ||
| 1.5439 | Br 17 | 2.2520 | u.i | ||
| 1.5557 | Br 16 | 2.2906 | Ci | ||
| 1.5685 | Br 15 |
3.2 Dust formation
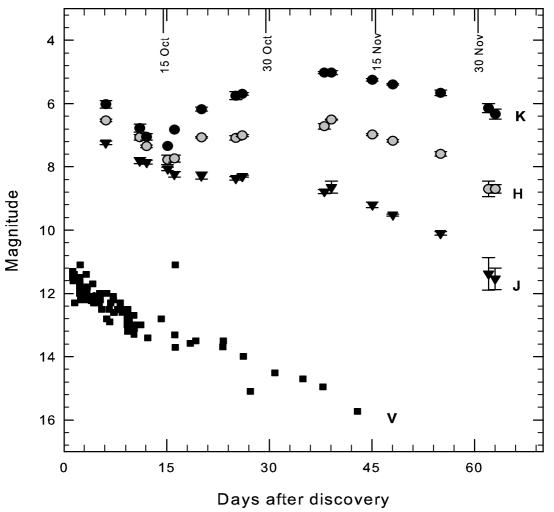
The near-IR lightcurve along with the optical lightcurve of V476 Sct is presented in Fig. 4. The near-IR observations were made using Mt Abu telescope and the optical V band data are from AAVSO and AFOEV. The near-IR magnitudes were corrected for extinction using Koornneef’s (1983) relations and AV = 5.89 mag. The value of AV was calculated assuming E(B - V) = 1.9 as estimated by Munari et al. (2006). Our IR observations show a steady decline in brightness till October 15 ( 15 days after discovery). At this stage each of the magnitudes show an increasing trend indicating the onset of dust formation. However, no corresponding sharp decline in the optical light curve is seen at this stage implying that any dust, that may have formed, is optically thin. Such kind of dust formation was observed earlier in few novae, for example V1668 Cyg (Gehrz et al. 1980), Nova Aql 1995 (Mason et al. 1996; Kamath et al. 1997) and Nova LMC 1988 1 (Schwarz et al. 1998). In V1668 Cyg dust formed in between days 30 - 60 after outburst and reached a visual optical depth 0.1 around 60 days after outburst; in Nova Aql 1995 dust formed shortly (about 9 days) after discovery and in Nova LMC 1988 1 the presence of dust which lasted for about 2 months, was detected 55 days after visual maximum. In all these novae no ”dip” in the optical light curve was observed which is generally observed in the visual light curve of optically thick dust forming novae, for example V1280 Sco (Das et al. 2008), V705 Cas (Evans et al. 1997), as the optical photons are absorbed by the dust shell. The reason for finding optically thin dust is probably the clumpiness of the dust shell so that the most of the shorter-wavelength radiation passes through the gaps. Verification of such clumpiness may be sought by expecting more structures in the line profiles; structures caused by individual clumps having different brightness and kinematic velocities. However the spectral resolution of the present data of 1000 is too low to discern or to be certain of the presence of such structures. An alternate reason for optically thin dust could be formation of less number of grains which is not sufficient to cover the entire solid angle along the line of sight of the observer. Though the observational data is unable to point out the exact reason for such optically thin dust formation, sometimes the clumpiness can be inferred from visual observations of old novae (Gehrz 1988).
We have attributed the steady brightening of the fluxes after October 15 to the onset of dust formation. The increase in the NIR fluxes being due to an increase in emission line strengths is also a possibility but extremely unlikely for the following reasons. Using IRAF, we estimate that the combined line flux of all lines in a band is typically 10 percent of the total broad-band flux in that band. Thus for example, one can consider what would happen if the band brightening by 2 magnitudes ( corresponding to a flux increase by a very large factor factor of 6.25) between 15 October and 3 November were completely due to band lines (primarily Br ) becoming stronger while the continuum strength remained constant (i.e. no contribution from dust formation to the continuum took place). In such a case the lines would have to necessarily become extremely strong and the signal at the line peak, compared to the continuum value, would have to become much stronger that earlier (we estimate a factor of 5 to 10 increase in the peak-to-continuum ratio for most lines). Such behavior is just not seen in the present data. On the other hand, as we discuss in the next paragraph, the observed increase in the IR fluxes are very typical of the behavior associated with the onset of dust formation.
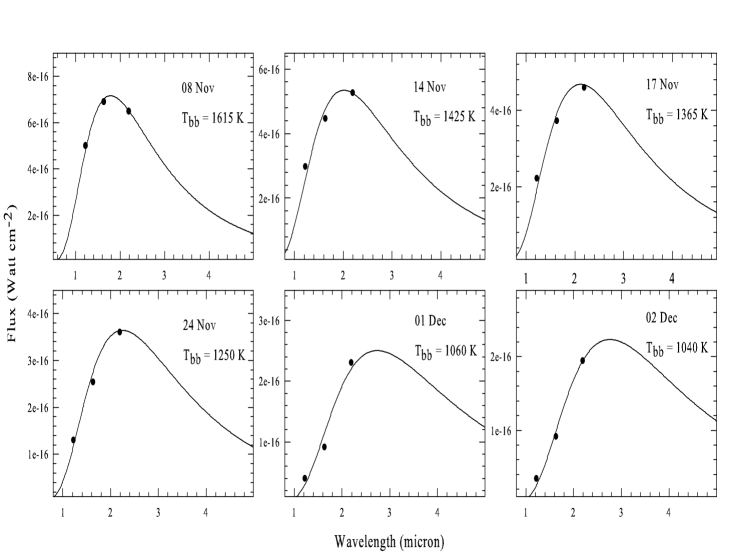
In case of V476 Sct we have studied the dust phase by analyzing the spectral energy distribution (SED) covering the bands in near-IR region. The near-IR fluxes, corresponding to the observed magnitudes after correction for extinction, are shown for 6 representative epochs starting from 8 Nov 2005 when the object had peaked in its band brightness. The SED’s have been fitted with black body curves, the corresponding temperatures of which are indicated in Figure 5. As may be seen the formal black-body temperatures of the dust shell gradually decrease with time starting from 1615 K on 8 November 2005 to 1040 K on the last day of the observations on 2 December 2005. The shift in the peak of the SED with time towards longer wavelengths is clearly evident and is suggestive of the dust cooling with time. The black body temperatures may not represent the actual dust temperatures in an accurate manner for two reasons. First, the data covers only the 1 to 2.5 m region and the tail of the distribution (the Rayleigh-Jeans regime) is not sampled. Second, the emissivity of actual dust grains depends on its composition and actual grain size distribution and the frequency dependence of the emissivity can deviate from that of a blackbody (Krugel 2003). However our blackbody estimates are consistent with similar estimates of dust temperatures of 1000 K in case of V1668 Sgr, 1000 - 1200 K in Nova Aql 1995 and 950 K in LMC 1988 1.
The dust that formed towards the end of 2005 in nova V476 Sct persisted for quite some more time since the source was also detected by the AKARI infrared astronomical satellite which observed the whole sky in far IR (50-180 m) and mid-IR (9 and 18m) between May 2006 and August 2007. The source was detected in 3 and 2 passes respectively during this period (AKARI does not list exact detection dates) in the 18 and 9 m bands respectively with a mean flux of F(9m) = 0.3138 0.149 Jy and F(18m) = 0.3919 0.0911 Jy (equivalently 1.18x10⁻¹⁸ W cm-2 m-1 and 0.36x10⁻¹⁸ W cm-2 m-1). However by March-April of 2010, observations from the Wide field Infrared Survey Explorer (WISE) did not detect the source in any of the 3.4 (W1), 4.6 (W2), 12 (W3) and 22 m (W4) bands indicating that either the dust had been destroyed by radiation from the central white dwarf or its emission had fallen below the WISE detection limits.
4 Summary
The near-IR spectroscopic and photometric results of the dust forming nova V476 Sct (2005) are presented. spectra and light curve are shown and spectral lines are identified. From the IR spectra, the nova is classified to be of the FeII type consistent with the classification based on optical spectra. The key result concerns the finding of formation of optically thin dust shell in the nova. Reported instances of novae which form such dust shells are few and they are characterized by not displaying a deep or significant dip in their optical lightcurves at the onset of dust formation. The SEDs on several epochs, since the date of commencement of dust formation are plotted, allowing estimates of the dust shell temperature to be made and also showing the gradual cooling of the dust with time.
5 Acknowledgements
The research work at the Physical Research Laboratory is funded by the Department of Space, Government of India. The research work at the S N Bose National Centre for Basic Sciences is funded by Department of Space and Technology, Government of India. We acknowledge the variable star observations from the American Association of Variable Star Observers (AAVSO) and Association Francaise des Observateurs dEtoiles Variables (AFOEV) data base, operated at CDS, France for the use of their optical photometric data contributed by several observers worldwide.
References
- Banerjee & Ashok (2002) Banerjee D. P. K., Ashok N.M., 2002, A&A, 395, 161
- Banerjee & Ashok (2012) Banerjee D. P. K., Ashok N. M., 2012, BASI, 40, 243
- Banerjee et al. (2009) Banerjee D. P. K., Das R. K., Ashok N. M., MNRAS, 2009, 399, 357
- Bode& Evans (2008) Bode M. F., Evans A., 2008, eds Classical Novae, second edition, Cambridge University Press
- Das et al. (2008) Das R. K., Banerjee D. P. K., Ashok N. M.,Chesneau O., 2008, MNRAS, 391, 1874
- Das et al. (2009) Das R. K., Banerjee D. P. K., Ashok N. M., 2009, MNRAS, 398, 375
- Evans et al. (1996) Evans A., Geballe T. R., Rawlings J. M. C., Scott A. D., 1996, MNRAS, 282, 1049
- Evans et al. (1997) Evans A., Geballe T. R., Rawlings J. M. C., Eyres S. P. S., Davies J. K., 1997, MNRAS, 282, 1049
- Ferland at el. (1979) Ferland G. J., Lambert D. L., Netzer H., Hall D. N. B., Ridgway S. T., 1979, ApJ, 227, 489
- Gehrz et al. (1980) Gehrz R. D., Hackwell J. A., Grasdalen G. I., Ney E. P., Neugebauer G., Sellgren K., 1980, ApJ, 239, 570
- Gehrz (1988) Gehrz R. D., 1988, ARA & A, 26, 377
- Gilmore & Kilmartin (2005) Gilmore A. C., Kilmartin P. M., 2005, IAUC, 8607
- Haseda K. (2005) Haseda K., 2005, IAUC, 8607
- Hachisu & Kato (2007) Hachisu I., Kato M., 2007, ApJ, 662, 552
- Kamath (1997) Kamath, U. S.; Anupama, G. C.; Ashok, N. M.; Chandrasekhar, T., 1997, AJ, 114, 2671
- Kiss et al. (2005) Kiss L., Bessel M., Ritter A., 2005, IAUC, 8612
- Koornneef (1983) Koornneef J., 1983, A&A, 128, 84
- Krugel (2003) Krugel E., 2003, The Physics of Interstellar Dust, Institute of Physics Publishing, Bristol, UK
- Lynch et al. (1995) Lynch D. K., Rossano G. S., Rudy R. J., Puetter R. C, 1995, AJ, 110, 2274
- Lynch et al. (2004) Lynch D. K., Wilson J. C., Rudy R. J., Venturini C., Mazuk S., Miller N. A., Puetter R. C., 2004, AJ, 127, 1089
- Mason et al. (1996) Mason C. G., Gehrz R. D., Woodward C. E., Smilowitz J. B., Greenhouse M. A., Hayward T. L., Houck J. R., 1996, ApJ, 470, 577
- Munari et al. (2006) Munari U., Henden A., Pojmanski G., Dallaporta S., Siviero A., Navasardyan H., 2006, MNRAS, 369, 1755
- Naik et al. (2009) Naik S., Banerjee D. P. K., Ashok N. M., 2009, MNRAS, 394, 1551
- Naik et al. (2010) Naik S., Banerjee D. P. K., Ashok N. M., Das, R. K., 2010, MNRAS, 404, 367
- Ness et al. (2010) Ness J.-U., Schwarz G. J., Retter A., Starrfield S., Schmitt J. H. M. M., Gehrels M., Burrows D., Osborne J. P., 2007, ApJ, 663, 505
- Perry et al. (2005) Perry R. B., Venturini C. C., Rudy R. J., Mazuk S., Lynch D. K., Puetter R. C., Walp B., 2005, IAUC, 8638
- Raj et al (2011) Raj, A., Ashok, N.M., Banerjee D.P.K., 2011,MNRAS, 415, 3455
- Raj et al (2012) Raj, A., Ashok, N.M., Banerjee D.P.K., 2012,MNRAS, 425, 2576
- Rudy et al. (2003) Rudy R. J., Dimpfl W. L., Lynch D. K., Mazuk S., Venturini C. C., Wilson J. C., Puetter R. C., Perry R. B., 2003, ApJ, 596, 1229
- Schwarz et al. (1998) Schwarz G. J., Hauschildt P. H., Starrfield S., Whitelock P. A., Baron E., Sonneborn G., 1998, ApJ, MNRAS, 300, 931
- Takao (2005) Takao A., 2005, IAUC 8607
- Williams et al. (1991) Williams R. E., Hamuy M., Phillips M. M., Heathcote S. R., Wells L., Navarrete M., 1991, Ap.J. 376, 721
- Wichmann et al. (1991) Wichmann R., Kautter J., Kawara J., Williams R. E., 1991, in Jaschek C., Andrillat Y., eds, Proc. Int. Coll., Montpellier, France. The Infrared Spectral Region of Stars. Cambridge Univ. Press, Cambridge, p. 353
- Yamaoka (2005) Yamaoka H., 2005, IAUC, 8607