Picosecond Dynamics of Internal Exciton Transitions in CdSe Nanorods
Abstract
The picosecond dynamics of excitons in colloidal CdSe nanorods are directly measured via their 1s to 2p-like internal transitions by ultra-broadband terahertz spectroscopy. Broadened absorption peaks from both the longitudinal and transverse states are observed at 8.5 and 11 THz, respectively. The onset of exciton-LO phonon coupling appears as a bleach in the optical conductivity spectra at the LO phonon energy for times ps after excitation. Simulations show a suppressed exciton temperature due to thermally excited hole states being rapidly captured onto ligands or unpassivated surface states. The relaxation kinetics are manipulated and the longitudinal transition is quenched by surface ligand exchange with hole capturing pyridine.
pacs:
78.67.Qa, 71.35.Cc, 78.47.jh, 63.20.kkQuantum dots are one of the essential building blocks of nanoscience and hold great promise for future optoelectronic applications Talapin et al. (2010). Their optical properties are conveniently tailored by quantum confinement of the exciton Efros and Rosen (2000). The dynamics of exciton relaxation in colloidal quantum dots often defines their limitations for a variety of solution-processed optoelectronic devices, ranging from lasers to spin-cast solar cells and so is currently a topic of intense research Kambhampati (2011). Our understanding of these processes relies largely on the interrogation of interband transitions in the optical regime, which predominantly has been understood in the independent electron and hole picture. This approximation is valid for particle sizes less than the exciton Bohr radius where the particle confinement energies well exceed the Coulomb attraction of the electron and hole. For larger or strongly asymmetric particles, such as nanorods, this approach is no longer valid and the interpretation of these spectra becomes more difficult.
Time-resolved THz spectroscopy has made it possible to directly probe excitons in bulk semiconductors and 2D quantum wells through their internal transitions on a 1-10 meV scale Kaindl et al. (2003); Suzuki and Shimano (2009, 2012). Excitons in colloidal quantum dot and rod systems, however, are expected to have internal transitions in the 10-50 meV range. THz spectroscopy in the 0.8 - 12 meV band has been previously used to probe the off-resonant polarizability, Beard et al. (2002); Wang et al. (2006), long range coupling Beard et al. (2003), and energy transfer between electrons and holes in quantum dots Hendry et al. (2006). Mid-infrared femtosecond spectroscopy has been applied to probe internal electronic transitions in strongly confined CdSe quantum dots where the Coulomb interaction with the hole is a small perturbation and the electronic transitions are well defined on a few 100 meV scale Guyot-Sionnest and Hines (1998). These photon energies, however, are too large to probe the ground state transitions of the exciton in larger particles such as nanorods.
In this Letter, we apply time-resolved multi-THz spectroscopy in the 1-13 THz (1 - 50 meV) range to probe exciton relaxation dynamics in CdSe colloidal nanorods capped with organic ligands by probing their internal excitonic transitions. We observe for the first time intraexcitonic transitions in nanorods and we see evidence of rapid phonon-induced thermalization in a subset of the rod population. Two competing channels for exciton relaxation are observed: capture to surface states on a 4 ps time scale which can be manipulated through ligand exchange and recombination occurring on a longer time scale of several 10’s of ps. This work demonstrates that multi-THz spectroscopy is a powerful tool to investigate exciton dynamics in colloidal nanoparticles and paves the way for future studies of state-dependent relaxation pathways Wong et al. (2009), electron-phonon coupling Sagar et al. (2008) and even manipulation of excitons in nanoparticles by strong THz fields Zaks et al. (2012).
The samples studied are CdSe nanorods 7 nm in diameter and 70 nm in length, synthesized using the hot coordinating solvents method described elsewhere Lek et al. (2011). The nanorods exhibit an absorption edge at approximately 685 nm and a weak photoluminesence peak at 683 nm with a FWHM of 30 nm. The surfaces of the nanorods are passivated with the organic ligand dodecylphosphonic acid (DDPA), which at nm in length serves to electrically isolate the nanorods Beard et al. (2003). These particles were subsequently drop cast from solution onto indium tin oxide (ITO) coated glass slides with a sheet resistivity of 2 /sq, which reflects more than of the THz field amplitude over the entire THz pulse bandwidth. The thickness of the film varied between 1-1.6 m.
The experimental setup is described in more detail elsewhere Cooke et al. (2012), but briefly, we employ an ultra-broadband time-resolved THz spectrometer operating in reflection mode based on two-color laser plasma THz generation Kress et al. (2004) and air-biased coherent detection (ABCD) Dai et al. (2006). The spectrometer is driven by 35 fs, 800 nm pulses provided at 1 kHz repetition rate by a Ti:sapphire regenerative amplifier. The sample was placed at normal incidence in the focus of the THz pulse and the reflection was directed via a high resistivity Si beamsplitter to the ABCD module for detection. A double modulation scheme is used with two lock-in amplifiers to simultaneously detect the THz transient reflected in the presence of the pump and the differential transient where is the reflected THz transient in the absence of the photoexcitation and is the pump-probe delay time Iwaszczuk et al. (2009). The nanorods are photoexcited co-linearly through a small hole in the last parabolic mirror before the sample by 400 nm fs laser pulses at a fluence of 570 J/cm2, unless otherwise stated. All measurements are performed at room temperature in a dry nitrogen environment.
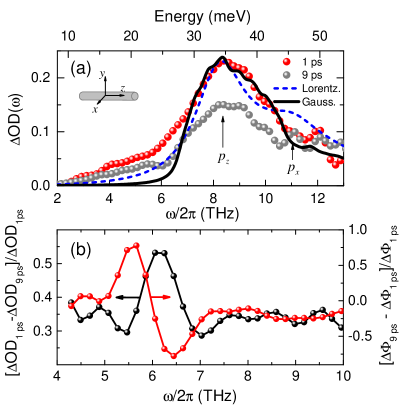
The differential reflectance can be processed into a frequency dependent optical density OD, with the THz pulse traversing the thin film sample twice due to the reflection off the underlying ITO which enhances sensitivity Gallot et al. (2000). Fig. 1(a) shows OD at 1 ps and 9 ps following photoexcitation. A broad absorption peak is observed at 8.5 THz with a higher energy shoulder at approximately 11 THz. Also shown is the calculated intra-excitonic optical density spectrum (see below) scaled to fit the 1 ps data; the agreement is very good.
In all of the experimental spectra there is a small but noticeable reduction in the OD spectra at approximately 6.2 THz that only appears for pump probe times greater than 1 ps (see Fig. 1(a)) and that does not appear in the theoretical excitonic absorption results of Fig. 2(a). In Fig. 1(b) we show the normalized difference between ps and ps absorbance spectra shown in Fig. 1(a), as well as the differential between the respective phase functions . A clear bleach peak is observed in the absorbance, accompanied by a phase flip at the CdSe longitudinal optical (LO) phonon energy at 205 cm-1 (6.15 THz). This bleach signal can be explained if we assume that some of the of nanorods have an intra-excitonic transition energy (perhaps ) that is resonant with the LO phonon. In these nanorods, there will be a resonant Fröhlich interaction scattering excitons between the two transition states via the absorption of an LO phonon Mittleman et al. (1994); Wise (2000); Sagar et al. (2008). This process will lead to a rapid thermal population of the upper state, which will result in the observed bleaching of the absorption at THz. The linewidth of the bleach signal is 0.5 THz, consistent with previous measurements of the Raman linewidth in CdSe nanorods Lange et al. (2008). The onset of exciton-phonon coupling has been previously observed and is attributed to rapid trapping of charge on the surface of the nanorod on a 1-10 ps time scale, causing an internal field which polarizes the exciton and leads to an increase in exciton-phonon coupling Wise (2000); Sagar et al. (2008). For nanorods, however, such an internal field is not necessary to initiate the exciton-phonon coupling due to the asymmetric wavefunctions. Thus we attribute the onset to the thermalization of the excitons due to their eV excess energy compared to the ground state.
To calculate the CdSe nanorod absorbance spectrum arising from transitions between excitonic states, we first calculate the light and heavy hole excitonic energies and envelope functions by expanding them in a basis of non-interacting electron and hole nanorod states. We neglect the coupling between light holes (LH) and heavy holes (HH) and calculate the electron-hole Coulomb interaction matrix elements to obtain the ground excitonic state as well as all of the excited states up to energies beyond the frequency response of the THz detector. In contrast to small quantum dots, the electron and hole states are greatly modified by the Coulomb interaction between them and we require a basis of 10 electron, 60 LH and 60 HH states to obtain convergence for the relevant excitonic states. We employ infinite confining potentials at the surfaces of the cylindrical nanorods and use effective masses given by the diagonal terms in the Luttinger matrix of Ref. Ekimov et al. (1993). We take the nanorods to be cylindrical with a length of 70 nm and assume that there is at most one exciton per nanorod. It is assumed the nanorods all have their cylindrical axes parallel to the substrate surface; for a give nanorod, the direction parallel to the cylindrical axis is the -direction and the radial direction in the plane of the substrate is the -direction (see inset to Fig. 1(a)). Because the LHs are heavier in the radial direction, the lowest-energy exciton is the LH exciton since the ground state HH exciton is 16.1 meV higher in energy.
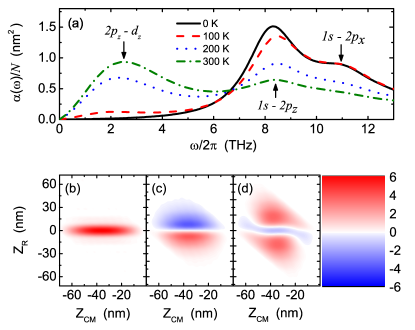
The dashed blue curve in Fig. 1(a) is produced assuming a rod radius of 3.5 nm and a Lorentzian linewidth of 2.4 THz (10 meV) for all transitions and scaled to fit the main peak for the 1 ps data. To produce this spectrum, we assume that all excitons are in the LH ground state when the THz pulse arrives. The main absorption peak at 8.3 THz is due to the transition from the LH exciton ground state to a -like excitonic state. The -dependence of these two states on the rod axis is shown in Figs. 2 (b) and (c) respectively. The dipole matrix element for this transition is nm, where is the magnitude of the electron charge. The weaker transition, which appears as a shoulder at 10.8 THz is due to a transition from the LH ground state to the LH state, which has a dipole moment of only nm. We note that there are many other excitonic states with excited center-of-mass motion with lower energies than the and states, but the transition dipole between these states and the ground state is negligible.
If we now assume that the excitons are in quasi-thermal equilibrium, we obtain the absorbance spectra shown in Fig. 2(a) for four different temperatures. As the temperature increases, the relative strengths of the and transitions change. In addition, above about K, a new peak appears at about THz, which is largely due to a transition from the LH state to a higher LH -like state shown in Fig. 2(d); the dipole matrix element for this transition is nm, which is why the peak is so large.
Reasonable agreement with experiment is only found if we assume an effective temperature of less than 100 K. We interpret this result as a strong indication that only the ground state exciton has a significant population when the THz pulse hits the sample. We propose that the absence of excitons in excited states is due to the rapid transfer of the holes in excited excitonic states into traps in the ligand. As such trapped holes are spatially separate from the electrons in the nanorods, these ”bound excitons” have negligible intra-excitonic dipole matrix elements and so do not contribute to the THz absorption.
Scanning electron microscopy (SEM) of the nanorod samples shows a distribution of nanorod diameters and length. For the range of lengths observed, the THz absorption shows little length-dependence but significant dependence on radius. The solid black curve in Fig. 1(a) is produced taking the nanorod radii to have a Gaussian distribution, with a mean of 3.25 nm and standard deviation of 0.7 nm, consistent with the values observed in SEM. To make the calculations tractable, we have discretized the distribution in steps of 0.05 nm, which results in small oscillations seen in the curve. We have measured the thickness of the nanorod film in the measured spot to be m. The remaining unknown is the exciton density, treated as a fitting parameter and corresponding to 0.45 excitons per nanorod for the ps spectra. The agreement is quite good, except for frequencies below THz where a low frequency absorption tail is present. This may be due to contributions from excited state transitions or a non-Gaussian, large-radius tail in the actual nanorod radius distribution.
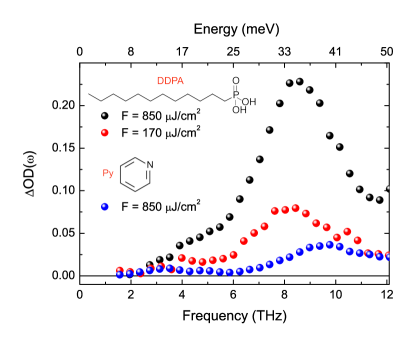
To investigate the influence of surface passivation, we have performed a ligand exchange with a hole scavenging ligand following the work of Guyot-Sionnest et al., where 70 of the DDPA is replaced by pyridine Guyot-Sionnest and Hines (1998). Fig. 3 shows there is a strong suppression of the excitonic OD peak and a slight blue shift to 9.8 THz. At this point there are no models for the influence of bound surface charge on the internal excitonic transitions of a nanorod. It appears that these states have lower energy than the excited excitonic states of the nanorods, as we see from comparison of the room temperature plot in Fig. 2(a) to the experimental results that there is essentially no evidence of populations in the excited excitonic states at room temperature. Also shown in Fig. 3 is the OD() spectra of the DDPA passivated nanorods at ps for a factor of 5 reduction in pump fluence. No shift in the peak frequency is observed with reduced excitation density, inconsistent with a plasmon - Fröhlich phonon mode Hyun et al. (2011), and consistent with our assumption of there being no more than one exciton per nanorod in our model.
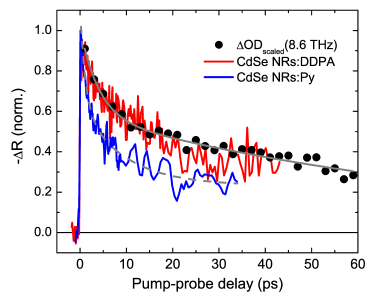
To follow the exciton relaxation dynamics, a one dimensional slice at the peak (8.6 THz) of the OD spectra is shown in Fig. 4, demonstrating a clear bi-exponential decay with 42 of the signal undergoing a fast 4.0(7) ps decay and the remaining 58 relaxing slower with a 90(8) ps decay constant. These relaxation times are comparable with previous time-resolved optical studies of CdSe nanorods Mohamed et al. (2001); Robel et al. (2006). The change in exciton relaxation dynamics due to ligand exchange was also investigated by performing a less time-consuming differential reflectivity measurement, monitoring the peak of the differential THz waveform shown in Fig. 1 for the DDPA and pyridine ligand passivated nanorods. The normalized transients for both samples are shown in Fig. 4, which track the R() transient for the CdSe:DDPA nanorod and confirms that R() is proportional to the ground state population. Ligand exchange with pyridine noticeably decreases the lifetime of the exciton ground state, well described again by a bi-exponential decay with a 1.8(2) ps fast time constant and a slower 42(3) ps time constant not well resolved by our limited temporal range. The fast decay is therefore identified with rapid hole charge transfer and localization from the core to the pyridine molecule, forming a charge separated complex and leaving a core electron behind.
In conclusion, we have determined the picosecond dynamics of excitons in CdSe nanorods by probing their internal excitonic transitions at meV energies. The exciton ground state decays on two time scales, one dominated by surface trapping on a sub-5 ps time scale and another on a several 10’s of ps time scale. The dynamics of these processes are significantly influenced by the capping by organic ligands, with the transition strength suppressed and relaxation enhanced by introduction of the hole scavenging pyridine ligand. Several promising lines of investigation are now possible using these internal exciton transitions. Signatures of electron-phonon coupling are indicated when there are absorbance features occurring at the nanorod LO phonon frequency. The influence of surface ligands on dynamics as well as the energetics of the excitonic transitions will lead to a sensitive test of theory. Finally, as the temporal resolution is improved it will be possible to investigate directly the cooling of hot excitons through the densely packed manifold of states.
Acknowledgements.
M. M. Dignam and D. G. Cooke acknowledge funding from NSERC. D. G. Cooke also acknowledges funding from CFI and FRQNT. The authors thank M. Kraus and P. Kambhampati for photoluminescence measurements of the nanorods.References
- Talapin et al. (2010) D. V. Talapin, J.-S. Lee, M. V. Kovalenko, and E. V. Shevchenko, Chem. Rev. 110, 389 (2010).
- Efros and Rosen (2000) A. L. Efros and M. Rosen, Annu. Rev. Mater. Sci. 30, 475 (2000).
- Kambhampati (2011) P. Kambhampati, Acc. Chem. Res. 44, 1 (2011).
- Kaindl et al. (2003) R. A. Kaindl, M. A. Carnahan, D. Hägele, R. Lövenich, and D. S. Chemla, Nature 423, 734 (2003).
- Suzuki and Shimano (2009) T. Suzuki and R. Shimano, Phys. Rev. Lett. 103, 057401 (2009).
- Suzuki and Shimano (2012) T. Suzuki and R. Shimano, Phys. Rev. Lett. 109, 046402 (2012).
- Beard et al. (2002) M. C. Beard, G. M. Turner, and C. A. Schmuttenmaer, Nano Lett. 2, 983 (2002).
- Wang et al. (2006) F. Wang, J. Shan, M. A. Islam, I. P. Herman, M. Bonn, and T. F. Heinz, Nat. Mater. 5, 861 (2006).
- Beard et al. (2003) M. C. Beard, G. M. Turner, J. E. Murphy, O. I. Micic, M. C. Hanna, A. J. Nozik, and C. A. Schmuttenmaer, Nano Lett. 3, 1695 (2003).
- Hendry et al. (2006) E. Hendry, M. Koeberg, F. Wang, H. Zhang, C. D. Donegá, D. Vanmaekelbergh, and M. Bonn, Phys. Rev. Lett. 96, 057408 (2006).
- Guyot-Sionnest and Hines (1998) P. Guyot-Sionnest and M. A. Hines, Appl. Phys. Lett. 72, 686 (1998).
- Wong et al. (2009) C. Y. Wong, J. Kim, P. Sreekumari Nair, M. C. Nagy, and G. D. Scholes, J. Phys. Chem. C 113, 795 (2009).
- Sagar et al. (2008) D. M. Sagar, R. R. Cooney, S. L. Sewall, E. A. Dias, M. M. Barsan, I. S. Butler, and P. Kambhampati, Phys. Rev. B 77, 235321 (2008).
- Zaks et al. (2012) B. Zaks, R. B. Liu, and M. S. Sherwin, Nature 483, 580 (2012).
- Lek et al. (2011) J. Y. Lek, L. Xi, B. E. Kardynal, L. H. Wong, and Y. M. Lam, ACS Appl. Mater. Interfaces 3, 287 (2011).
- Cooke et al. (2012) D. G. Cooke, F. C. Krebs, and P. U. Jepsen, Phys. Rev. Lett. 108, 056603 (2012).
- Kress et al. (2004) M. Kress, T. Löffler, S. Eden, M. Thomson, and H. G. Roskos, Opt. Lett. 29, 1120 (2004).
- Dai et al. (2006) J. Dai, X. Xie, and X.-C. Zhang, Phys. Rev. Lett. 97, 103903 (2006).
- Iwaszczuk et al. (2009) K. Iwaszczuk, D. G. Cooke, M. Fujiwara, H. Hashimoto, and P. U. Jepsen, Opt. Express 17, 21969 (2009).
- Gallot et al. (2000) G. Gallot, S. P. Jamison, R. W. McGowan, and D. Grischkowsky, J. Opt. Soc. Am. B 17, 851 (2000).
- Mittleman et al. (1994) D. M. Mittleman, R. W. Schoenlein, J. J. Shiang, V. L. Colvin, A. P. Alivisatos, and C. V. Shank, Phys. Rev. B 49, 14435 (1994).
- Wise (2000) F. W. Wise, Acc. Chem. Res. 33, 773 (2000).
- Lange et al. (2008) H. Lange, M. Artemyev, U. Woggon, T. Niermann, and C. Thomsen, Phys. Rev. B 77, 193303 (2008).
- Ekimov et al. (1993) A. I. Ekimov, F. Hache, M. C. Schanne-Klein, D. Ricard, C. Flytzanis, I. A. Kudryavtsev, T. V. Yazeva, A. V. Rodina, and Al. L. Efros, J. Opt. Soc. Am. B 10, 100 (1993).
- Hyun et al. (2011) B.-R. Hyun, A. C. Bartnik, W.-k. Koh, N. I. Agladze, J. P. Wrubel, A. J. Sievers, C. B. Murray, and F. W. Wise, Nano Lett. 11, 2786 (2011).
- Mohamed et al. (2001) M. B. Mohamed, C. Burda, and M. A. El-Sayed, Nano Lett. 1, 589 (2001).
- Robel et al. (2006) I. Robel, B. A. Bunker, P. V. Kamat, and M. Kuno, Nano Lett. 6, 1344 (2006).