Color-Magnitude Relations within Globular Cluster Systems of Giant
Elliptical Galaxies:
The Effects of Globular Cluster Mass Loss and the
Stellar Initial Mass Function
Abstract
Several recent studies have provided evidence for a “bottom-heavy” stellar initial mass function (IMF) in massive elliptical galaxies. Here we investigate the influence of the IMF shape on the recently discovered color-magnitude relation (CMR) among globular clusters (GCs) in such galaxies. To this end we use calculations of GC mass loss due to stellar and dynamical evolution to evaluate (i) the shapes of stellar mass functions in GCs after 12 Gyr of evolution as a function of current GC mass along with their effects on integrated-light colors and mass-to-light ratios, and (ii) their impact on the effects of GC self-enrichment using the 2009 “reference” model of Bailin & Harris. As to the class of metal-poor GCs, we find the observed shape of the CMR (often referred to as the “blue tilt”) to be very well reproduced by Bailin & Harris’ reference self-enrichment model once 12 Gyr of GC mass loss is taken into account. The influence of the IMF on this result is found to be insignificant. However, we find that the observed CMR among the class of metal-rich GCs (the “red tilt”) can only be adequately reproduced if the IMF was bottom-heavy ( in ), which causes the stellar mass function at subsolar masses to depend relatively strongly on GC mass. This constitutes additional evidence that the metal-rich stellar populations in giant elliptical galaxies were formed with a bottom-heavy IMF.
Subject headings:
galaxies: elliptical and lenticular, cD — galaxies: formation — galaxies: star clusters: general — globular clusters: general — stars: luminosity function, mass function1. Introduction
Globular clusters (GCs) are thought to be formed in bursts of star formation within molecular protocluster clouds, producing gravitationally bound clusters of 104 – 107 stars which represent the best known approximations of a “simple stellar population” (hereafter SSP), i.e., a coeval population of stars with a single metallicity (e.g., Brodie & Strader, 2006, and references therein). Extensive photometric observations of extragalactic GC systems have now yielded a substantial database of GC colors and magnitudes to investigate overall trends among subpopulations of GCs and between properties of GC subpopulations and those of their host galaxies. The advent of the Advanced Camera for Surveys (ACS) aboard the Hubble Space Telescope (HST) was pivotal in this area due to its unique high sensitivity and spatial resolution over a field of view of 12 arcmin2 (e.g., Côté et al., 2004; Goudfrooij et al., 2004, 2007; Harris et al., 2006, 2009; Jordán et al., 2007a; Peng et al., 2006, 2011).
One main result of these studies was that GCs in luminous galaxies typically follow a bimodal color distribution. Multi-object spectroscopy studies showed that both “blue” and “red” GC subpopulations are nearly universally old, with ages 8 Gyr (e.g., Cohen et al., 2003; Puzia et al., 2005). This implies that the color bimodality is mainly due to differences in metallicity (see also Brodie et al., 2012). Typical metallicity values for metal-poor (blue) GCs in giant elliptical galaxies are [Z/H] = , while metal-rich (red) GCs average [Z/H] = (Harris et al., 2006; Peng et al., 2006).
A more recently discovered feature among GC systems was a color-magnitude relation among GCs in the metal-poor subpopulation, in the sense that their colors become progressively redder at higher luminosities (Harris et al., 2006, 2010; Strader et al., 2006; Spitler et al., 2006; Mieske et al., 2006, 2010; Forbes et al., 2010).
This relation, colloquially called the “blue tilt”, is typically interpreted as a mass-metallicity relation (hereafter MMR), although the various analyses of the effect in individual galaxies have not yet converged to an agreement on the significance of the tilt and the mass range in which the correlation is significant (see, e.g., Kundu, 2008 and Waters et al., 2009 versus Harris et al., 2006, Mieske et al., 2006, and Peng et al., 2009). Recently, Mieske et al. (2010) performed a detailed investigation of the color-magnitude relation in the largest sample of GCs to date by far ( 16,900 GCs, see Section 2), using and filters. Three main conclusions of Mieske et al. (2010) regarding the blue tilt were that (i) the blue tilt is firmly present for GC masses while it becomes more pronounced at ; (ii) the tilt is more pronounced for GCs associated with high-mass galaxies () than for GCs in lower-mass galaxies; and (iii) the tilt is more pronounced for GCs at smaller galactocentric distances. Notably, Mieske et al. (2010) also found evidence for the presence of a “red tilt”, i.e., a color-magnitude relation among GCs in the metal-rich subpopulation. This red tilt is seen among GCs in the full magnitude range sampled by Mieske et al. (2010), albeit only within their “high-mass” subset of galaxies.
The vast majority of studies of the MMR among GCs explain it as being due to GC self-enrichment by ejecta of supernovae of type II (SN II; e.g., Strader & Smith, 2008; Bailin & Harris, 2009). However, several features of the blue tilt mentioned above seem to indicate that GC self-enrichment alone cannot fully explain the observed MMR. For example, most theoretical work on GC self-enrichment in heavy (Fe-peak) elements indicates that it is only effective at masses (e.g., Morgan & Lake, 1989; Recchi & Danziger, 2005; Fellhauer et al., 2006; Bailin & Harris, 2009) whereas the blue tilt in elliptical galaxies persists down to GC masses that are an order of magnitude lower111We note that star-to-star abundance variations among light elements (up to 13Al) are commonly found within Galactic GCs, and there are indications that the amplitude of such variations scale with GC mass (e.g., Carretta et al., 2010a; Gratton et al., 2012). However, such variations only cause a small blueing of integrated colors ( Goudfrooij & Kruijssen, 2013), which cannot cause the blue or red tilts.. Furthermore, one would not expect to see significant environmental dependences of the slope of the MMR (such as the tilt being more pronounced for higher-mass galaxies or for smaller galactocentric distances) if GC self-enrichment were the only relevant cause. Instead, the presence of such environmental variations seem to indicate an effect (or effects) whose strength is driven by the local tidal field, such as star cluster disruption.
Recent investigations of the distribution of Fe-peak element abundances within Galactic GCs are starting to yield clues in this regard. Statistically significant internal variations in [Fe/H] have so far been detected within a few (metal-poor) GCs: Cen (e.g., Norris & Da Costa, 1995; Johnson & Pilachowski, 2010), M 54 (Sarajedini & Layden, 1995; Bellazzini et al., 2008; Carretta et al., 2010b), and M 22 (Marino et al., 2011). These GCs have current masses of , , and respectively (McLaughlin & van der Marel, 2005). Note that the mass of M 22 is comparable to the onset of the blue tilt found by Mieske et al. (2010), lending credence to the potential relevance of GC mass loss in this context.
Meanwhile, recent studies of the central regions of nearby massive elliptical galaxies revealed very strong gravity-sensitive features in their near-IR spectra (van Dokkum & Conroy, 2010; Conroy & van Dokkum, 2012), indicating a stellar initial mass function (IMF) that was steeper at subsolar masses ( in ) than the canonical Kroupa (2001) or Chabrier (2003) IMFs, which have in the same mass range. This was subsequently found to be consistent with studies of stellar ratios of massive early-type galaxies derived from gravitational lensing (e.g., Sonnenfeld et al., 2012) and stellar dynamics (Cappellari et al., 2012; Tortora et al., 2013). In the same vein, Goudfrooij & Kruijssen (2013) reported a systematic offset between optical colors of giant elliptical galaxies and the mean colors of their massive metal-rich GCs, in the sense that those GCs were bluer than their parent galaxies by 0.12 – 0.20 mag at a given galactocentric distance (a 7 – 22 effect). However, measurements of Lick-system spectral indices that are sensitive to age and metallicity (but not to IMF variations) for such galaxies and their metal-rich GCs were found to be consistent with one another at a given galactocentric distance, within small uncertainties. Goudfrooij & Kruijssen (2013, hereafter Paper I) showed that this paradox can be explained if the stellar IMF was steep at subsolar masses: 12 Gyr of dynamical evolution would then cause the average massive GC to become bluer by an amount consistent with the observed color difference between the metal-rich GCs and their parent galaxies.
To investigate these recent indications of the relevance of the IMF shape and dynamical evolution with regards to the colors of GCs and features of the observed MMR among GCs in nearby galaxies, we conduct a study of the effects of mass loss of GCs born with different IMF shapes to the MMR among GCs in giant elliptical galaxies and compare those effects to the observed MMR and the effect of self-enrichment.
2. The Mass-Metallicity Relation among Globular Clusters
In comparing results of our calculations with observed features of the GC MMR in giant elliptical galaxies, we adopt the parametrizations of the observed color-magnitude relation and the MMR among metal-poor and metal-rich GCs by Mieske et al. (2010, see their Table 1). This choice was made because their MMR study gathered the largest photometric sample of GCs to date by far ( 16,900 GCs), namely by combining all GCs detected in the ACS Fornax and Virgo Surveys of early-type galaxies. These HST surveys were carried out using a homogeneous measurement technique in which photometric aperture-size corrections were determined from convolutions of the best-fit GC profiles with local point-spread functions on the image (see Jordán et al., 2009 for details).
Briefly, GC masses and metallicities in Mieske et al. (2010) were derived from HST/ACS photometry in the F475W (hereafter ) and F850LP () filters, corrected for Galactic foreground extinction. Metallicities (in terms of [Fe/H] on the Zinn & West (1984) scale) were derived using the broken linear transformation of Peng et al. (2006), while GC masses were derived from -band absolute magnitudes, using , which is correct to within 5% in the range for an SSP (Jordán et al., 2007b).
We refer to Mieske et al. (2010) for further details regarding the determination of color-magnitude relations and MMRs among their various subsamples of GCs.
3. Dynamical Evolution Effects on the Color-Magnitude Relation among Globular Clusters
3.1. Dynamical Evolution and Stellar Mass Functions
It is well known that mass loss of star clusters by dynamical evolution affects the shape of their stellar MF, because the escape probability of stars from their parent cluster increases with decreasing stellar mass (e.g., Hénon, 1969; Baumgardt & Makino, 2003; Kruijssen, 2009). This effect is widely used to explain observed stellar MFs in ancient Galactic GCs, some of which are flatter than canonical IMFs (e.g., de Marchi et al., 2007; Paust et al., 2010). Such flat MFs in GCs can explain their low observed mass-to-light ratios when compared with predictions of SSP models that use canonical IMFs (e.g., Kruijssen & Portegies Zwart, 2009).
To evaluate the influence of the shape of the IMF on the present-day color-magnitude relation among GCs, we follow Paper I and use the GC evolution model of Kruijssen (2009, hereafter K09) which incorporates the effects of stellar evolution, dynamical evolution in a tidal field, mass segregation, and stellar remnant retention. For the purposes of the current study, we select K09 models that (i) feature “default” kick velocities of stellar remnants (white dwarfs, neutron stars, and black holes), and (ii) produce GCs with masses at an age of 12 Gyr, i.e., GCs such as those selected by Mieske et al. (2010) to derive their MMRs. We further consider King (1966) profiles with values of 5 and 7 and environmentally dependent cluster dissolution time scales of 0.3, 0.6, 1.0, and 3.0 Myr222 is defined by where is the cluster disruption time and sets the mass dependence of cluster disruption. See Lamers et al. (2005) and K09 for details.. For reference, Myr yields a good fit to the globular cluster mass function of all surviving Galactic GCs (Kruijssen & Portegies Zwart, 2009). However, rather than using a single value for a given galaxy, we consider that GC systems in galaxies are expected to exhibit a range of values. For instance, the rate of mass loss from GCs by two-body relaxation, , effectively scales with the mean GC half-mass density as for tidally limited GCs (e.g., McLaughlin & Fall 2008; Gieles et al. 2011; Goudfrooij 2012). Among GCs for which two-body relaxation has been the dominant mass loss mechanism, low- GCs thus feature larger values than high- GCs at a given . Similarly, GCs on eccentric orbits with large perigalactic distances should have larger values than otherwise (initially) similar GCs with smaller values of . Finally, disruption rates of GCs in dense environments such as central regions of gas-rich galaxy mergers at high redshift were likely higher than in current quiescent galaxies (Fall et al., 2009; Kruijssen et al., 2012) due to the enhanced strength and rate of tidal perturbations.
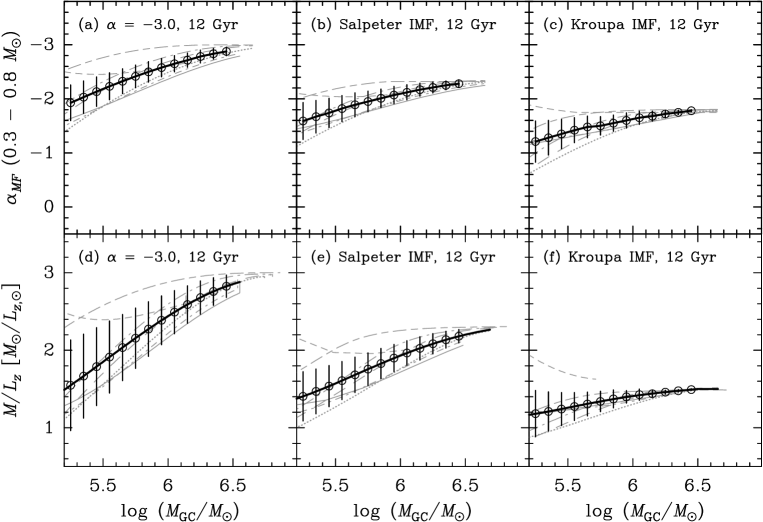
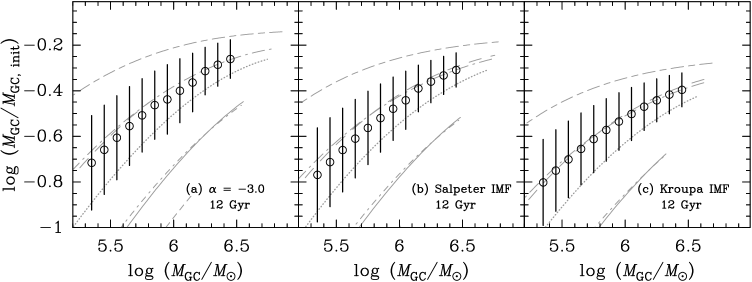
In Paper I, we explored the influence of the IMF on the present-day MF at subsolar masses for the star cluster families mentioned above. For an ensemble of such GCs, our calculations showed that the overall average present-day MF slope in the stellar mass range 0.3 – 0.8 (hereafter designated ) is consistent with the Kroupa MF for any IMF slope (see Figure 7 of Paper I). However, the mass dependence of (averaged over all K09 models that produce GCs of a given mass), is found to be significantly stronger for steeper IMFs. This is illustrated in Figures 1a – 1c, which show versus for all K09 models that produce GCs with at an age of 12 Gyr, as well as the average model, for three IMFs: (i) A “bottom-heavy” IMF with for and for (this IMF is hereafter simply referred to as ), (ii) the Salpeter (1955) IMF (i.e., over the full stellar mass range), and (iii) the Kroupa (2001) IMF. As described in detail in Paper I, the stronger cluster mass dependence of among ancient GCs born with a steeper IMF is mainly caused by the weaker effect of retained massive stellar remnants on the escape rate of massive stars in GCs with steeper IMFs relative to that in GCs with flatter IMFs.
The effect of 12 Gyr of dynamical evolution on the ratio as a function of is similar to that on . This is shown in Figures 1d – 1f. As expected, steeper IMFs feature higher ratios for the most massive GCs. However, steeper IMFs also feature a stronger cluster mass dependence of , and a larger spread of ratios among different GC families at a given current mass. This result renders it difficult to constrain the IMF slope for individual ancient GCs through direct measurements of or , especially for GCs with . However, the large spread of observed MF slopes and ratios among Galactic GCs (de Marchi et al., 2007; Paust et al., 2010; Zaritsky et al., 2013) generally appears more consistent with a bottom-heavy IMF than with a Kroupa or Chabrier one. In the remainder of this paper, the cluster mass – relations shown by the thick solid lines in Figs. 1d – 1f will be taken into account when comparing model predictions to the observed MMR from Mieske et al. (2010), since the latter study used independent of cluster mass.
3.2. Dynamical Evolution and Colors
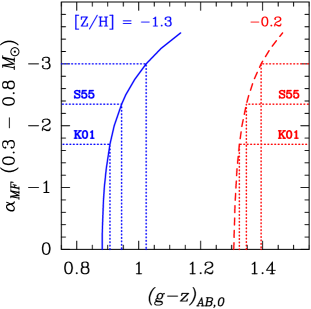
The impact of on the integrated color of ancient (12 Gyr old) GCs is shown in Figure 2 for [Z/H] = 1.3 and [Z/H] = 0.2, i.e., the two typical metallicity values for the metal-poor and metal-rich GC subpopulations in giant elliptical galaxies, respectively. These curves were determined from Padova isochrones (Marigo et al., 2008). After rebinning the isochrone tables to a uniform bin size in stellar mass using linear interpolation, weighted luminosities of the population were derived for the relevant passbands by normalizing individual stellar luminosities as follows:
where is the maximum stellar mass reached in the isochrone table, , and is the MF slope in the mass range .
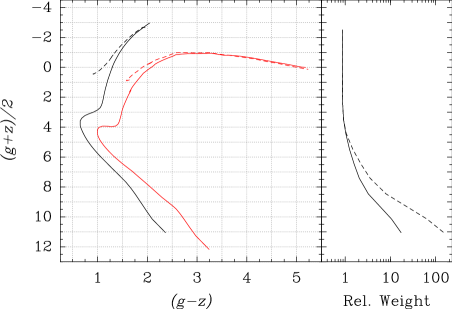
Note that the effect of the IMF shape on the color is larger for metal-poor populations than for metal-rich ones. This difference can be understood by considering the shape of the isochrones in color-magnitude diagrams (CMDs) at different metallicities. This is illustrated in Figure 3 which shows Marigo et al. (2008) isochrones for [Z/H] = 1.3 and [Z/H] = 0.2 (at an age of 12 Gyr) in a ()/2 vs. CMD333()/2 was chosen as the ordinate for the CMD in order to show the luminosity exactly in between the and passbands.. Note that metal-rich populations feature a strong curvature of the red giant branch (RGB) in these passbands, rendering colors of upper RGB stars that are significantly redder than those of lower main sequence (MS) stars. Conversely, the curvature of the RGB in the CMD for metal-poor populations is much weaker, and upper RGB stars are bluer than lower MS stars for metal-poor populations. As the overall range of ()/2 magnitudes spanned by the isochrones is similar for metal-poor and metal-rich populations, the impact of the MF slope at subsolar masses on the integrated colors is larger for metal-poor populations than for metal-rich ones.
To transform the GC mass– and IMF-dependent effect of GC disruption on at an age of 12 Gyr seen in Figs. 1a – 1c to observable properties, we apply the vs. relations shown in Figure 2 to the K09 models for the three IMFs shown in Figure 1. Figure 4 shows the resulting color-mass relations among ancient GCs for the three IMFs. For comparison, we overplot the observed color-mass relations among metal-poor and metal-rich GC subpopulations in giant elliptical galaxies taken from Mieske et al. (2010, i.e., their “FCS+VCS high-mass” galaxy sample), after taking into account the dependence of on (and its dependence on the IMF) shown in Figs. 1d – 1f.
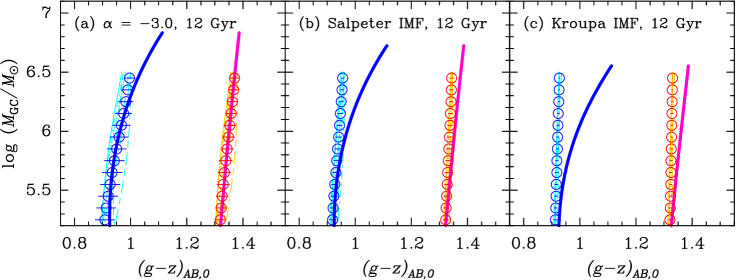
Figures 4b and 4c show that the observed color-mass relations among GCs in giant ellipticals are significantly more pronounced than those predicted by the K09 GC disruption models that use the Kroupa IMF (and, to a lesser extent, those using the Salpeter IMF as well). This is especially true for the case of the metal-poor GCs (i.e., the ‘blue tilt’). This is consistent with the findings of Mieske et al. (2010) who used the older GC disruption models of Kruijssen & Lamers (2008) (which use the Kroupa IMF) to evaluate the impact of dynamical evolution to the color-mass relations. Hence, Mieske et al. concluded that dynamical evolution of star clusters cannot be responsible for the shape of the blue tilt seen in giant elliptical galaxies. However, the color-mass relations predicted by the K09 models for are more similar to the observed relations (see Fig. 4a). Specifically, the “average K09 model” for reproduces the ‘red tilt’ observed among metal-rich GCs in giant ellipticals almost perfectly, while the same model reproduces the ‘blue tilt’ quite well for GC masses up to log , beyond which the observed blue tilt becomes more pronounced than the K09 model prediction.
4. The Nature of the GC Color-Mass Relation
As shown in the previous section, dynamical evolution of GCs can explain the shape of the color-mass relation among GCs in giant elliptical galaxies up to log if the IMF was steep at subsolar masses (), i.e., significantly steeper than the Kroupa IMF for which at those masses. However, the fact that the blue tilt becomes more pronounced for log does not seem to be compatible with dynamical evolution and requires a different explanation.
In this context, previous studies already tested the potential efficacy of stochastic fluctuations within the stellar CMDs, contamination of the GC samples by tidally stripped dwarf galaxy nuclei, accretion of GCs found in present-day low-mass galaxies, and field star capture by GCs (Mieske et al., 2006; Mieske & Baumgardt, 2007). None of these effects were found to be likely contributors to the shape of the blue tilt in a significant manner.
On the other hand, one effect known to have the potential to cause a significant mass-metallicity relation among massive GCs is that of GC self-enrichment by means of retention and reprocessing of SN ii ejecta (e.g., Morgan & Lake, 1989; Recchi & Danziger, 2005; Strader & Smith, 2008; Bailin & Harris, 2009). In the remainder of this Section, we re-examine the GC self-enrichment scenario of Bailin & Harris (2009, hereafter BH09) and its expected effect on the mass vs. relation among GCs by taking into account the effects of GC mass loss by both stellar evolution and dynamical evolution for different IMF shapes.
The latter effects can be divided up as follows: (i) the effect of GC self-enrichment on the colors of GCs. This effect becomes increasingly important for GC masses above a certain minimum mass; (ii) the influence of GC mass loss on the present-day masses (and hence magnitudes) at which a given effect of GC self-enrichment is reached (including the dependence thereof on the adopted IMF); and (iii) the influence of dynamical evolution on the colors of GCs (and its dependence on the adopted IMF). The latter effect was shown and discussed above in Section 3.2.
4.1. The Impact of GC Mass Loss on GC Self-Enrichment
We refer to BH09 for a full description of their GC self-enrichment model, including its assumptions, caveats and comparisons with other such models. Briefly, the BH09 model is built upon the assumptions that the energy of the SN ii ejecta is fully converted to kinetic energy, and that self-enrichment occurs when this kinetic energy is equal to or less than the binding energy of the primordial gas cloud that formed the GC. The metallicity of the protocluster cloud is parameterized as follows (see Equation (7) of BH09):
| (2) |
where represents the metallicity of the gas cloud prior to self-enrichment, the factor 100.38 represents the SN yield used by BH09, represents the star formation efficiency (for which we adopt BH09’s value of 0.3), and denotes the fraction of metals retained within the cloud and incorporated during the formation of the lower-mass stars. In deriving , BH09 define their “reference model” as one in which the radial mass density profile of the protocluster cloud falls off as an isothermal sphere (i.e., ). For this case they find
| (3) |
(see Equation 28 of BH09) where is the energy released per SN ii (taken to be 1051 erg), is the truncation radius of the protocluster cloud (taken as 1 pc in BH09’s reference model), and is the protocluster cloud mass.
To estimate protocluster cloud masses from observed present-day GC masses, we use
| (4) |
where is the initial GC mass and is the cumulative mass loss of the GC at an age of 12 Gyr, consisting of mass loss by stellar evolution () and by dynamical evolution (). We determine values for by using the “average” models of K09444The K09 models use the Marigo et al. (2008) isochrones to evaluate . which were shown by open circles in Fig. 4. Figure 5 depicts versus for the three IMFs considered in this paper. Note the significant dependence of the cumulative GC mass loss on the IMF shape, especially for the most massive GCs. This effect is mainly caused by being significantly larger for IMFs with shallower slopes.
Metallicities predicted by the BH09 reference model through equation (3) are converted to observed colors by means of the relation of Peng et al. (2006), adopting = 0.016 (VandenBerg et al., 2007) and = [Fe/H] + 0.25 ( 0.10) as found for Galactic GCs as well as GCs in giant early-type galaxies (e.g., Shetrone et al., 2001; Puzia et al., 2005, 2006; Kirby et al., 2008). To compare model predictions with the observed GC color-mass relations, we assume pre-enrichment levels of [Zpre/H] = 1.45 and [Zpre/H] = 0.25 for the metal-poor and metal-rich GC subpopulations, respectively. These values yield colors that agree with those of the observed red and blue tilts, respectively, at the low-mass limit of the GC sample.
In the top panels of Figure 6 (i.e., Figs. 6a – 6c) we plot the color-mass relations that would be expected if GCs are self-enriched according to the reference BH09 model, after which the GCs undergo 12 Gyr of mass loss according to the “average” K09 models for the three different IMFs. These diagrams are based on Fig. 4 after removing the symbols associated with the K09 model predictions. The dotted lines indicate the color-mass relation due purely to self-enrichment, while the dashed lines do so for the case of pre-enrichment plus self-enrichment. Each set of lines is drawn twice (using different pen colors) to indicate the predictions with and without the effect of GC mass loss.
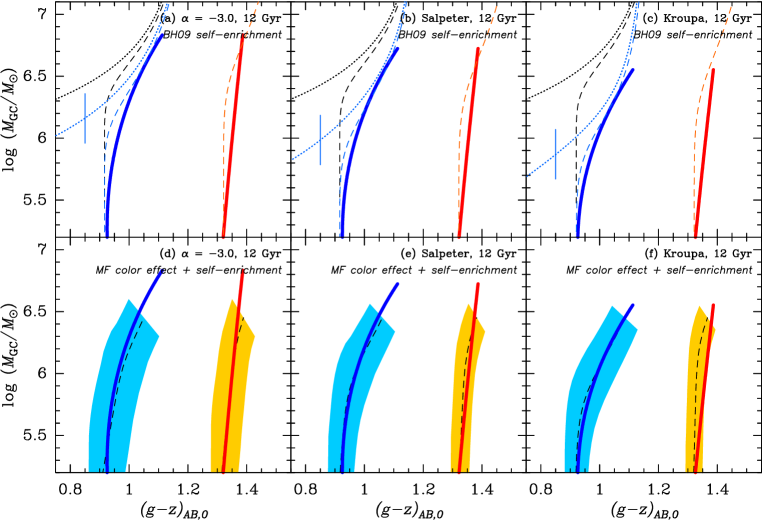
Concentrating on the results for the metal-poor GC subpopulation, we see that the effect of GC mass loss on the BH09 model predictions is significant. Specifically, the color-mass relation predicted by the standard BH09 model is consistent (to within the uncertainties) with the observed color-mass relation from Mieske et al. (2010) for Kroupa and Salpeter IMFs. For the IMF, the predicted colors are somewhat bluer than the observed color-mass relation in the mass range . Conversely, looking at the predictions for the metal-rich GC subpopulation, we see that the effect of self-enrichment is expected to become observable only for current GC masses , whereas the red tilt is observed down to significantly lower GC masses.
4.2. Combining the Effects of Self-Enrichment and Dynamical Evolution
The combined effects of GC self-enrichment and the evolution of the stellar mass function in GCs on their colors are illustrated in the bottom panels of Figure 6 (i.e., Figs. 6d – 6f). This is done by first converting the GC mass-dependent colors due to the effect of dynamical evolution of GCs on (shown in Figs. 1a – c and 2) to metallicity space using the transformation of Peng et al. (2006). To this we add the metallicity due to GC self-enrichment (i.e., the equivalent of the blue dotted lines in Figs. 6a – c). The total metallicities are then converted back to using the Peng et al. (2006) transformation as before.
Figs. 6d – 6f reveal an interesting result for the metal-poor GC subpopulation: when adding the simulated effects of GC self-enrichment (including 12 Gyr of GC mass loss) and the evolution of in GCs on their colors, the resulting color-mass relation becomes consistent with the observed blue tilt among metal-poor GCs in giant ellipticals for all IMF shapes considered here. In fact, differences between results that use different IMF shapes are smaller than the uncertainties in this respect. This result is due to the fact that while the effect of the mass-dependent evolution of (due to dynamical evolution of GCs) on the colors is significantly stronger for steep IMFs (e.g., 3.0) than for Salpeter or Kroupa IMFs, the opposite is true for the effect of GC mass loss due to stellar evolution (and hence the impact of GC self-enrichment for GCs with ), and the two effects cancel out each other to within the uncertainties.
The situation is different for the metal-rich GC subpopulation. The effect of GC self-enrichment on the colors of metal-rich GCs is much weaker than for metal-poor GCs: our calculations indicate that only the most massive metal-rich GCs (with ) will have had their colors slightly affected by self-enrichment (by relative to less massive GCs). Conversely, the effect of the mass-dependent evolution of on the color causes an approximately linear color-mass relation over the full range of GC masses considered, and the tilt of this relation is only significant for bottom-heavy IMFs (cf. Section 3.2). The presence of a color-mass relation among metal-rich GCs in giant ellipticals down to masses , as seen in the large sample of Mieske et al. (2010), therefore seems to indicate that the metal-rich GCs in giant ellipticals were formed with a bottom-heavy IMF (). This result reinforces the conclusions of Paper I as well as those of various recent galaxy studies based on gravity-sensitive spectral features in the red part of the optical spectrum (e.g., van Dokkum & Conroy, 2010; Conroy & van Dokkum, 2012; Smith et al., 2012) and dynamical values that exceed those predicted by stellar population models based on a Kroupa IMF (e.g., Cappellari et al., 2012; Tortora et al., 2013; Läsker et al., 2013).
4.3. Comparison to Previous Studies
As to the calculations of the effects of GC self-enrichment done in Section 4.1, the main differences between our results and those of both BH09 itself and Mieske et al. (2010) are related to the treatment of GC mass loss. Specifically, BH09 did not take GC mass loss into account when comparing their simulations with observed GC color-magnitude relations in giant elliptical galaxies. Mieske et al. (2010) did implement an aspect of GC mass loss, using the GC dissolution scenario of Jordán et al. (2007b) to estimate GC mass loss. However, the latter study only considered GC mass loss due to two-body relaxation and hence did not incorporate the important effect of mass loss due to stellar evolution ( 40% of the initial mass for a Kroupa or Chabrier IMF at an age of 12 Gyr: see, e.g., Bruzual & Charlot 2003 or Maraston 2005; see also Fig. 5). The impact of a full treatment of GC mass loss (and its dimming effect) on self-enrichment estimates is significant. One illustration of this is that Mieske et al. (2010) noted two main apparent problems with their implementation of the reference model of BH09 in reproducing the blue tilt seen among GCs in giant ellipticals: (i) the model predicts self-enrichment to become important only at masses whereas the blue tilt starts at a mass that is an order of magnitude lower, and (ii) the mass-metallicity relation predicted by the model is significantly more pronounced in the self-enrichment regime than the observed blue tilt. Consequently, Mieske et al. (2010) looked into changes to the assumptions of the radial density profile and star formation efficiency in the reference BH09 model to improve the agreement of the model predictions with the data. In particular, Mieske et al. needed to make the radial density profile of the protocluster cloud significantly steeper than an isothermal profile to make the self-enrichment model fit the observed MMR, which seems physically unlikely. However, as shown in Fig. 6, the implementation of a full treatment of GC mass loss (for which the impact to the mass-metallicity relation depends on GC mass as well as the IMF) renders a situation where the reference BH09 model reproduces the blue tilt exhibited by the massive GCs very well.
4.4. Dependence on Model Assumptions and Ingredients
In this Section we assess to what extent our results shown in Fig. 6 might depend on the assumptions and ingredients of the color-metallicity relation and the GC dynamical evolution model used to derive them.
4.4.1 The Color-Metallicity Relation
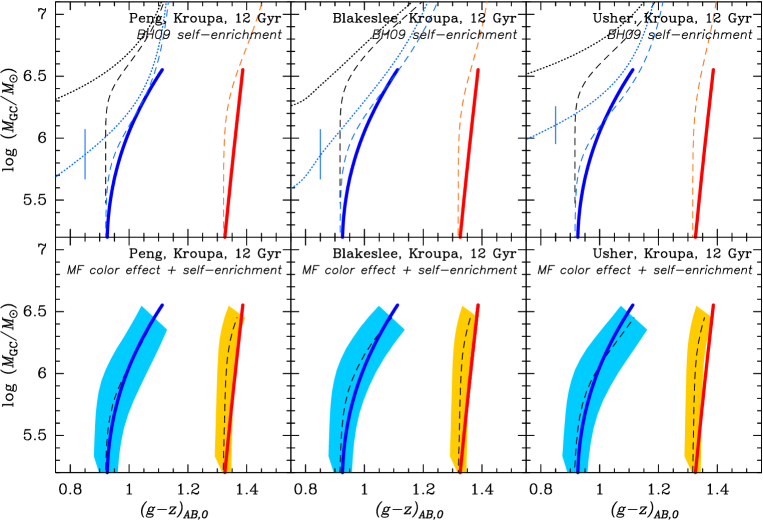
To translate metallicity variations into color changes in Section 4.1, we followed Mieske et al. (2010) and used the broken linear function of Peng et al. (2006) which was derived from integrated-light and -band photometry of 95 GCs in the Milky Way, M49, and M87 that have spectroscopic metallicities. However, the scatter in the Peng et al. relation is significant, especially at intermediate metallicities () and supersolar ones, and uncertainties of several individual data points are substantial. To assess the uncertainty associated with the choice of a particular [Z/H] – () relation, we apply two other such relations from the recent literature for comparison purposes: (i) the quartic polynomial function of Blakeslee et al. (2010), which was derived from the same data as the Peng et al. (2006) function, and (ii) the broken linear function of Usher et al. (2012), which was derived from an independent empirical database of colors and spectroscopic metallicities of 903 extragalactic GCs.
As might be expected, the three [Z/H] – () relations imply different amounts of GC pre-enrichment needed to let the mean color of the modeled blue and red tilts agree with the observed ones. Specifically, the Blakeslee et al. (2010) relation implies [Zpre/H] = 1.37 and [Zpre/H] = -0.22 for the blue and red GCs, respectively, while the [Zpre/H] values are 1.20 and 0.18 when using the Usher et al. (2012) relation.
The sensitivity of our results to the choice of a given different color-metallicity relation is illustrated in Figure 7, which consists of three copies of Figs. 6c and 6f, one for each color-metallicity relation. While the resulting shapes of the blue and red tilts depend somewhat on the color-metallicity relation in a quantitative sense, they are all consistent with one another to within the 1- uncertainties. Moreover, our main results do not change: The addition of the effect of 12 Gyr of GC mass loss to that of self-enrichment yields a good fit to the observed blue tilt, while the shape of the observed red tilt indicates a bottom-heavy IMF at sub-solar masses for the metal-rich population.
4.4.2 The GC Dynamical Evolution Model
To estimate the variation in the effects of 12 Gyr of GC mass loss among different GC dynamical evolution models, we compare the K09 model with that of Fall & Zhang (2001, hereafter FZ01). The main difference between these two models is that FZ01 employs a constant, GC mass-independent value for the (present-time) to compare model masses with observed luminosities, while K09 uses GC mass-dependent mass loss rates that result in GC mass-dependent rates (see Fig. 1). The two models also use different parametrizations of GC mass loss by two-body relaxation, and K09 incorporates a prescription of the effect of stellar remnant retention which FZ01 did not. However, in spite of these different model ingredients, the only significant differences between the GC mass functions (GCMFs) for the Galactic GC system at an age of 12 Gyr as inferred by the two models show up at low GC masses (, see Kruijssen & Portegies Zwart, 2009). For the massive GCs considered in this paper (), the difference between the GCMFs inferred by the two models are only of order 10% for any given mass bin, which is within the 1 Poisson error bars (see Figure 8). Since these differences are smaller than the differences between K09 models with different values of dissolution timescales employed in this paper (illustrated by the blue error bars in Figs. 6a – 6c), we believe our results on the amounts of GC mass loss, and their uncertainties, are robust.

4.5. Effect of GC Dissolution Timescale
As mentioned in the introduction, the color-mass relations among GCs show environmental dependencies (Mieske et al., 2010). Firstly, GCs associated with high-mass galaxies exhibit more pronounced blue and red tilts than do GCs in lower-mass galaxies. Secondly, the blue tilt is found to be more pronounced among GCs at smaller galactocentric distances than among those further out. One might expect such environmental dependences to exist among ancient GC systems due to dynamical evolution (i.e., tidal shocks and two-body relaxation), as tidal fields are stronger in more massive galaxies and at smaller galactocentric distances. A recent illustration of this effect was shown by Madrid et al. (2012) who performed N-body simulations of GCs in a realistic Milky Way-like potential and found a strong trend of increasing mass loss with decreasing galactocentric distance for a given type of GC (initial mass, half-mass radius, concentration; see also Vesperini & Heggie, 1997).
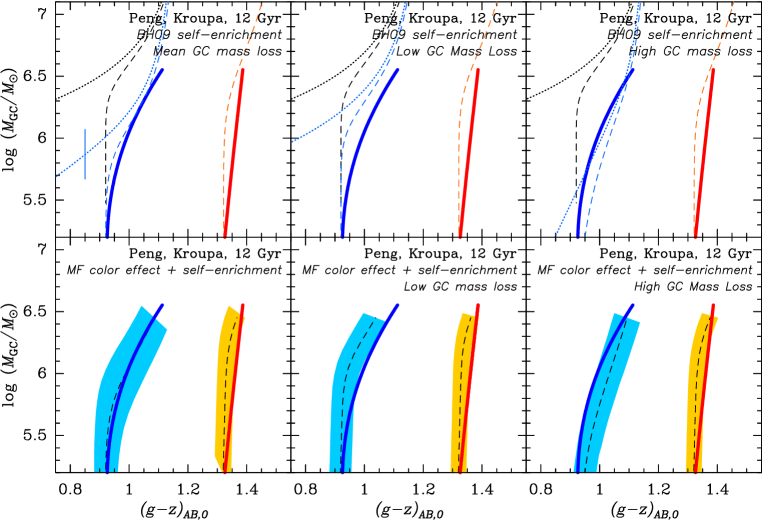
To simulate the effect of environmentally varying GC dissolution timescales on the color-mass relations among GCs for a given IMF, we select GCs whose cumulative mass loss over 12 Gyr of stellar and dynamical evolution are at the 20% and 80% percentiles of the range found among the GC families considered in this paper (see Figure 5c), and compare the resulting color-mass relations with that derived for the “average” K09 model. This comparison is depicted in Figure 9 for the case of the Kroupa IMF and the Peng et al. (2006) color-metallicity relation. It is obvious that the shape of the blue tilt is indeed sensitive to the amount of cumulative GC mass loss (and its impact on self-enrichment in the observed color-mass frame): the blue tilt only shows up for for the “low” mass loss case while it is present and pronounced all the way down to the minimum mass of the GC sample for the “high” mass loss case. Note that this behavior is entirely consistent with the observed environmental dependencies of the blue tilt found by Mieske et al. (2010).
Note also that in contrast with the blue tilt, the dependence of the shape of the red tilt on the cumulative amount of GC mass loss is negligible in terms of the impact of GC mass loss on self-enrichment in the observed color-mass frame. This suggests that the presence of the red tilt in massive ellipticals and its absence in low-mass ellipticals is not mainly due to differences in cumulative GC mass loss. Instead, we suggest that it indicates that metal-rich GCs in massive ellipticals were formed with a bottom-heavy IMF, as already mentioned in Section 4.2.
4.6. Differences in Blue Tilts Between Giant Elliptical Galaxies
Several studies of the blue tilt in giant elliptical galaxies have pointed out that the color-magnitude relations among metal-poor GCs can vary significantly from galaxy to galaxy, even among massive galaxies with similar luminosities. A well-known case in point is M49, the brightest giant elliptical galaxy in the Virgo cluster, which does not show an obvious blue tilt whereas NGC 1399 and M87, two other giant elliptical galaxies with similar luminosities, do (Strader et al., 2006; Mieske et al., 2006, 2010). While such differences might seem difficult to reconcile within a scenario in which the mass-metallicity relation among massive GCs is primarily due to self-enrichment, one should consider the following.
First and foremost, we emphasize that the main purpose of this study has been to compare calculations of the impact of GC mass loss and self-enrichment to the average color-mass relations among GCs in a large sample of giant elliptical galaxies. Several factors render averaging over many galaxies a necessity in this context. As shown and discussed above, 12 Gyr of dynamical evolution can cause several differences between different families of GCs (especially for the case of bottom-heavy IMFs). One example of such differences is the relative amount of mass lost (see Section 4.5 and Figs. 5 and 9). This results in a spread of current luminosities among GCs that started out with a given initial mass, and hence with a similar amount of self-enrichment. Another property that is quite sensitive to the initial GC conditions is the change of the slope of stellar mass function at subsolar masses and its associated change of integrated color after 12 Gyr (see Figs. 1a – c and 2 as well as Paper I). The 1- uncertainties associated with these two effects in the color-mass plane are indicated in Figs. 6d – f. Last but not least, there is a significant scatter among colors of metal-poor GCs in individual giant ellipticals (; e.g., Harris et al. 2006), which translates to . This is most likely mainly due to a spread in pre-enrichment levels (e.g., BH09). For GCs near the massive end of the GC mass function (where GCs are scarce and hence stochastic variations between GCs are significant), the impact of this scatter on the resulting color-mass relation can be significant, especially for galaxies with relatively small specific GC frequencies. Note in this respect that M49 hosts significantly fewer GCs than NGC 1399 and M87 do, see Figure 3 of Mieske et al. (2010).
That said, important steps forward in the context of understanding the nature of the color-mass relations of GCs as well as their variations between galaxies can already be made with currently available instrumentation. One such step will be to obtain accurate photometry and size measurements of GCs outside the central few kpc sampled by the currently available HST observations of nearby giant ellipticals (typically only a central pointing). This will not only yield color-magnitude data for GCs in weaker tidal fields which will allow one to evaluate differences in sizes and hence in dynamical evolution (e.g., Fall & Zhang, 2001; McLaughlin & Fall, 2008; Goudfrooij, 2012). The lower background levels of the underlying diffuse galaxy light in the outer regions will also allow high-S/N measurements of spectroscopic metallicities of GCs in the upper 3 mag of the GC luminosity function with 8-10 m class telescopes (e.g., Puzia et al., 2005; Cenarro et al., 2007). The latter will be important to decipher the true color-metallicity relation (rather than one derived from colors and [Fe/H] values of Galactic GCs; for example, the few Galactic GCs that are moderately metal-rich () have significant foreground extinction) and its impact on the nature of the blue tilt.
5. Summary and Conclusions
Driven by several lines of recent evidence for a “bottom-heavy” stellar IMF in massive elliptical galaxies, we have investigated the influence of the shape of the IMF on the color-magnitude relations for the metal-poor and metal-rich subpopulations of GCs in such galaxies. To this end we used mass loss calculations for GCs for three IMF shapes and a large range of initial GC masses, in conjunction with calculations of integrated-light colors from isochrones. These calculations were used for two main purposes: (i) to evaluate the effect of evolution of the stellar mass function at subsolar masses on the color-magnitude relations, and (ii) to evaluate the impact of GC mass loss on the Bailin & Harris (2009, BH09) model of GC self-enrichment when comparing model predictions to observed color-magnitude diagrams. Our results are compared to observed color-magnitude relations among a very large set of GCs in giant elliptical galaxies from Mieske et al. (2010). Our main conclusions are as follows.
-
•
As to the observed color-magnitude relation among the metal-rich GCs in giant elliptical galaxies (often referred to as the “red tilt”), we found that the effect of dynamical evolution of GCs on the stellar mass functions over a Hubble time can explain the observed slope of the red tilt along its full extent if (and only if) the IMF was bottom-heavy (e.g., in at subsolar masses).
-
•
Conversely, we find that GC self-enrichment is only able to cause a small reddening for the most massive metal-rich GCs (i.e., current masses ). Hence we argue that the observed color-magnitude relation among metal-rich GCs in massive elliptical galaxies constitutes evidence for a bottom-heavy IMF in such galaxies.
-
•
As to the “blue tilt” among metal-poor GCs, we find that the influence of dynamical evolution of GCs on the stellar mass functions over a Hubble time can reproduce the observed tilt only up to a current GC mass , and only if the IMF was bottom-heavy. Beyond this mass, the observed blue tilt is more pronounced than what can be explained by the evolution of stellar mass functions in GCs, so that additional effects (such as self-enrichment) are still required to reproduce the full extent of the observed blue tilt.
-
•
When considering the dimming effect of 12 Gyr of mass loss in color-magnitude diagrams of GCs, we find that the “reference” GC self-enrichment model of BH09 reproduces the shape of the observed blue tilt very well in the cases of Kroupa or Salpeter IMFs. This result differs from those of previous studies, which did not take GC mass loss by stellar evolution into account.
-
•
When adding the simulated effects of GC self-enrichment and the evolution of stellar mass functions in metal-poor GCs on their colors, the resulting color-mass relation becomes consistent with the observed blue tilt for all IMF shapes considered here. This result is due to the fact that while the effect of the GC mass-dependent evolution of stellar mass functions to the colors is significantly stronger for steep IMFs (e.g., 3.0) than for Salpeter or Kroupa IMFs, the opposite is true for the effect of GC mass loss due to stellar evolution, and the two effects cancel out each other to within the uncertainties.
-
•
We looked into the sensitivity of our results to the choice of the color-metallicity relation. While details such as the mean pre-enrichment metallicity required to make our modeled color-mass relations fit the observed blue and red tilts do differ slightly among color-metallicity relations from the recent literature, the shapes of the modeled color-mass relations are found to be consistent from one color-metallicity relation to another. Similarly, the sensitivity of our results to the choice of GC dynamical evolution model was found to be insignificant in the relevant range of GC masses.
-
•
Differences in cumulative GC mass loss expected for different galactic environments (e.g., inner versus outer regions of massive galaxies) are found to affect the shape of the blue tilt in a way that is qualitatively consistent with the observed variations. However, the impact of varying GC mass loss on the shape of the red tilt is found to be negligible.
We argue that further insights into the color-magnitude relations of GCs as well as their variations between galaxies can be obtained by means of high-resolution imaging as well as high-S/N spectroscopy of GCs outside the central few kpc sampled by the currently available HST observations of nearby giant ellipticals. With such information, one will be able to constrain the true color-metallicity relation as well as environmental influences on the properties of the blue tilt.
References
- Bailin & Harris (2009) Bailin, J., & Harris, W. E. 2009, ApJ, 695, 1082 (BH09)
- Baumgardt & Makino (2003) Baumgardt, H., & Makino, J. 2003, MNRAS, 340, 227
- Bellazzini et al. (2008) Bellazzini, M., Ibata, R. A., Chapman, S. C., et al. 2008, AJ, 136, 1147
- Blakeslee et al. (2010) Blakeslee, J. P., Cantiello, M., & Peng, E. W. 2010, ApJ, 710, 51
- Brodie & Strader (2006) Brodie, J. P., & Strader, J. 2006, ARA&A, 44, 193
- Brodie et al. (2012) Brodie, J. P., Usher, C., Conroy, C., et al. 2012, ApJ, 759, L33
- Bruzual & Charlot (2003) Bruzual, G. A. & Charlot, S. 2003, MNRAS, 344, 1000
- Cappellari et al. (2012) Cappellari, M., McDermid, R. M., Alatalo, K., et al. 2012, Nature, 484, 485
- Carretta et al. (2010a) Carretta, E., Bragaglia, A., Gratton, R. G., et al. 2010a, A&A, 516, A55
- Carretta et al. (2010b) Carretta, E., Bragaglia, A., Gratton, R. G., et al. 2010b, ApJ, 714, L7
- Chabrier (2003) Chabrier, G. 2003, PASP, 115, 763
- Cenarro et al. (2007) Cenarro, A. J., Beasley, M. A., Strader, J., Brodie, J. P., & Forbes, D. A. 2007, AJ, 134, 391
- Cohen et al. (2003) Cohen, J. G., Blakeslee, J. P., & Côté, P. 2003, ApJ, 592, 866
- Conroy & van Dokkum (2012) Conroy, C., & van Dokkum, P. G. 2012, ApJ, 760, 71
- Côté et al. (2004) Côté, P., Blakeslee, J. P., Ferrarese, L., et al. 2004, ApJS, 153, 223
- de Marchi et al. (2007) de Marchi, G., Paresce, F., & Pulone, L. 2007, ApJ, 656, L65
- Fall & Zhang (2001) Fall, S. M., & Zhang, Q. 2001, ApJ, 561, 751 (FZ01)
- Fall et al. (2009) Fall, S. M., Chandar, R., & Whitmore, B. C. 2009, ApJ, 704, 453
- Fellhauer et al. (2006) Fellhauer, M., Kroupa, P., & Evans, N. W. 2006, MNRAS, 372, 338
- Forbes et al. (2010) Forbes, D. A., Spitler, L. R., Harris, W. E., et al. 2010, MNRAS, 403, 429
- Geisler et al. (1996) Geisler, D., Lee, M. G., & Kim, E. 1996, AJ, 111, 1529
- Georgiev et al. (2009) Georgiev, I. Y., Hilker, M., Puzia, T. H., Goudfrooij, P., & Baumgardt, H. 2009, MNRAS, 396, 1075
- Gieles et al. (2011) Gieles, M., Heggie, D. C., & Zhao, H. 2011, MNRAS, 413, 2509
- Goudfrooij (2012) Goudfrooij, P. 2012, ApJ, 750, 140
- Goudfrooij et al. (2004) Goudfrooij, P., Gilmore, D., Whitmore, B. C., & Schweizer, F. 2004, ApJ, 613, L121
- Goudfrooij & Kruijssen (2013) Goudfrooij, P., & Kruijssen, J. M. D. 2013, ApJ, 762, 107 (Paper I)
- Goudfrooij et al. (2007) Goudfrooij, P., Schweizer, F., Gilmore, D., & Whitmore, B. C. 2007, AJ, 133, 2737
- Gratton et al. (2012) Gratton, R. G., Carretta, E., & Bragaglia, A. 2012, A&A Rev., 20, 50
- Harris (1996) Harris, W. E. 1996, AJ, 112, 1487
- Harris et al. (2006) Harris, W. E., Whitmore, B. C., Karakla, D., et al. 2006, ApJ, 636, 90
- Harris et al. (2009) Harris, W. E., Kavelaars, J. J., Hanes, D. A., Pritchet, C. J., & Baum, W. A. 2009, AJ, 137, 3314
- Harris et al. (2010) Harris, W. E., Spitler, L. R., Forbes, D. A., & Bailin, J. 2010, MNRAS, 401, 1965
- Hénon (1969) Hénon, M. 1969, A&A, 2, 151
- Johnson & Pilachowski (2010) Johnson, C. I., & Pilachowski, C. A. 2010, ApJ, 722, 1373
- Jordán et al. (2007a) Jordán, A., Blakeslee, J. P., Côté, P., et al. 2007a, ApJS, 169, 213
- Jordán et al. (2007b) Jordán, A., McLaughlin, D. E., Côté, P., et al. 2007b, ApJS, 171, 101
- Jordán et al. (2009) Jordán, A., Peng, E. W., Blakeslee, J. P., et al. 2009, ApJS, 180, 54
- King (1966) King, I. R. 1966, AJ, 71, 64
- Kirby et al. (2008) Kirby, E. N., Guhathakurta, P., & Sneden, C. 2008, ApJ, 682, 1217
- Kroupa (2001) Kroupa, P. 2001, MNRAS, 322, 231
- Kruijssen (2009) Kruijssen, J. M. D. 2009, A&A, 507, 1409 (K09)
- Kruijssen & Lamers (2008) Kruijssen, J. M. D. & Lamers, H. J. G. L. M. 2008, A&A, 490, 151
- Kruijssen & Portegies Zwart (2009) Kruijssen, J. M. D., & Portegies Zwart, S. F. 2009, ApJ, 698, L158
- Kruijssen et al. (2012) Kruijssen, J. M. D., Pelupessy, F. I., Lamers, H. J. G. L. M., et al. 2012, MNRAS, 421, 1927
- Kundu (2008) Kundu, A. 2008, AJ, 136, 1013
- Lamers et al. (2005) Lamers, H. J. G. L. M., Gieles, M., Bastian, N., et al. 2005, A&A, 441, 117
- Läsker et al. (2013) Läsker, R., van den Bosch, R. C. E., van den Ven, G., et al. 2013, MNRAS, 434, L31
- Madrid et al. (2012) Madrid, J. P., Hurley, J. R., & Sippel, A. C. 2012, ApJ, 756, 167
- Maraston (2005) Maraston, C. 2005, MNRAS, 362, 799
- Marino et al. (2011) Marino, A. F., Sneden, C., Kraft, R. P., et al. 2011, A&A, 532, A8
- Marigo et al. (2008) Marigo, P., Girardi, L., Bressan, A., et al. 2008, A&A, 482, 883
- McLaughlin & Fall (2008) McLaughlin, D. E., & Fall, S. M. 2008, ApJ, 679, 1272
- McLaughlin & van der Marel (2005) McLaughlin, D. E., & van der Marel, R. P. 2005, ApJS, 161, 304
- Mieske & Baumgardt (2007) Mieske, S. & Baumgardt, H. 2007, A&A, 475, 851
- Mieske et al. (2006) Mieske, S., Jordán, A., Côté, P., et al. 2006, ApJ, 653, 193
- Mieske et al. (2010) Mieske, S., Jordán, A., Côté, P., et al. 2010, ApJ, 710, 1672
- Morgan & Lake (1989) Morgan, S., & Lake, G. 1989, ApJ, 339, 171
- Norris & Da Costa (1995) Norris, J. E., & Da Costa, G. S. 1995, ApJ, 447, 680
- Paust et al. (2010) Paust, N. E. Q., Reid, I. N., Piotto, G., et al. 2010, AJ, 139, 476
- Peng et al. (2006) Peng, E. W., Jordán, A., Côté, P., et al. 2006, ApJ, 639, 95
- Peng et al. (2009) Peng, E. W., Jordán, A., Blakeslee, J. P., et al. 2009, ApJ, 703, 42
- Peng et al. (2011) Peng, E. W., Ferguson, H. C., Goudfrooij, P., et al. 2011, ApJ, 730, 23
- Puzia et al. (2005) Puzia, T. H., Kissler-Patig, M., Thomas, D., et al. 2005, A&A, 439, 997
- Puzia et al. (2006) Puzia, T. H., Kissler-Patig, M., & Goudfrooij, P. 2006, ApJ, 648, 383
- Recchi & Danziger (2005) Recchi, S., & Danziger, I. J. 2005, A&A, 436, 145
- Salpeter (1955) Salpeter, E. E. 1955, ApJ, 121, 161
- Sarajedini & Layden (1995) Sarajedini, A., & Layden, A. C. 1995, AJ, 109, 1086
- Shetrone et al. (2001) Shetrone, M. D., Côté, P., & Sargent, W. L. W. 2001, ApJ, 548, 592
- Smith et al. (2012) Smith, R. J., Lucey, J. R., & Carter, D. 2012, MNRAS, 421, 2982
- Sonnenfeld et al. (2012) Sonnenfeld, A., Treu, T., Gavazzi, R., et al. 2012, ApJ, 752, 163
- Spitler et al. (2006) Spitler, L. R., Larsen, S. S., Strader, J., et al. 2006, AJ, 132, 1593
- Strader & Smith (2008) Strader, J., & Smith, G. H. 2008, AJ, 136, 1828
- Strader et al. (2006) Strader, J., Brodie, J. P., Spitler, L. R., & Beasley, M. A. 2006, AJ, 132, 2333
- Tortora et al. (2013) Tortora, C., Romanowsky, A. J., & Napolitano, N. R. 2013, ApJ, 765, 8
- Usher et al. (2012) Usher, C., Forbes, D. A., Brodie, J. P., et al. 2012, MNRAS, 426, 1475
- VandenBerg et al. (2007) Vandenberg, D. A., Gustaffson, B., Edvardsson, B., Eriksson, K., & Ferguson, J. 2007, ApJ, 666, L105
- van Dokkum & Conroy (2010) van Dokkum, P. G., & Conroy, C. 2010, Nature, 468, 940
- Vesperini & Heggie (1997) Vesperini, E., & Heggie, D. C. 1997, MNRAS, 289, 898
- Waters et al. (2009) Waters, C. Z., Zepf, S. E., Lauer, T. R., & Baltz, E. A. 2009, ApJ, 693, 463
- Zaritsky et al. (2013) Zaritsky, D., Colucci, J. E., Pessev, P. M., Bernstein, R. A., & Chandar, R. 2012, ApJ, 761, 93
- Zinn & West (1984) Zinn, R. J., & West, M. J. 1984, ApJS, 55, 45