ASTROMETRY IN THE GALACTIC CENTER WITH THE THIRTY METER TELESCOPE
Abstract
We report on the expected astrometric performance of the Thirty Meter Telescope’s InfraRed Imaging Spectrometer (IRIS) as determined using simulated images of the Galactic center. This region of the Galaxy harbors a supermassive black hole and a dense nuclear stellar cluster, thus providing an ideal laboratory for testing crowded-field astrometry with the IRIS imager. Understanding the sources of astrometric error is also important for making precision measurements of the short-period stars orbiting the supermassive black hole in order to probe the curvature of space-time as predicted by General Relativity. Various sources of error are investigated, including read-out and photon noise, spatially variable point spread functions, confusion, static distortion for the IRIS imager, and the quadratic probe arm distortion. Optical distortion is the limiting source of error for bright stars ( 15), while fainter sources will be limited by the effects of source confusion. A detailed astrometric error budget for the Galactic center science case is provided.
1 Introduction
The InfraRed Imaging Spectrometer (IRIS; Larkin et al. [5]) is a first-light instrument for the Thirty Meter Telescope (TMT) that will operate behind the Narrow-Field Infrared Adaptive Optics System (NFIRAOS; Herriot et al. [4]) and that will provide images with the highest resolution and Strehl ever taken in the infrared. The imaging camera will operate at wavelengths = 0.8 - 2.5 m with a plate scale of 4 mas/pixel and a field of view of 172 172. At = 2 m, the diffraction-limited resolution of 14 mas will be achieved, which will allow for unprecedented astrometric precision.
The astrometric performance of IRIS can be tested using simulations of the Galactic center (GC), which harbors a supermassive black hole (SMBH) and a dense nuclear stellar cluster. In this report, various sources of astrometric error are investigated for single-epoch observations of the GC, and a detailed astrometric error budget for this science case is provided. Future work will include multi-epoch simulations in order to determine the precision with which post-Newtonian effects in the orbits of short-period stars can be measured.
2 Methods
A series of systematic tests are performed, each of which investigates the contributions of individual error sources to the astrometric precision of stars in the Galactic center. The sources of error are incorporated in single-epoch simulated images, and include:
-
•
photon, detector, and thermal noise,
-
•
On-Instrument Wave Front Sensor (OIWFS) probe arm positioning error,
-
•
static distortion,
-
•
the combination of probe arm and static distortion,
-
•
source confusion.
2.1 Simulated Images of the Galactic Center
Ten PSF images of 20 seconds each were simulated by the TMT Adaptive Optics group. These ten phase screen realizations of spatially-variable PSFs (a grid of PSFs constant over 22′′) were computed specifically for a chosen guide star constellation at the GC with the following offsets from Sgr A*: (, ) = (15.3′′,-10.9′′), (-9.5′′, 11.8′′), and (-5.9′′, -17.6′′). The Strehl ratio of the simulated PSFs ranged from 70-80%. In addition, each PSF was computed for five specific near-infrared wavelengths (1.908, 2.067, 2.12, 2.173, 2.332 m). The GC observations will most likely be carried out using a narrow-band filter in order to avoid saturation. However, selecting a single wavelength leads to a highly-structured and unrealistic halo dominated by diffraction effects (“satellite spots”). This is somewhat unrealistic since those features will get smeared out for three reasons: (1) they will rotate with galactic angle, (2) the wavelength interval is small but finite, and (3) an implementation error (not accounted for here) will lead to more diffuse flux in the halo. Thus, we have chosen to mimic these three effects by averaging over all five wavelengths and including noise properties of the narrowband filter ( = 2.27 m, = 0.03 m). The background magnitude is estimated at = 13.4 mag. Each image is simulated using one of the ten phase screen realizations of spatially-variable PSFs. The resulting images are 40964096 pixels with a plate scale of 4 mas/pixel. In some tests, we also simulate images with a constant PSF over the field, in which case a single PSF is selected from the available grid.
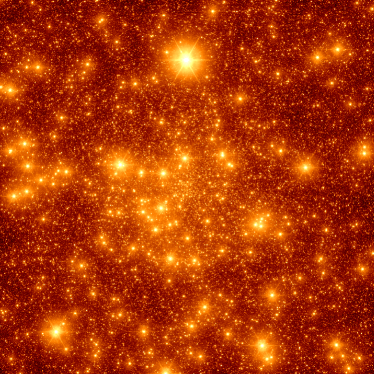
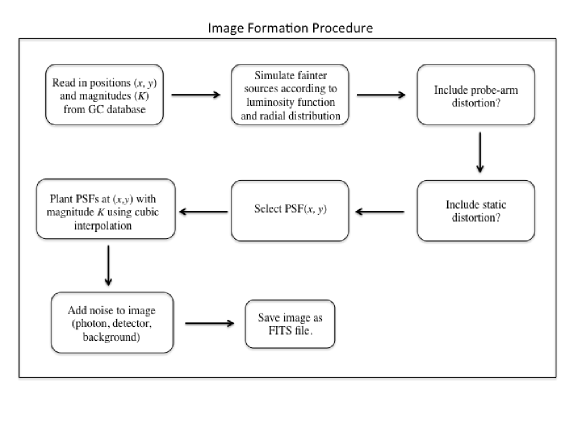
Galactic center simulated images include the catalog of 2500 known stars based on Keck observations ( 20) that cover a 1717′′ field roughly centered on the SMBH, Sgr A* (e.g., Yelda et al. [7]). For testing the effects of source confusion, images were also simulated to include fainter stars down to = 24 that will be detectable by the TMT (Figure 1). The fainter stars follow the observed radial profile of the late-type stars in the GC and we assume the K-band luminosity function of the Galactic bulge as found by Zoccali et al. [8]. Details regarding the image simulator, including calculations of the background, dark current, and read noise, can be found in Do et al. [3]. The general steps taken to produce a simulated image of the Galactic center are illustrated in the block diagram in Figure 2.
2.2 Astrometry
Stars are identified and their positions are extracted from all images using the PSF fitting algorithm StarFinder [2], which is optimized for AO observations of crowded stellar fields to identify and characterize stars in the field of view. The user has the option of feeding in a PSF model if it is known, or estimating the PSF from the image itself (both methods are tested here). In the latter case, StarFinder iteratively constructs the model based on a set of user-selected stars in the field. For the GC, we use a set of 25 bright, relatively isolated stars across the field. StarFinder then cross-correlates the model PSF with the image in order to identify sources in the field. The correlation threshold is set to 0.8 for images involving only the known GC sources, and 0.6 for images that include the theorized fainter population.
To estimate the contribution of each error source to the error budget, the list of input positions is compared to the list of positions extracted from the image. The difference between each star’s positions across the two lists is computed, and the standard deviation of these offsets (, ) for stars brighter than = 17 is reported.
3 Error Sources
3.1 Photon & Detector Noise
Each simulated image includes photon, detector, and thermal noise, the combination of which may impact astrometry. To estimate this impact, we compare the extracted stellar positions to the input positions used to simulate an individual frame (tint = 20 s). In this case, the image is created using a constant PSF over the detector, as our current version of StarFinder assumes a constant PSF for the astrometric analysis. Using the known PSF to extract positions, we find a distribution of offsets peaked near zero with a standard deviation along the and coordinates of (, ) = (0.00106, 0.00103) pix = (4.2, 4.1) as. Taking the average of the and offsets gives 4.2 as, which we attribute to the photon, detector, and thermal noise in the images. This base-level is removed in quadrature from all subsequent analyses that compare the input and output positions, as these noise sources are included in all simulated images.
3.2 Guide Probe Arm Positioning
Errors in the IRIS On-Instrument Wave Front Sensor (OIWFS) guide probe positioning can introduce distortion errors in astrometric measurements. Here we test this effect by incorporating the predicted error into the positions of Galactic center stars.
The three relatively bright and isolated guide stars that were selected have the following positions relative to Sgra A*: (, ) = (2.063′′, -29.792′′), (, ) = (-16.857′′, 15.379′′), and (, ) = (35.000′′, 16.000′′). We assume that the RMS error in the probe arm positioning is 2 mas, and for each guide star we randomly sample an error from a Gaussian distribution centered on 0 mas with a 1 spread of 2 mas. The positions in the catalog of the known stars in the GC were then distorted by applying the quadratic distortion model described in Schöck [6].
As a simple test of our ability to retrieve the original (undistorted) positions, the distorted positions were transformed to a reference frame defined by the original catalog of positions, allowing for translation, rotation, and a plate scale (independent in X and Y). The offsets between the transformed and the original positions have a standard deviation of 5 10-5 pixels in each coordinate (0.2 as). As the precision of our star lists is given to the 10-5 pixel-level, this is likely an upper limit. We therefore conclude that the effect of the probe arm positioning errors can be entirely corrected for using a 1st-order (6-term) transformation.
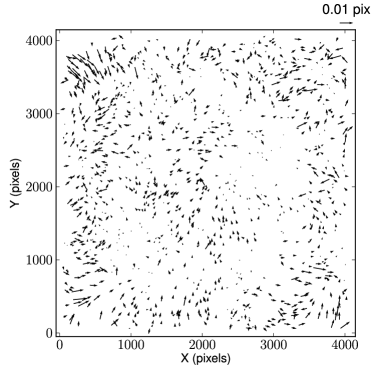
3.3 Static Distortion
The static optical distortion of the IRIS imager was estimated with Zemax modeling and is shown in Figure 3. The distortion is shown for a grid of 13 13 positions on the detector, which is the planned configuration for the pinhole mask. We estimate that the pinholes will be drilled with a precision of better than 15 as111The precision with which the pinholes will be drilled may, in reality, be larger than the 15 as assumed here. However, using a self-calibration method similar to that used by Anderson & King [1], the distortion is expected to be known to better than this value. and it is assumed that this is a random Gaussian error independent from pinhole to pinhole.
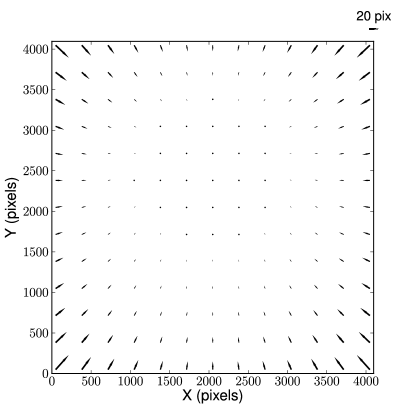
The pinhole mask limits distortion measurements to a grid of positions spaced every 315 pixels and we must therefore interpolate between these locations in order to find the best representation of the distortion over the entire detector. We use a 5th order bivariate B-spline using the SciPy package interpolate. Tests of this method reveal an interpolation error of 4.2 as.
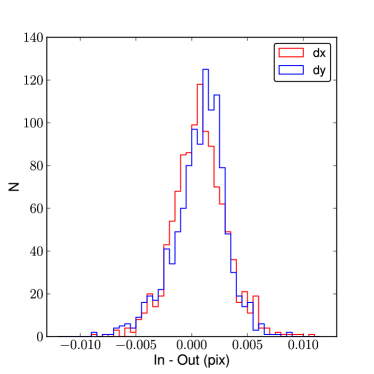
Optical distortion will be taken into account in Galactic center astrometry by correcting the stellar positions measured from a distorted image. We therefore simulate such an image by distorting the positions in the catalog of known stars in the GC using the interpolation method described above. For simplicity, a spatially constant PSF is used to plant the stars. The positions are extracted from the image by StarFinder using the same PSF model and then corrected for distortion. The difference between the original catalog of positions and these corrected positions is shown in Figure 4. The distributions of residuals have a 1 width of (, ) = (0.00238, 0.00238) pix = (9.5, 9.5) as. After subtracting in quadrature the error associated with photon, detector, and thermal noise (4.2 as), we find that the error due to residual distortion is 8.5 as.
An additional analysis was carried out in which both the probe arm and static distortion were included in the simulated image. The stellar positions were again retrieved at the 8.5 as level.
3.4 Source Confusion
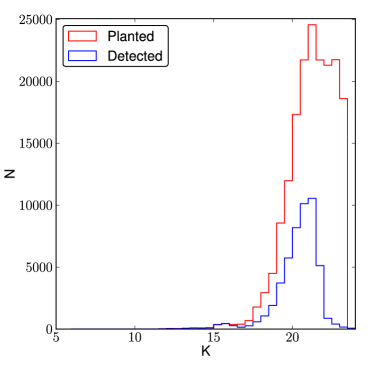
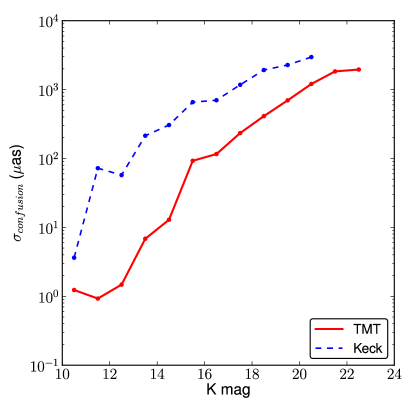
The TMT will achieve much higher sensitivities than current 8-10 m class telescopes, allowing for the detection of stars up to 3-4 magnitudes fainter than what is seen today. If we extrapolate from the K-band luminosity function of the Galactic bulge (Zoccali et al. [8]), we find that the increased sensitivity of TMT will result in the detection of two orders of magnitude more stars in the central parsec of the Galaxy (i.e., from 2500 to 200,000 stars). The presence of these additional stars can lead to source confusion, which in turn can introduce significant biases in astrometric measurements.
We examine the effects of confusion (from both detected and undetected sources) using a simulated image that includes the known GC stars as well as the theorized, fainter population (Figure 1, right). While 200,000 stars were planted, 40% of the stars were detected by StarFinder at the 0.6 correlation threshold222Lower correlations were tested and resulted in the detection of a large number of spurious sources (see Yelda et al. [7]).. The extracted positions were compared to the locations in which the stars were planted. Figure 5 shows the results, where we take the RMS error of the input - output positions within a magnitude bin of = 1. The effects of confusion for the Keck telescope are also plotted for comparison. While confusion introduces a smaller error for TMT astrometry as compared to that of the Keck telescope, it does become a significant term ( 10 as) in the TMT error budget for relatively faint stars (15). For brighter stars, source confusion will remain below 10 as and therefore will not be the dominant source of error.
4 Conclusions
Table 1 shows a breakdown of the sources of error that have been investigated in this report and an estimate of each source’s contribution to the astrometric error budget. The dominant source of error in single-epoch observations of the Galactic center is optical distortion ( 10 as) for bright stars ( 15) and source confusion (( 10 as) for faint stars ( 15). Future simulations will include multi-epoch observations in order to infer proper motions and accelerations of the stars in the GC, as well as the orbits of the closest sources to the black hole. It will also be interesting to analyze the precision with which post-Newtonian effects can be measured for the short-period stars.
We thank the Thirty Meter Telescope for supporting this work. We would also like to thank Matthias Schöck, Brent Ellerbroek, and the rest of the TMT Astrometry Working Group and Advisory Group for their helpful suggestions on the simulations presented here.
| Effect | Error (as) |
|---|---|
| Photon, detector, thermal noise (=20 s) | 4.2 |
| PSF estimation error in crowded field w/o anisoplanatism | 3.9 |
| Guide probe positioning | 0.2 |
| Static distortion | 8.5 |
| (Grid interpolation: 4.2 as) | |
| (Distortion modeling error: 5.7 as) | |
| Confusion | |
| K 15: | 1-10 |
| K 15: | 10 |
References
- [1] J. Anderson and I. R. King. An Improved Distortion Solution for the Hubble Space Telescope’s WFPC2. PASP, 115:113–131, January 2003.
- [2] E. Diolaiti, O. Bendinelli, D. Bonaccini, L. Close, D. Currie, and G. Parmeggiani. Analysis of isoplanatic high resolution stellar fields by the StarFinder code. A&AS, 147:335–346, December 2000.
- [3] T. Do, S. A. Wright, A. J. Barth, E. J. Barton, L. Simard, J. E. Larkin, A. M. Moore, L. Wang, B. Ellerbroek. Prospects for measuring supermassive black hole masses with future extremely large telescopes. AJ submitted.
- [4] Herriot, Andersen, Atwood, Byrnes, Boucher, Boyer, Caputa, Correia, Dunn, Ellerbroek, Fitzsimmons, Gilles, Hickson, Hill, Kerley, Pazder, Reshetov, Roberts, Smith, Véran, Wang, and Wevers. TMT NFIRAOS: adaptive optics system for the Thirty Meter Telescope. Proc. SPIE, 8447, 2012.
- [5] Larkin, Moore, Barton, Bauman, Bui, Canfield, Crampton, Delacroix, Fletcher, Hale, Loop, Niehaus, Phillips, Reshetov, Simard, Smith, Suzuki, Usuda, and Wright. The infrared imaging spectrograph (IRIS) for TMT: instrument overview. Proc. SPIE, 7735, 2010.
- [6] M. Schöck. Astrometric Errors Caused by Guide Probe Positioning Errors: Field Position Dependence, TMT Internal Report TMT.AOS.TEC.12.013.REL02. Technical report, May 2012.
- [7] S. Yelda, J. R. Lu, A. M. Ghez, W. Clarkson, J. Anderson, T. Do, and K. Matthews. Improving Galactic Center Astrometry by Reducing the Effects of Geometric Distortion. ApJ, 725:331–352, December 2010.
- [8] M. Zoccali, A. Renzini, S. Ortolani, L. Greggio, I. Saviane, S. Cassisi, M. Rejkuba, B. Barbuy, R. M. Rich, and E. Bica. Age and metallicity distribution of the Galactic bulge from extensive optical and near-IR stellar photometry. AAP, 399:931–956, March 2003.