New nuclear structure features in trans-actinide nuclei.
Abstract
The structural evolution of the heavy nuclei, with , is investigated by looking at the differential variation of the two-neutron separation energies. It indicates, by non-monotonous behavior at certain neutron numbers, structure phenomena such as major shell () and deformed subshell () closures. Another interesting effect is observed at , which is very well correlated with a previously observed, intriguing behavior of quantities measured in alpha decay, such as relative branching ratios and hindrance factors of excited states from the ground state band of deformed nuclei in this region. Corroboration of the existing experimental data indicates another possible deformed subshell closure.
pacs:
21.10.Dr, 23.60.+e, 27.90.+bI Introduction
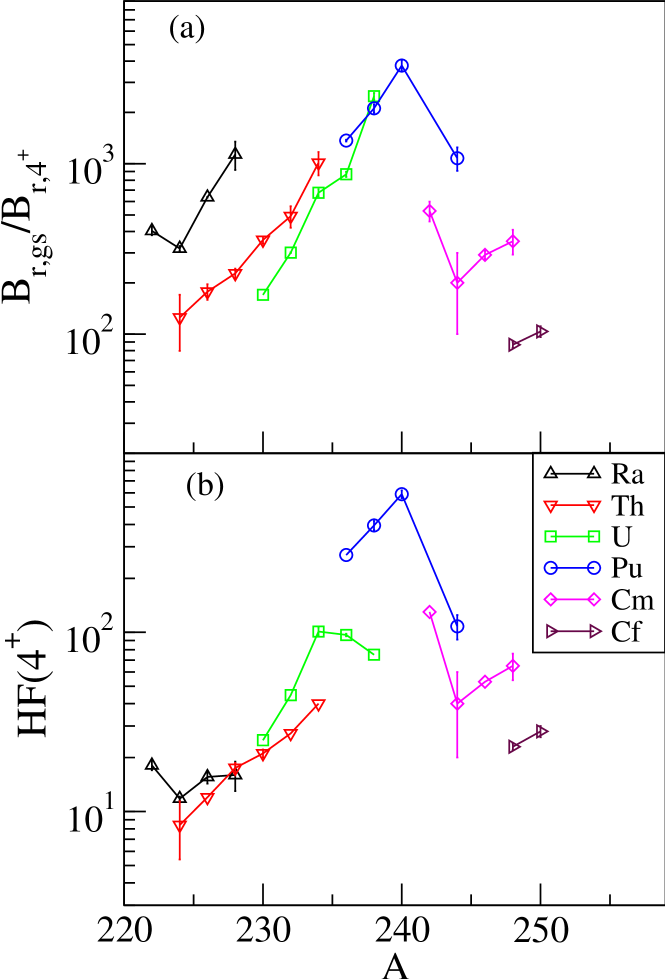
The heavy nuclei with are generally less accessible for detailed studies with usual nuclear spectroscopy methods. For example, gamma-ray spectroscopy studies of heavier nuclei in this region began to occur only recently (see e.g. 250Fm ). On the other hand, alpha decay represents one of the main tools for the spectroscopy of excited states of nuclei in this region. However, we have recently shown that the population of the excited states through alpha decay (the so-called fine structure) is not thoroughly understood, precluding the full use of this process as a spectroscopic tool alpha0 ; alpha . Thus, an intriguing evolution was observed for both the relative branching ratios and hindrance factors of the , and states from the ground state band of deformed nuclei in the Uranium to Californium isotopes, which is apparently related to intricate nuclear structure details. Figure 1 illustrates one of the most conspicuous observed effects, a remarkable maximum around mass 240 ( values around 142) in nuclei above Uranium, in the relative branching ratio and hindrance factor of the state. Such a behavior has been rather unexpected in these nuclei which are considered well deformed rotors, and its explanation is still pending, as it could not be correlated with any of the evolutions of several investigated nuclear structure observables alpha0 ; alpha .
Various features of the nuclear structure can be deduced by observing the evolution of different quantities that characterize the nucleus. Thus, for example, most nuclear structure observables, even the simplest ones, such as, in the even-even nuclei, the energy of the first excited state, or the electromagnetic transition probability of this state to the ground state, show clear indications for the magic numbers (major shell closures), and also display characteristic evolutions in between these numbers (the collective features). It is also known that the nuclear masses concentrate valuable information on the structural changes. The variation of the nuclear mass with the number of protons/neutrons shows many irregularities that can be related to different structural changes, the strongest being those due to the magic numbers. Finer details of the structure evolution can be observed by looking at the evolution of the nuclear masses through a proper ’eye-glass’. Such a systematic investigation was performed in Ref. S2n by looking at the evolution of a mass-related quantity, the two-neutron separation energy in the even-even medium mass nuclei (with from 28 to 80), and using as eye-glass the differential variation of this quantity as a function of and . Various other differential observables were used in Ref. cakirli to highlight evolutions and changes in nuclear structure.
Because the approach based on the differential of the two-neutron separation energy proved very useful in indicating not only major shell closures but also different subshell closures as well as points of phase/shape transitions, we decided to investigate in the same way the evolution of the known alpha-decaying nuclei above . As a result, we have found interesting features in the evolution of the derivative of with respect to and also unexpected empirical correlations between the variation of this derivative and those of the alpha-decay fine structure quantities. The analysis of the existing set of experimental data points to the importance of deformed subshell closures in these nuclei.
II Systematics of the two-neutron separation energies
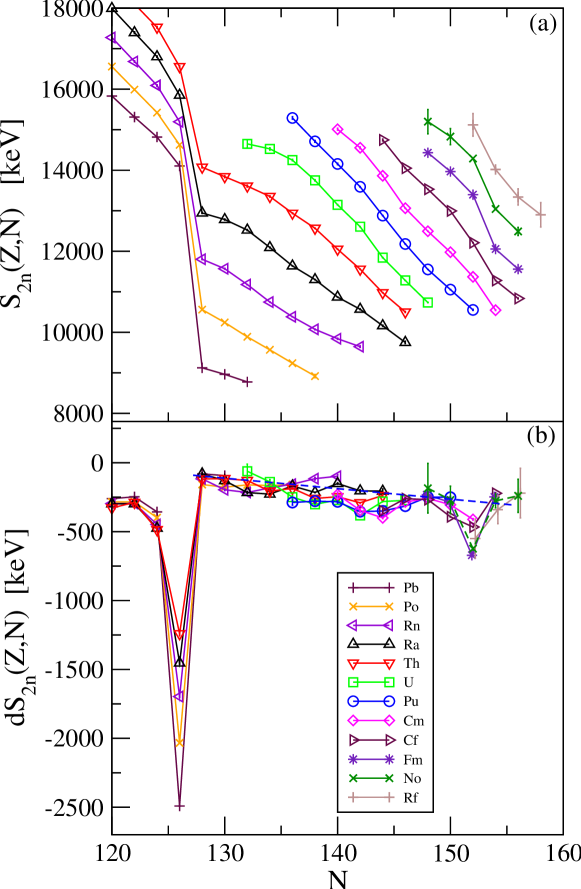
The two-neutron separation energies were taken from the recent mass evaluation, Ref. ame2012 . Figure 2(a) shows the variation of as a function of the number of neutrons for the isotopes with from 82 to 104 (Pb to Rf). To show the trends also for the isotopic chains with the highest (102 and 104) we included in some cases estimated values and errors given in ame2012 (these cases can be recognized by their larger error bars). A feature that is common to all mass regions S2n is that decreases monotonously with increasing , as in Fig. 2(a), the curves for different isotopes being almost parallel; a more accentuated decrease takes place after the magic numbers (it is more difficult to remove two neutrons from a nucleus with a magic neutron number). This accentuated variation is easily observed in graph (a) at , the well known spherical major shell closure. Finer details can be obtained by looking at the differential variation of with . This can be defined as:
| (1) |
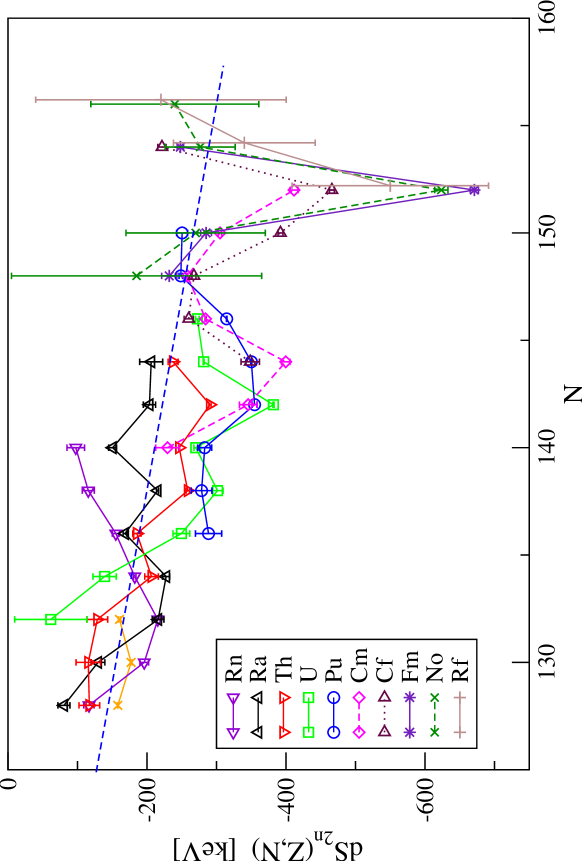
From the general properties of it follows that for a certain mass region, such as that shown in Fig. 2, is negative and approximately constant (actually, a weak, practically linear variation with is observed S2n ), except for some regions with a more accentuated variation. A sudden jump to much larger negative values is observed for at the magic number - graph (b). The evolution of shows other interesting structure effects as well. For example, in the Ba to Gd nuclear region there is another obvious deviation from the smooth behavior, a positive bump at – 90 S2n , which corresponds to the critical point of the shape/phase transition between spherical and deformed nuclei. Similar features were observed in other nuclear regions, e.g., in the Sr, Zr, Mo nuclei a negative kink in (more reduced than the one at ) which corresponds to the known subshell closure, and a positive one at , where a sudden onset of deformation is known, that can be also associated with an critical point transition. Indications were also found for different other weak subshell closures S2n . In the nuclear region considered here there is another clear negative bump, of smaller amplitude, at . Nuclei in the region are all deformed, showing clear rotor features, therefore it is a deformed subshell closure. The ’magic’ character of has been known for a long time. Various calculated Nilsson diagrams show a deformed gap at (e.g., Ref. gustafson ). This shell closure was shown to have a marked effect on the spontaneous fission half-lives of those nuclei Leino , and its effects on the structure of the nuclei are also seen both in experimental data and calculations, see e.g. chatillon ; sobiczewski ; patyk . One should emphasize the fact that a deformed subshell gap shows up in in the same way as the spherical major shell closure, that is, as a negative bump. In addition to the two ’shell-closure’ negative bumps clearly observed in Fig. 2(b), there is a smaller-scale negative bump at for the isotopes of U to Cf. Fig. 3 shows a larger scale detail of graph 2(b), where it can be seen that for the U, Pu, Cm, and maybe Cf isotopes, there is indeed a negative bump that can be clearly distinguished from the fluctuating ’background’ of in this region.
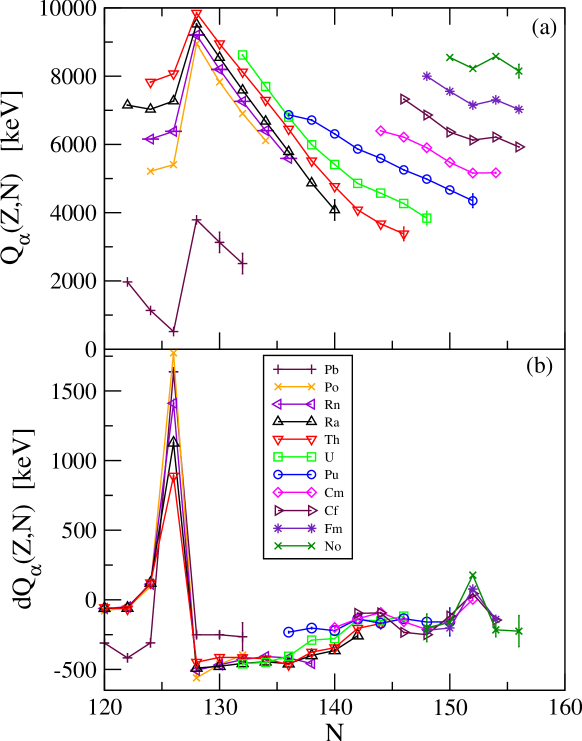
Similar conclusions are drawn from examining another quantity related to the nuclear masses, the alpha-decay -value, . We take this quantity from the same tables ame2012 and Fig. 4 presents the variation with of both and its differential , for the same nuclei from Fig. 1. Again, the differential clearly shows specific bumps (positive, this time) at the spherical shell closure and at the deformed subshell closure, as well as a smaller bump at , which is statistically significant for the higher values (above 92).
While this effect at , observed in both and is smaller than that due to the subshell closure (150 keV deep, compared to 400 keV), we cannot overlook it because, as shown below, it is a real effect that clearly shows up in the evolution of other nuclear structure observables.
III Correlation between and alpha-decay fine structure observables
As already emphasized, details concerning the absolute rates of the population of excited states in the ground state band of even-even trans-lead nuclei also constitute valuable indication on their structure. In Refs. alpha ; alpha0 we have examined the evolution of the following quantities: the branching ratios for the population of the excited states ’’, and the hindrance factors . The hindrance factors are defined as alpha :
where denotes the ground state, and are the corresponding penetrabilities of the alpha particle through the barrier. In particular, for the state of the gsb, a pronounced maximum was observed for both these quantities, corresponding to the U, Pu, and Cm nuclei with values of 142 – 144 (see Fig. 1). This striking maximum, observed in the middle of a region of well deformed nuclei could not be correlated with the behaviour of any of the different simple structure indicators that were investigated: the energy of the state, the ratio , the quadrupole () or hexadecapole () deformation parameters, or the and parameters of the fit of the gsb energies with the VMI formula (or Harris parametrization) VMI , being close to the moment of inertia and characterizing the stiffness, or rigidity, of the nucleus alpha .
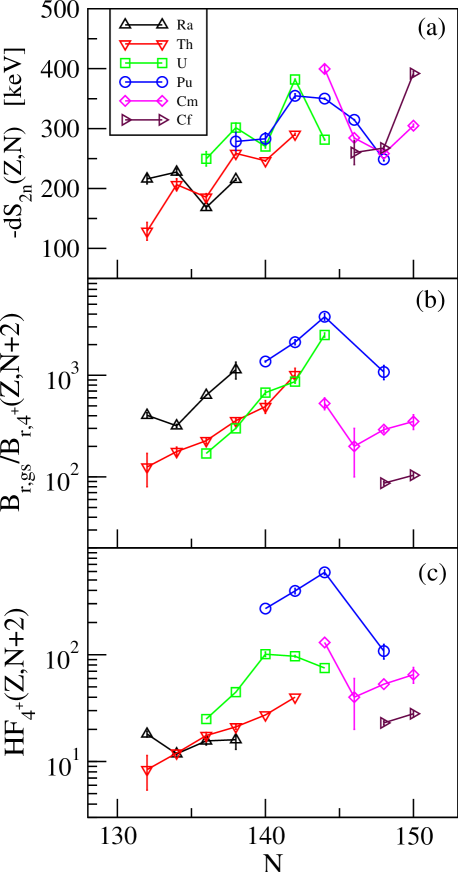
It turns out that the evolutions of both and for the state of the gsb (Fig. 1) are well correlated with that of the quantity discussed above. In the data discussed below, the hindrance factor values are those adopted in the ENSDF database ENSDF , which correspond to penetrabilities calculated according to the recipe of Preston Preston . As discussed in alpha , hindrance factors calculated with different methods differ only in absolute values but their evolution is very similar. Figure 5 shows the evolution of all these quantities as a function of the neutron number . The symbols represent the isotopes of Ra, Th, U, Pu, Cm, and Cf for which the branching ratio of the state was measured. We have noticed that there is a good similarity between the variation with of - and that of the alpha decay quantities, provided the -values are shifted by two units for the latter: that is, in Fig. 5(b) and (c), at the x-axis corresponding to the neutron number are represented the relative branching ratio and the hindrance factor for the daughter nucleus . Figure 5 shows a rather good correlation between - and the logarithms of the and values of the state. The correlation is better in the case of the hindrance factors (quantities in which the barrier penetrability was corrected for). By comparing graphs (a) and (c) in Fig. 5 one can see that there is a very good similarity for the variation with of the two quantities, with the exception of the Plutonium nuclei, which have hindrance factors that are larger than those suggested by the superposition of the two graphs.
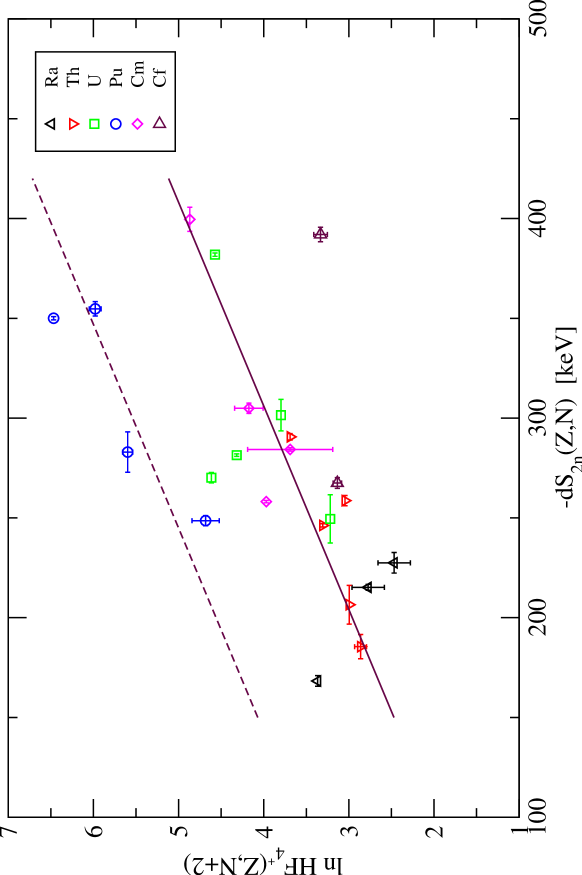
The quality of the correlation between and the hindrance factor of the state of the nuclei can be better appreciated in Fig. 6. All nuclei in this graph show a reasonably good linear correlation. There is some scattering of the data around this straight line, one of the most deviating points being that of 250Cf (daughter nucleus), nevertheless the graph demonstrates a reasonably good correlation of the two quantities. As noted above, the Plutonium isotopes jump out of this general pattern, at higher values, but their evolution is still well represented by a straight line with the same slope as that for the other nuclei. One should note that these nuclei, where the alpha decay branching is known for the state correspond mainly to those from the region where presents the small negative bump at discussed in the previous section. Therefore, the structure effect seen in manifests itself strongly in a nuclear structure observable, namely the state alpha decay hindrance factor.
As discussed in Ref. alpha , the relative branching ratio and the hindrance factor values corresponding to the excited state vary, as functions of , practically out of phase with those of the state (Fig. 2 in alpha ), therefore they are also reasonably well correlated with . Because in this case there are less data points, and their scattering is somewhat larger alpha , we concentrate the discussion on the state data.
IV Discussion
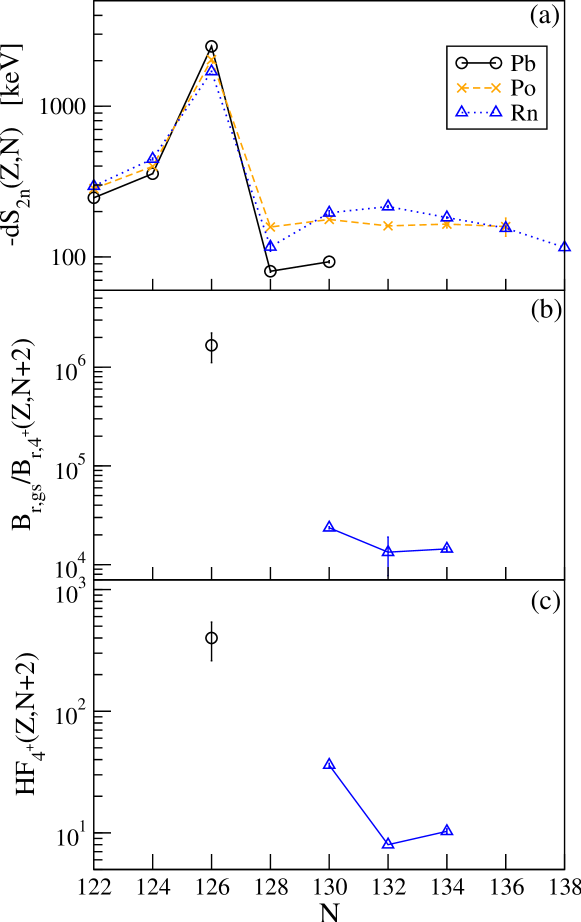
In the following we discuss the possible meaning of the small bump seen in the variation of (Figs. 2 and 3) at . The isotopes with = 92 to 98 show a clear minimum at , which is about 150 keV deep below the average background. As it is a negative bump, just like the other two corresponding to (sub)shell closures at and 152, respectively, it is tempting to attribute it to another deformed subshell closure as well. Actually, for the Cm isotopes the minimum at has practically the same depth with that at , and the Cf isotopes show a rather similar evolution. A good argument in favor of assigning this minimum to a subshell closure would be to compare the behavior of HF() in this region of values with that of the same quantity at a well established shell closure. Unfortunately, the alpha decay experimental data are very scarce in this respect. Figure 7 presents a graph similar to that in Fig. 5, for all the other cases where the state was measured in alpha decay, in nuclei close to . Only one Pb isotope and three Rn isotopes (as daughter nuclei) were found in this region. Figure 7(a) shows the strong, sharp maximum of the quantity at the magic number , and at larger an almost constant value smaller by a factor of about 15. Both the relative branching and the for the state of the nuclei behave, as a function of , similarly to , also having a large value at (that point correponds to the daughter nucleus 210Pb), and a smaller average value at higher . For nuclei with around 100, which feel quite well the deformed shell closure (see Fig. 3) there are no measured data for the branch of the state. Based on these (unfortunately limited in number) experimental data, one may conclude, with some caution, that the signature of a neutron shell closure is a maximum in the value of the relative branching ratio, or of the hindrance factor, of the state. By analogy, one can then suggest that the intriguing maximum in HF() (e.g., Fig. 5) indicates a possible subshell closure showing up in Figs. 2 and 3 as a bump at , for the isotopes with to 98.
Until now, experimental effects indicating such a neutron subshell closure have not been discussed in the literature. All nuclei corresponding to this bump have large quadrupole deformations, larger than 0.25 Raman ; alpha0 , therefore this should also be a deformed subshell closure. On the other hand, different calculated Nilsson single-particle level schemes indicate that such a gap may occur for at values around 0.22 – 0.23, in addition to the gap occuring at higher values, with around 0.28 – 0.29 gustafson ; meldner . In some cases, the subshell gap predicted at in nuclei of mass is explicitely indicated, in addition to that at Nilsson ; Ragnarsson ; book . The occurence of such a shell gap should result from intricate structure details that dictate the relative positions of the deformed orbitals originating in the spherical shells , and 2. We finally note that the existence of another, deformed subshell closure at in addition to that at is also consistent with the observed variation of the rigidity of these deformed nuclei. In ref. alpha0 ; alpha we noted that the nuclear stiffness coefficient (which is proportional to the inverse of the Harris parameter VMI ) steadily increases with mass for the deformed nuclei that are discussed here. The explanation could be that after achieving permanent deformation (generally in nuclei with just below 140), one passes through the two regions of subshell closure, where the stiffness increases due to the reducing of the effect of the pairing correlations.
V Conclusions
In summary, we have investigated the systematics of both the differential variation of the two-neutron separation energies and of the alpha decay branching ratios and hindrance factors of excited states in deformed trans-lead nuclei. The differential proves a very sensitive tool for disclosing important information on nuclear structure changes in these deformed nuclei. Thus, besides the well-established magic number, it clearly shows the magic character of , where there is a deformed subshell closure. A weaker effect is visible in as another negative bump at , which occurs for the isotopes with to 98. This bump is rather well correlated with the extrema occuring in the behaviour of the alpha decay hindrance factors for the and states in the daughter nuclei (a maximum and a minimum, respectively) alpha . By analogy of the behavior of this correlation with that for nuclei around the shell gap, one can tentatively propose that the small bump indicates another (weaker) deformed subshell closure, which was actually predicted by Nilsson model calculations. It is interesting to observe (Fig. 3) that the Cm isotopes, for which the experimental data span the range from 140 to 152, ’feel’ equally strong both the assumed subshell gap and the well-recognized gap. An experimental confirmation of the observed type of correlation (larger values at the ’magic’ numbers) also for the heaviest nuclei with spanning the subshell closure would be extremely valuable. We have no explanation why the bump in , clearly indicating an interesting nuclear structure effect, manifests itself strongly in the alpha decay population of the higher spin members of the ground state bands and . It does not appear to have a visible effect on the state data alpha . One should remark, nevertheless, that the state is populated in the alpha decay with a relative branching ratio roughly in the range 2 to 10, whereas the population of the state appears, by comparison, as a much weaker phenomenon, with a relative branching ratio roughly between 100 and 4000 (Fig. 4), and even larger, of the order of at the magic number 126 (Fig. 7).
The possible occurence of another deformed subshell gap at opens up interesting questions about the intricate structure details of these nuclei, because the equilibrium shapes of such massive nuclei result from the interplay of many degrees of freedom, among which the quadrupole, hexadecapole, and octupole deformations play an important role. Also, how subshell closures in correlate with -values is another interesting aspect. Finally, although the detailed mechanism of the population of the excited states in the alpha decay process is not understood yet, the present experimental systematics indicate that the alpha decay fine structure is a spectroscopic tool with an extraordinary sensitivity, comparable to that of the ’eye glass’ constituted by the differential variation of the two-neutron separation energy.
Acknowledgements.
We acknowledge partial support from UEFISCDI-Romania under program PN-II-IDEI, Contract No. 127/2011.References
- (1) J.E. Bastin et al., Phys. Rev. C73, 024308 (2006).
- (2) D. Bucurescu and N.V. Zamfir, Rom. Journ. Phys. 57, 69 (2012).
- (3) D. Bucurescu and N.V. Zamfir, Phys. Rev. C86, 067306 (2012).
- (4) S. Anghel, G. Căta-Danil, and N.V. Zamfir, Rom. Journ. Phys. 54, 301 (2009).
- (5) R.B. Cakirli, R.F. Casten,and K. Blaum, Phys. Rev. C82, 061306(R) (2010).
- (6) M. Wang, G. Audi, A.H. Wapstra, F.G. Kondev, M. MacCormick, X. Xu, and B. Pfeiffer, Chin. Phys. C36, 1603 (2012).
- (7) S. Raman, C.W. Nestor, Jr., and P. Tikkanen, Nuclear Data Tables 78, 1 (2001).
- (8) C. Gustafson, I.L. Lamm, B. Nilsson, snd S.G. Nillson, Arkiv f. Fysik 36, 613 (1967).
- (9) M. Leino and F.P. Hessberger, Annu. Rev. Nucl. Part. Sci. 54, 175 (2004).
- (10) A. Chatillon et al., Eur. Phys. J. A30, 397 (2006).
- (11) A. Sobiczewski, I. Muntian, and Z. Patyk, Phys. Rev. C63, 034306 (2001).
- (12) Z. Patyk and A. Sobiczewski, Nucl. Phys. A533, 132 (1991).
- (13) M.A.J. Mariscotti, G. Scharff-Goldhaber, and B. Buck, Phys. Rev. 178, 1864 (1969); G. Scharff-Goldhaber, C.B. Dover, and A.L. Goodman, Annu. Rev. Nucl. Sci. 26, 239 (1976).
- (14) Evaluated Nuclear Structure Data File (ENSDF and XUNDL), maintained by the National Nuclear Data Center, Brookhaven National Laboratory: http://www.nndc.bnl.gov/ensdf .
- (15) M.A. Preston, Phys. Rev. 71, 865 (1947).
- (16) H. Meldner, Arkiv f. Fysik 36, 593 (1967).
- (17) S.G. Nilsson, Chin Fu Tsang, A. Sobiczewskim Z. Szymanski, W. Wycek, C. Gustafson, I.L. Lamm, P. Möller, and B. Nilsson, Nucl. Phys. A131, 1 (1969).
- (18) I. Ragnarsson, S.G. Nilsson, and R.K. Sheline, Phys. Rep. 45, 1 (1978).
- (19) S.G. Nilsson and I. Ragnarsson, Shapes and Shells in Nuclear Structure, Cambridge Univ. Press, 1995.