Triple point induced by targeted autonomization on interdependent networks
Abstract
Recent studies have shown that in interdependent networks an initial failure of a fraction of nodes in one network, exposes the system to cascade of failures. Therefore it is important to develop efficient strategies to avoid their collapse. Here, we provide an exact theoretical approach to study the evolution of the cascade of failures on interdependent networks when a fraction of the nodes with higher connectivity are autonomous. We found, for a pair of heterogeneous networks, two critical percolation thresholds that depend on , separating three regimes with very different network’s final sizes that converge into a triple point in the plane . Our findings suggest that the heterogeneity of the networks represented by high degree nodes is the responsible of the rich phase diagrams found in this and other investigations.
pacs:
64.60.aq, 64.60.ah, 89.75.HcI Introduction
Networks of networks are systems composed by several networks that in many cases depend on each other in a nontrivial way Rinaldi et al. (2001); Kivelä et al. (2013). An example of such systems are the power grid and the communication networks Rosato et al. (2008) in which the first one provides electric power to the communication network, and the last one provides control service to the electric network. Another example is the traffic flow between cities, through the sea port and airport networks Parshani et al. (2010a) in which the flow of individuals or goods in a city decays if it does not receive traffic from one of these networks. Most of these systems are composed by individual networks connected by internal connectivity links. The role of these internal links is to generate a single component network that allows to distribute some entities between the nodes, such as the electric flow in the power grid network. Nodes of different networks are connected by interdependent links that enable the support between them. Thus in general, when a node fails in one network, the failure propagates to the other networks through the interdependent links producing sometimes a “domino” effect with harmful consequences for the functionality of the networks.
It was shown that under a failure of a fraction of nodes in one network, the interdependency can produce a cascade of failures that spreads through all the system with catastrophic consequences in the robustness of the individual networks. Buldyrev Buldyrev et al. (2010) proposed a minimalist model, based on percolation theory, to study the dynamics of the cascade of failures. In Ref. Buldyrev et al. (2010) they consider two interdependent networks, denoted by and with fully interdependency each node depends on a node in the other network. By definition, a functional node is connected to the giant component (GC) of its own network and depends on a node in the other network that also belongs to its GC. Otherwise the node is dysfunctional, it is failed Buldyrev et al. (2010). Thus, the GC is the only “functional cluster” and there is only one in each network. Before receiving an initial failure or attack, every node in one network is supported by its interdependent node in the other network and thus the nodes are fully interdependent with a full correspondence between the sizes of the GC of both networks. The random failure of an initial fraction of nodes in one network triggers the cascade of failures and, as a consequence, the correspondence between both GC is broken. At each time step, the dysfunctional nodes transmit the failure to their interdependent neighbors, producing dysfunctional nodes in the other network. The process reaches the steady state when both networks are abruptly destroyed with a first order transition at a critical threshold or when above the correspondence between the GC is reestablished. It was shown that fully interdependent networks are very fragile under random failures, , they have a higher critical threshold than isolated networks, regardless of the degree distribution Buldyrev et al. (2010). This was an exciting result because it is well known that isolated heterogeneous scale-free (SF) networks are very robust against random failures (). However, to consider full interdependency is not very realistic because nodes in each network can work autonomously. For example, some nodes can have a “power supply” or a backup that allow them to remain functional even when they lack of support from the other network, increasing their chance to remain functional. As a consequence, partial interdependency where a random fraction of nodes are interdependent and the rest are autonomous, increases the robustness of the individuals networks compared to the case of fully interdependency Parshani et al. (2010b); Zhou et al. (2013); Gao et al. (2011a, b, 2013). It was found that depending on the value of and on the fraction of random failures in network , the transition changes from a discontinuous to a continuous one. In these partial interdependent networks the correspondence in the steady state between networks and is broken because the autonomous nodes in network do not receive the initial failure of network and can only become dysfunctional by the failure of non-autonomous nodes that disconnect them from its GC. Then, in the steady state, the size of the GC of network is bigger than the one in network . In Ref. Zhou et al. (2013) it was found that for heterogeneous SF under random autonomization the sizes of the functional clusters undergo an abrupt decreasing for a certain value of without a full collapse due to the fact that the high degree nodes are sustained by autonomous nodes Exx (a). However bellow the size of the GC of network decreases continuously to zero as in a second order percolating transition at a value , while the size of network goes to a finite value. The goal is to find a way to autonomize efficiently the networks in order to increase their robustness compared to the case of random autonomization Schneider et al. (2013); Yagan et al. (2012). Schneider Schneider et al. (2013) proposed a model where the robustness of the system is enhanced by targeted autonomization of a fraction of the higher degree nodes. Using a theoretical mean field approximation that assumes that the cascade of failures affects both autonomous and non-autonomous nodes, they showed that even for homogeneous networks there is a critical point in the plane , at where the transition changes from first order for to a continuous one for . This theoretical results was qualitatively supported by simulation, but the exact theoretical solution was not derived so far. An exact theoretical formulation allows to find some other effects that are hidden in the simulations due to finite size effects. Very recently, Valdez Valdez et al. (2013), introduce an exact general framework that they apply to explain the effect of partially correlated interdependent networks in the robustness of heterogeneous SF interdependent networks under cascade of failures. The exact result allowed to find very interesting features such as a triple point in the phase diagram that depend on the level of correlation. Here, we apply the formalism presented in Ref. Valdez et al. (2013) to targeted autonomization and derive the exact theoretical solutions for this process.
II Theoretical results
We study the temporal evolution of the sizes of the GC of two interdependent networks under targeted autonomization when a fraction of the higher degree nodes of both networks are autonomous. Each network, that we denote by and , has connectivity links distributed according to and , where and are the connectivity links of nodes in and respectively. Let’s assume that a fraction of interdependent nodes () in network () depends on the connectivity links of network (). In the initial stage a fraction of nodes fails at random in network . At each stage of the cascade failure that goes from to , a node in network with degree is functional if it is autonomous and belongs to its GC with probability or if it is not autonomous but was connected to the GC of in a previous stage with probability . Since the initial failure (at ) of nodes happens only in network , then only is multiplied by . Here () is the probability that a random selected edge that leads to a non-failed node at , this node belongs to the GC of network () at stage Braunstein et al. (2007); Newman et al. (2001) and fulfills the self consistent equation
| (1) | |||||
where and are the minimum and maximum connectivity links respectively.
The first term in Eq. (1) takes into account the autonomous functional nodes in with degree and the second term corresponds to functional nodes in with degree that depend on functional nodes of with degree at step . Thus, the fraction of nodes of the GC of network at step is given by,
| (2) | |||||
For network , also fulfills a self-consistent equation
| (3) | |||||
Thus the fraction of nodes of the GC of network is given by
| (4) | |||||
In the steady state, for , and , thus and converges to and , respectively Son et al. (2012); Baxter et al. (2012); Valdez et al. (2013).
In this model, and are given by
where , is the degree at and above which a fraction of nodes are autonomous, and fulfills . Thus if we denote by the fraction of autonomous nodes with degree , . Note that for Eqs. (1)-(4) are not symmetric which leads to the non correspondence between the final sizes of the GC of networks and , as mentioned above. The symmetry is restored only for () Buldyrev et al. (2010) or when the initial failure happens in both networks Zhou et al. (2013).
We apply our equations to SF networks of sizes with degree distribution with and . Here, we use to ensure that at the beginning all the nodes belong to the GC Bornholdt et al. (2003). Since the theoretical solutions of Eqs. (1)-(4) near the criticality are sensitive to the precision employed in the calculations, we use a multiple precision arithmetic library Nikolaevskaya et al. (2012). We chose a finite in order to emulate the finite power law region observed in many real networks Amaral et al. (2000) such as the movie actor network Barabási and Albert (1999), the scientific collaboration network Barabási et al. (2002); Newman et al. (2001) and the protein network Jeong et al. (2001). In Fig. 1 we show the temporal evolution and the steady state of the fraction of nodes in the GC of network , for SF networks with . From Fig. 1 we can see the excellent agreement between the theory and the simulations, except for very low values of that is due to finite size effects. In the inset of Fig.1b we show from to that the value of obtained from the simulations approaches to the theoretical solution for and as the system size increases.
As was observed in Ref. Schneider et al. (2013), for homogeneous networks, the robustness of the networks increases with due to the fact that the higher degree nodes of both networks, that are the ones that sustain the functionality of the networks, are autonomous. Our theoretical equations allow to find a surprising behavior of the transitions with two critical thresholds at and that depend on (with ) Exx (b). At the sizes of the functional networks and have an abrupt jump. Below this critical threshold the GC of network is destroyed at . To compute the value of the critical point , we solve numerically the system of Eqs. (1) and (3) with the condition Exx (c), where is the Jacobian of Eq. (1) and (3) and is the identity matrix. This method also can be applied to find , however here we use a more explicit and physical derivation to compute it 111Another method to obtain graphically the value of the critical point is by measuring the position of the peak of the NOI curve as a function of , where the NOI is the number of iterations needed to reach the steady state of the evolution equations. At there is a sharp peak, which corresponds to the condition . However, around the NOI has not a visible peak within the precision we used.. Assuming that the transition in network is continuous, then the probability continuously when . As a consequence at this threshold , that is not zero due to the broken symmetry imposed by the initial failure in and by the partially interdependency (), reduces to
| (5) |
Solving this self consistent equation we found the non trivial solution of Eq. (5), from where we obtain at the threshold . Since is a critical point for network , the r.h.s. of Eq. (1) for is tangent to the identity function evaluated at , thus
| (6) | |||||
Then is explicitly given by
| (7) | |||||
where is the branching factor of random percolation in network and is the generating function of network . Thus is a correction to the threshold of percolation in individual networks where , because the branching factor in this process is reduced by the second term, as a result of the targeted autonomization. Note that if the branching factor diverges, and for all Exx (d). The solution of Eq. (7), has a physical meaning only if , otherwise there is only one threshold at where both networks fully collapses. The phase diagram in the plane , displayed in Fig. 2, shows a triple point in which the line of the first order transition forks at into two branches where the upper one corresponds to an abrupt collapses at and the lower one corresponds to where the size of network continuously vanishes.
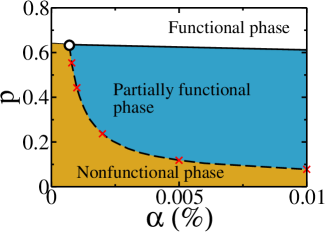
If the assumption on the continuity of the transition used to derive holds, the evolution equation around will also show a continuous critical behavior at the value of obtained from Eq. (7). We solve numerically the Eqs. (1)-(4) for , for different values of . In the inset of Fig. 1a we show the temporal evolution for (with ). We can see that above but very close to our theoretical , goes to a finite value, while slightly below network collapses (). In Fig. 2 we show (with cross symbols) some values of of the continuous branch of the phase diagram obtained from the evolution equations 222In order to determine , we use , that are in total agreement with Eq. (7). This result confirms our argument which leads to Eq. (7), used to obtain the lower branch of the phase diagram allowing us to find . We found the same qualitative behavior for different values of , however as the heterogeneity decreases, the network is less robust and it is expected that at some point the triple point will be lost. At this point the phase diagram will have only one transition line, such as in homogeneous networks Schneider et al. (2013). These findings may indicate that when high degree nodes in SF networks are protected via targeted autonomization, random autonomization Zhou et al. (2013) or correlation Valdez et al. (2013), they induce multiple and different kind of order transitions.
In summary, we have presented the exact formulation of the cascade of failures for targeted immunization with any degree distribution of connectivity links. We show theoretically that increasing autonomization enhances the robustness of SF networks and generates in the phase diagram different regimes with different characteristic sizes of the GC. These regimes converge into a triple point which is a reminiscent of the triple points of liquids. Physically it means that high degree nodes, that are responsible to maintain the integrity of the networks, play a fundamental role in the rich phase diagrams of these processes.
II.1 Acknowledgments
L.D.V, P.A.M and L.A.B thank UNMdP and FONCyT (Pict 0293/2008) for financial support.
References
- Rinaldi et al. (2001) S. M. Rinaldi, J. P. Peerenboom, and T. K. Kelly, Control Systems, IEEE 21, 11 (2001).
- Kivelä et al. (2013) M. Kivelä, A. Arenas, M. Barthelemy, J. P. Gleeson, Y. Moreno, and M. A. Porter, arXiv preprint arXiv:1309.7233 (2013).
- Rosato et al. (2008) V. Rosato, L. Issacharoff, F. Tiriticco, S. Meloni, S. Porcellinis, and R. Setola, International Journal of Critical Infrastructures 4, 63 (2008).
- Parshani et al. (2010a) R. Parshani, C. Rozenblat, D. Ietri, C. Ducruet, and S. Havlin, Europhys. Lett. 92, 68002 (2010a).
- Buldyrev et al. (2010) S. V. Buldyrev, R. Parshani, G. Paul, H. E. Stanley, and S. Havlin, Nature 464, 1025 (2010).
- Parshani et al. (2010b) R. Parshani, S. V. Buldyrev, and S. Havlin, Phys. Rev. Lett. 105, 048701 (2010b).
- Zhou et al. (2013) D. Zhou, J. Gao, H. E. Stanley, and S. Havlin, Phys. Rev. E 87, 052812 (2013).
- Gao et al. (2011a) J. Gao, S. V. Buldyrev, S. Havlin, and H. E. Stanley, Phys. Rev. Lett. 107, 195701 (2011a).
- Gao et al. (2011b) J. Gao, S. V. Buldyrev, H. E. Stanley, and S. Havlin, Nature Physics 8, 40 (2011b).
- Gao et al. (2013) J. Gao, S. V. Buldyrev, H. E. Stanley, X. Xu, and S. Havlin, arXiv preprint arXiv:1306.3416 (2013).
- Exx (a) Note that since in a SF network there is only a few amount of high degree nodes, they have a low probability to become dysfunctional in the initial failure.
- Schneider et al. (2013) C. M. Schneider, N. Yazdani, N. A. Araújo, S. Havlin, and H. J. Herrmann, Scientific reports 3, 1969 (2013).
- Yagan et al. (2012) O. Yagan, D. Qian, J. Zhang, and D. Cochran, Parallel and Distributed Systems, IEEE Transactions on 23, 1708 (2012).
- Valdez et al. (2013) L. Valdez, P. Macri, H. Stanley, and L. Braunstein, Phys. Rev. E 88, 050803 (2013).
- Braunstein et al. (2007) L. A. Braunstein, Z. Wu, Y. Chen, S. V. Buldyrev, T. Kalisky, S. Sreenivasan, R. Cohen, E. López, S. Havlin, and H. E. Stanley, International Journal of Bifurcation and Chaos 17, 2215 (2007).
- Newman et al. (2001) M. Newman, S. Strogatz, and D. Watts, Phys. Rev. E 64, 026118 (2001).
- Son et al. (2012) S.-W. Son, G. Bizhani, C. Christensen, P. Grassberger, and M. Paczuski, Europhys. Lett. 97, 16006 (2012).
- Baxter et al. (2012) G. Baxter, S. Dorogovtsev, A. Goltsev, and J. Mendes, Phys. Rev. Lett. 109, 248701 (2012).
- Bornholdt et al. (2003) S. Bornholdt, H. G. Schuster, and J. Wiley, Handbook of graphs and networks, vol. 2 (Wiley Online Library, 2003).
- Nikolaevskaya et al. (2012) E. Nikolaevskaya, A. Khimich, and T. Chistyakova, Programming with multiple precision, vol. 397 (Springer, 2012).
- Amaral et al. (2000) L. A. N. Amaral, A. Scala, M. Barthélémy, and H. E. Stanley, Proceedings of the National Academy of Sciences 97, 11149 (2000).
- Barabási and Albert (1999) A.-L. Barabási and R. Albert, Science 286, 509 (1999).
- Barabási et al. (2002) A.-L. Barabási, H. Jeong, Z. Néda, E. Ravasz, A. Schubert, and T. Vicsek, Physica A: Statistical Mechanics and its Applications 311, 590 (2002).
- Jeong et al. (2001) H. Jeong, S. P. Mason, A.-L. Barabási, and Z. N. Oltvai, Nature 411, 41 (2001).
- Exx (b) In Ref. Schneider et al. (2013) it was found only one threshold, since the process was studied only on homogeneous networks.
- Exx (c) Geometrically, this equation is the condition of the tangency between the identity plane and the surface composed by the right hand side of Eqs. (1) and (3) in the steady state.
- Exx (d) It is straightforward to obtain the same result for random autonomization Zhou et al. (2013) under random failure in both networks.