N(H I)/E(B-V)
Abstract
We explore the relationship between dust-emission derived reddening E(B-V) and atomic hydrogen column density N(H I) derived from 21 cm emission surveys. We consider measurements at galactic latitude o and E(B-V) 0.1 mag where the interstellar gas is predominantly neutral and atomic and opacity corrections to 21cm H I profiles are small. Over the Galaxy at large at lower resolution in H I, and on smaller scales at higher resolution, we find that the reddening is always much smaller than would be expected from the usually-quoted relation N(H) E(B-V) based on stellar reddening and uv absorption toward early-type stars. On wide scales, we find N(H I) = E(B-V). We cite various precedents for such a large N(H I)/E(B-V) ratio whenever wide-field 21cm emission surveys are considered, including when reddening based on galaxy counts or colors is substituted for the dust-emission derived reddening measure.
1 Introduction
A linear relationship between optical reddening E(B-V) and the total column density of hydrogen nuclei N(H) = N(H I) + 2 N() is a cornerstone of modern astrophysics, with a widely-quoted constant of proportionality N(H) E(B-V) derived from Ly- and absorption against a small number of early-type stars using the Copernicus satellite (Bohlin et al., 1978; Savage et al., 1977). The same constant of proportionality is implicit in the definition of the “Standard“ H I cloud of Spitzer (1968).
This relationship was at first extended over the sky using galaxy counts to measure optical extinction (Burstein & Heiles, 1982) (BH82; see also Heiles (1976)) and more recently using far infrared (FIR) dust emission-derived measures from higher-resolution (6′) all-sky surveys (Schlegel et al., 1998) (SFD98). For the atomic hydrogen column density, the all-sky, stray radiation- corrected LAB 21cm H I emission survey (Kalberla et al., 2005) with 0.6o resolution on a 0.5o grid stands in for Ly- absorption. MM-wave CO emission surveys (Dame et al., 2001; Abdo et al., 2010; Planck Collaboration et al., 2011) have been used as surrogates for at higher reddening E(B-V) 0.1 mag where the fraction is appreciable (Savage et al., 1977) and N(H) necessarily diverges from N(H I). The -fraction has also been estimated using 2N() = E(B-V) - N(H I) (Abdo et al., 2010; Liszt et al., 2010; Liszt & Lucas, 2002), partly as a means of calibrating the so-called CO- conversion factor.
The subject of this work is the relationship between N(H I) derived from 21cm measurements and E(B-V) at 0.02 mag E(B-V) 0.1 mag. In this regime the -fraction is small, the hydrogen is predominantly neutral and atomic and the optical depth in the 21 cm H I line is low. Thus all of the commonly-considered systematic errors in deriving N(H I) are minimized and there should be little difficulty in demonstrating the proportionality between N(H I) cum N(H) and E(B-V). However, we find that the slope of the N(H I)-E(B-V) relationship is very different from that expected, typically by about 40%, over large and small regions of the sky, at low and high spatial resolution, no matter which recent H I survey is considered.
The organization of this work is as follows. In Section 2 we describe our use of the various H I and reddening measures and databases. In Section 3 we show the N(H I)-E(B-V) relationships that result. In Section 4 we discuss some recent and historical antecedents for adjusting the E(B-V)/N(H I) relationship and Figure 5 is a brief summary presenting the alternatives that suggest themselves for understanding the present results.
2 Observational material and empirical results
2.1 Reddening
For comparison with N(H I) we derived reddening values at the nearest pixel in the SFD98 datacubes (North and South) and made sure to check our values against those served online 111http://irsa.ipac.caltech.edu/applications/DUST/ given the unexpected nature of the plots we produced. The SFD98 datacubes present equivalents of the optical reddening E(B-V) derived from far infrared dust emission at 6′ resolution on a 2.5′ pixel grid, with a stated error of 16% at each pixel. We also compared the SFD98 results with those from the work of BH82, on the gridpoints of the latter, ie spaced 0.6o in galactic latitude and 0.3o in longitude.
2.2 21cm H I
We derived N(H I) from brightness temperature profiles of 21cm radiation, lightly correcting for optical depth using a spin temperature of 145 K, which corresponds to the mean ratio of 21cm emission and absorption (Liszt et al., 2010) in the Millenium H I Emission-Absorption Survey of Heiles & Troland (2003). The correction to N(H I) for H I optical depth is never more than a few percent at N(H I) , E(B-V) 0.08 mag where the disparity between the canonically-scaled E(B-V) and N(H I) is most clearly manifest. The upward correction for the possible contribution of ionized hydrogen is ignored here, but it would only exaggerate the effects that are discussed.
On large scales we used the LAB all-sky, stray-radiation corrected survey data (Kalberla et al., 2005) that has 0.6o spatial resolution on a pixel grid spaced 0.5o, with a velocity resolution of 1.3km s-1. We checked our profile integrals against those from the online LAB survey server 222http://www.astro.uni-bonn.de/hisurvey/profile/.
We also derived N(H I) over smaller regions using cubes of H I profiles from the GALFA-HI survey (Peek et al., 2011)333https://purcell.ssl.berkeley.edu/ that has 4′ resolution on a 1′ pixel grid with 0.8 km s-1 velocity resolution. We confirmed that the GALFA and LAB surveys are on the same intensity scale by synthesizing a few spectra at 0.6o resolution at positions corresponding to LAB survey pixels, using GALFA data.
3 Empirical results
3.1 Wide-angle results using the LAB H I survey
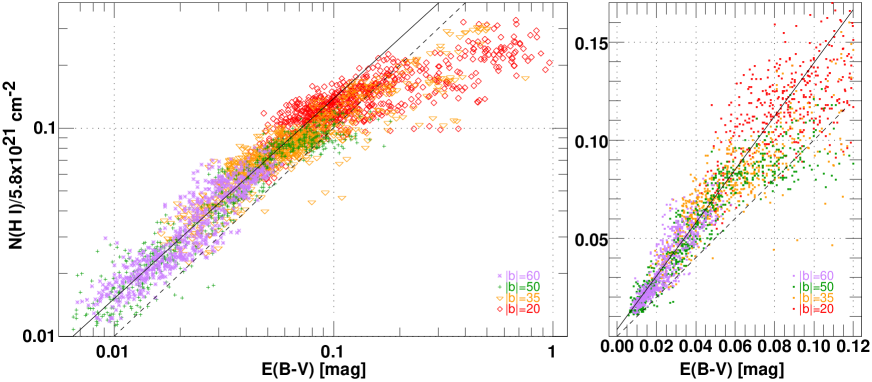
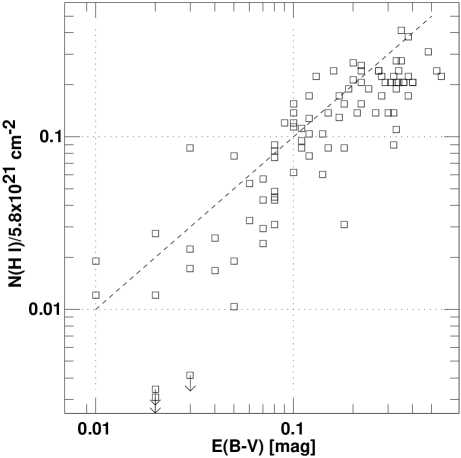
Figure 1 shows the results of plotting scaled values of N(H I)/ vs E(B-V) from SFD98. We sampled around the entire sky at the 720 longitude gridpoints of the LAB survey, ie at even 0.5o intervals of galactic longitude at b = 20o, 35o, 50o and 60o, to cover a wide range in N(H I) and E(B-V); we used the nearest datapoint in the 2.5′-pixel datacubes of SFD98. Figure 1 shows the data on a wider log scale at left and at smaller E(B-V) on a linear scale at right.
The dashed lines in Figure 1 are the canonical scaling relationship N(H I)/ = E(B-V) which should hold at lower E(B-V) where the fraction is small (Savage et al., 1977). A regression fit to the data at 0.015 E(B-V) 0.07 mag is log(y) = log(E(B-V)) where y = N(H I)/.
As shown at right there is a small non-zero y-intercept to a linear fit, y = 0.00363+1.3581 E(B-V) or E(B-V) = -0.00267+N(H I)/ which is very similar to an implicit result in Peek (2013), as noted here in Section 4.2.
A formal fit for the mean displacement between the regression lines and the canonical scaling is a factor 1.43, ie a mean slope dN(H I)/dE(B-V) = E(B-V). Note that the putative displacement cannot be discerned at E(B-V) 0.12 mag, in part because the fraction is appreciable and partly because the optical depth at 21cm is not compensated in the attendant cooler gas.
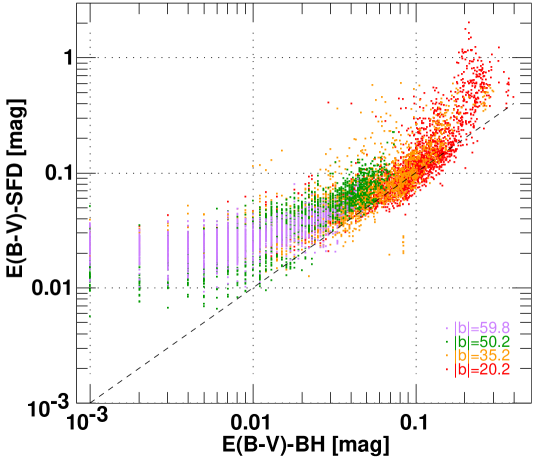
As a check, Figure 2 shows that the reddening derived from the SFD98 datacubes is already larger than that of BH82, except over a narrow range at 0.06 E(B-V) 0.1 mag. Recent suggestions for corrections to the SFD98 results (Schlafly et al., 2010; Schlafly & Finkbeiner, 2011; Berry et al., 2012) imply an overall decrease of 10-15% in the SFD98 reddening that would somewhat ameliorate the differences between SFD98 and BH82 while increasing the value we derive for N(H I)/E(B-V) by the same amount.
Given the behaviour in Figure 2 it is interesting to contemplate what Figure 1 would have looked like if had been constructed just before the appearance of SFD98. The reddenings of BH82 do not increase much beyond E(B-V) = 0.2 mag, so that the broad wing extending to high E(B-V) in Figure 1 would have been compressed and pushed back to the regression line. At small E(B-V) the reddening of BH82 declines much faster than that of SFD98, leading to high values of the gas/dust ratio as noted in Section 4.2.
Table 1 shows some summary properties for the data displayed in Figure 1. The southern sky consistently has 20-30% more gas at o, a well-known aspect of galactic structure (Dickey & Lockman, 1990). The H I/E(B-V) ratio is more consistent in the north but steadily increasing with in the south. Some part of that increase could be explained by colder gas and a stronger correction for saturation in the H I but it also appears that the extra gas in the south is not accompanied by a full complement of added reddening. In any case, Table 1 gives some idea of the expected variability in N(H)/E(B-V) at/above 35o where the opacity correction is small; nearly none in the northern sky and 15-20
3.2 Smaller-scale results using GALFA HI
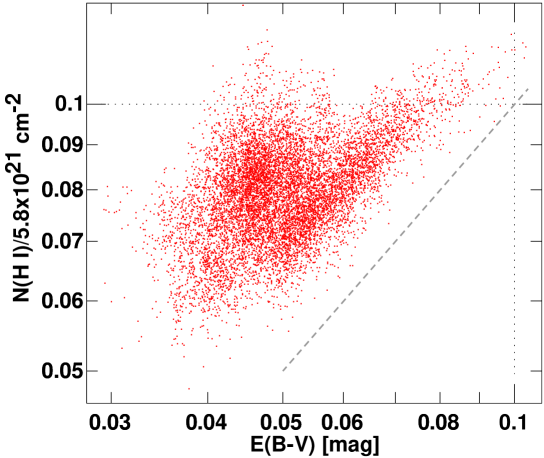
As a check on the wide-scale results from the LAB survey, we considered regions mapped at 4′ resolution in the GALFA-HI survey of Peek et al. (2011). Shown in Figures 3 and 4 are results derived from two custom 5o5o cubes delivered by the GALFA data server.
Figure 3 shows the N(H I) - E(B-V) comparison for a region at b -33o that was specifically selected from a reddening map to avoid sightlines with E(B-V) 0.1. The formal value of the displacement of the data from the canonical scaling is a factor 1.53, slightly larger than in Figure 1.
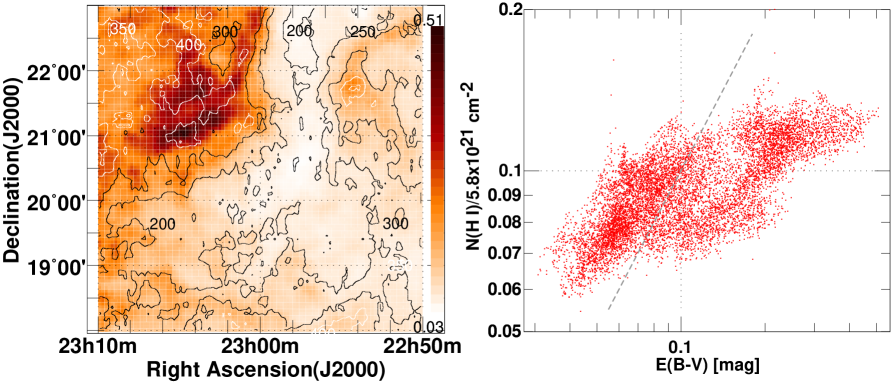
Shown at left in Figure 4 are overlays of the reddening (in pseudo-color) and contours of the H I profile integral for a region specifically chosen to contain a wide range in reddening and portions of the high-latitude CO-emitting cloud MBM53 (Magnani et al., 1985). This part of the sky near the MBM53-55 complex harbors a relatively large -fraction even in regions where E(B-V) mag (Liszt & Pety, 2012). Although the E(B-V) map and the contours of the H I profile integral correspond quite closely, the plot at right in Fig. 4 makes clear that the range of the H I column density is very much compressed compared to that of the reddening. The H I profiles are depressed by the presence of cold gas and a high molecular fraction at relatively small E(B-V) but N(H I) still lies well above the dashed line representing the canonical scaling between N(H) and E(B-V) at smaller values of E(B-V).
4 Discussion
4.1 Suggested corrections to SFD98
We noted in Section 3.1 and Figure 2 that the SFD98 results are generally larger than those of BH82. Schlafly & Finkbeiner (2011) and Schlafly et al. (2010) derived a 14% downward overall scaling of the SFD98 results and they and Berry et al. (2012) discuss corrections to the SFD98 reddening as well as a normalization difference between the north and south hemispheres of about 20%. Downward scaling of the SFD98 results would lessen some of the differences seen in Figure 2 while exacerbating the disparity in the E(B-V)-N(H I) comparison discussed here. Peek & Graves (2010) argued that the SFD98 reddening could be low by as much as 50% over limited portions of the sky where the dust temperature is low but generally confirmed the SFD98 values otherwise.
4.2 Prior uses of 21cm data
With respect to the radio data, the effect manifested in Figures 1, 3 and 4 is not subtle and it is perhaps surprising that it has not been previously called out . However, the effect can be found in the literature in various ways when it is sought; for instance Figure 4 of Abdo et al. (2010) where the SFD98 reddening is uniformly too small outside the molecular regions, compared to the canonically-scaled N(H I). This is as expected from the plot in Figure 1, showing the suppression of the H I profile integral for E(B-V) 0.1 mag.
Peek (2013) related both E(B-V) and a scaled representation of the optically thin values of N(H I) to his galaxy-color-derived reddening measure over a wide region around the North Galactic Cap. The implied E(B-V)-N(H I) relationship from his equations 1 and 2 is E(B-V) N(H I), very similar to the linear fit to the data shown in Figure 1, as noted in Section 3.1. At E(B-V) = 0.06 mag one has N(H I)/E(B-V) = /mag, tantamount to a 37% rescaling of the H I-E(B-V) ratio, compared to our fitted value of 43% using (lightly) optical-depth corrected N(H I) in Figure 1.
In the original discussion of Bohlin et al. (1978) it was noted that the slope of the N(H I)-E(B-V) relationship derived from contemporaneous 21cm H I measurements and galaxy counts was somewhat smaller, dN(H I)/dE(B-V) = mag-1 in Heiles (1976). This was consistent with the comparison between E(B-V) and N(H I) derived from the Ly- line, see just below. However, although the slope was correctly quoted, the discussion of Bohlin et al. (1978) glosses over an important aspect of the regression fit derived by Heiles (1976), E(B-V) = + N(H I)/. Regardless of whether the negative intercept is physically-based, as Heiles (1976) suggested might be the case (ie, gas without dust), it reflects very large ratios N(H I)/E(B-V) at low E(B-V), for instance N(H I)/E(B-V) = mag-1 at E(B-V) = 0.06 mag, quite in line with the present discussion.
4.3 N(H I) derived from Ly- absorption
The N(H I) data of Bohlin et al. (1978) derived from Ly- absorption are shown in Figure 5 and the behaviour is mostly opposite to that displayed in Figure 1 here. At lower E(B-V) the scatter is larger and the H I column densities are below E(B-V).
It was well understood that the sightlines selected for uv absorption measurements by Copernicus had low mean density and were biased toward lower -fractions (Bohlin et al., 1978). This in part explains the near coincidence of N(H I) and the canonical scaling of E(B-V) at E(B-V) 0.1 mag in Figure 5, well beyond the point at which E(B-V) and N(H I) diverge in Figure 1. However, assuming a fixed gas/dust ratio, there would be no reason to correct the derived N(H)/E(B-V) for a small fraction if both N(H I) and N() were accurately measured, no matter the sample biases.
The somewhat small values of N(H I)/E(B-V) at E(B-V) mag in Figure 5 could be explained by adding a 15% contribution for hydrogen that is ionized along the sightlines to those early-type stars: Bohlin et al. (1978) quote N(H I)/E(B-V) mag-1). However, aligning the radio and uv results below E(B-V) = 0.1 mag in this same way would require a very large contribution from ionized gas, of order 60% of the observed N(H I) derived from Ly-. Alternatively, the grains observed toward these stars may actually be different.
Diplas & Savage (1994) (see also Kim & Martin (1996)) used archival IUE spectra and expanded the sample of N(H I) derived from Ly- absorption by about a factor 5. They quote N(H I)/E(B-V) mag-1 at E(B-V) 0.1 mag, just as in Bohlin et al. (1978). However, for E(B-V) 0.1 mag their measurements give much higher N(H I)/E(B-V), more in line with what we derive, and opposite to the data of Bohlin et al. (1978) shown here in Figure 5.
5 Summary and conclusions
We compared IR-derived measures of E(B-V) and N(H I) derived from wide-field H I sky surveys at low (36′; Figure 1) and high (4′, Figures 3 and 4) spatial resolution in the 21 cm line and found a 40%-50% displacement between the resultant N(H I)/E(B-V) ratio mag-1 and the usually-quoted scaling N(H) E(B-V), at least at E(B-V) 0.1 mag where the fraction is low and little saturation of the H I profiles is evident. In any case, the commonly-cited systematic errors in deriving N(H I) from the H I profile, and the systematic deviations of N(H) and N(H I) to account for the contribution of ionized gas, would all increase the hydrogen column density and exaggerate the disparity between the two scaling relations.
Along the way we digressed to note that the IR dust emission-derived reddening is already larger than that derived from earlier all sky surveys of galaxy counts and that recent suggestions for recalibration of the reddening would lessen the disparity with earlier studies of galaxy counts but widen it with respect to our H I measure. We showed that there have been intimations of a high 21 cm-N(H I)/E(B-V) ratio for E(B-V) 0.1 mag for some time but that a somewhat opposite effect was seen in uv Ly- measurements of N(H I) toward early-type stars.
There is no doubt that the gas column density and dust optical depth are well and, apparently, linearly correlated on large scales at E(B-V) 0.1 mag, but the coefficient of proportionality seems to have been mis-estimated by a surprisingly large amount, for a surprisingly long while. If the FIR-derived E(B-V) and 21 cm-derived N(H I) have been measured correctly, they imply a 30% decrease in the accepted galactic E(B-V)/N(H) ratio at E(B-V) 0.08 mag where N(H I) N(H). Moreover, the obvious sources of possible error, opacity in the H I and the unobserved contribution of H II, both go in the direction of increasing the disparity. Conversely, if the stellar reddening and uv absorption measurements of H I and are also accurate, either a very large contribution from ionized gas was neglected toward the early-type stars or the dust optical depths per H-nucleus are larger than in the Galaxy at large.
In a subsequent paper we will discuss the physical reasons for the divergence between N(H I) and the linear E(B-V)-N(H I) scaling at E(B-V) 0.1 mag. By considering the H I profiles and the established empirical relationship between E(B-V) and the integrated H I optical depth, it is straightforward to show that saturation of the 21cm line is much less important than the conversion of hydrogen atoms to .
References
- Abdo et al. (2010) Abdo, A. A., Ackermann, M., Ajello, M., Baldini, L., Ballet, J., Barbiellini, G., Bastieri, D., Baughman, B. M., Bechtol, K., Bellazzini, R., Berenji, B., Bloom, E. D., Bonamente, E., Borgland, A. W., Bregeon, J., Brez, A., Brigida, M., Bruel, P., Burnett, T. H., Buson, S., Caliandro, G. A., Cameron, R. A., Caraveo, P. A., Casandjian, J. M., Cecchi, C., Celik, Ö., Chekhtman, A., Cheung, C. C., Chiang, J., Ciprini, S., Claus, R., Cohen-Tanugi, J., Cominsky, L. R., Conrad, J., Dermer, C. D., de Palma, F., Digel, S. W., Silva, E. d. C. e., Drell, P. S., Dubois, R., Dumora, D., Farnier, C., Favuzzi, C., Fegan, S. J., Focke, W. B., Fortin, P., Frailis, M., Fukazawa, Y., Funk, S., Fusco, P., Gargano, F., Gehrels, N., Germani, S., Giavitto, G., Giebels, B., Giglietto, N., Giordano, F., Glanzman, T., Godfrey, G., Grenier, I. A., Grondin, M.-H., Grove, J. E., Guillemot, L., Guiriec, S., Harding, A. K., Hayashida, M., Horan, D., Hughes, R. E., Jackson, M. S., Jóhannesson, G., Johnson, A. S., Johnson, W. N., Kamae, T., Katagiri, H., Kataoka, J., Kawai, N., Kerr, M., Knödlseder, J., Kuss, M., Lande, J., Latronico, L., Lemoine-Goumard, M., Longo, F., Loparco, F., Lott, B., Lovellette, M. N., Lubrano, P., Makeev, A., Mazziotta, M. N., McEnery, J. E., Meurer, C., Michelson, P. F., Mitthumsiri, W., Mizuno, T., Monte, C., Monzani, M. E., Morselli, A., Moskalenko, I. V., Murgia, S., Nolan, P. L., Norris, J. P., Nuss, E., Ohsugi, T., Okumura, A., Omodei, N., Orlando, E., Ormes, J. F., Paneque, D., Pelassa, V., Pepe, M., Pesce-Rollins, M., Piron, F., Porter, T. A., Rainò, S., Rando, R., Razzano, M., Reimer, A., Reimer, O., Reposeur, T., Rodriguez, A. Y., Ryde, F., Sadrozinski, H. F.-W., Sanchez, D., Sander, A., Saz Parkinson, P. M., Sgrò, C., Siskind, E. J., Smith, P. D., Spandre, G., Spinelli, P., Starck, J.-L., Strickman, M. S., Strong, A. W., Suson, D. J., Takahashi, H., Tanaka, T., Thayer, J. B., Thayer, J. G., Thompson, D. J., Tibaldo, L., Torres, D. F., Tosti, G., Tramacere, A., Uchiyama, Y., Usher, T. L., Vasileiou, V., Vilchez, N., Vitale, V., Waite, A. P., Wang, P., Winer, B. L., Wood, K. S., Ylinen, T., Ziegler, M., & Fermi/LAT Collaboration. 2010, ApJ, 710, 133
- Berry et al. (2012) Berry, M., Ivezić, Ž., Sesar, B., Jurić, M., Schlafly, E. F., Bellovary, J., Finkbeiner, D., Vrbanec, D., Beers, T. C., Brooks, K. J., Schneider, D. P., Gibson, R. R., Kimball, A., Jones, L., Yoachim, P., Krughoff, S., Connolly, A. J., Loebman, S., Bond, N. A., Schlegel, D., Dalcanton, J., Yanny, B., Majewski, S. R., Knapp, G. R., Gunn, J. E., Allyn Smith, J., Fukugita, M., Kent, S., Barentine, J., Krzesinski, J., & Long, D. 2012, ApJ, 757, 166
- Bohlin et al. (1978) Bohlin, R. C., Savage, B. D., & Drake, J. F. 1978, ApJ, 224, 132
- Burstein & Heiles (1982) Burstein, D. & Heiles, C. 1982, Astron. J., 87, 1165
- Dame et al. (2001) Dame, T. M., Hartmann, D., & Thaddeus, P. 2001, ApJ, 547, 792
- Dickey & Lockman (1990) Dickey, J. M. & Lockman, F. J. 1990, Ann. Rev. Astr. Ap., 28, 215
- Diplas & Savage (1994) Diplas, A. & Savage, B. D. 1994, ApJ, 427, 274
- Heiles (1976) Heiles, C. 1976, ApJ, 204, 379
- Heiles & Troland (2003) Heiles, C. & Troland, T. H. 2003, ApJ, 586, 1067
- Kalberla et al. (2005) Kalberla, P. M. W., Burton, W. B., Hartmann, D., Arnal, E. M., Bajaja, E., Morras, R., & Pöppel, W. G. L. 2005, A&A, 440, 775
- Kim & Martin (1996) Kim, S.-H. & Martin, P. G. 1996, ApJ, 462, 296
- Liszt & Lucas (2002) Liszt, H. & Lucas, R. 2002, A&A, 391, 693
- Liszt & Pety (2012) Liszt, H. S. & Pety, J. 2012, A&A, 541, A58
- Liszt et al. (2010) Liszt, H. S., Pety, J., & Lucas, R. 2010, A&A, 518, A45
- Magnani et al. (1985) Magnani, L., Blitz, L., & Mundy, L. 1985, ApJ, 295, 402
- Peek (2013) Peek, J. E. G. 2013, ApJ, 766, L6
- Peek & Graves (2010) Peek, J. E. G. & Graves, G. J. 2010, ApJ, 719, 415
- Peek et al. (2011) Peek, J. E. G., Heiles, C., Douglas, K. A., Lee, M.-Y., Grcevich, J., Stanimirović, S., Putman, M. E., Korpela, E. J., Gibson, S. J., Begum, A., Saul, D., Robishaw, T., & Krčo, M. 2011, Astrophys. J., Suppl. Ser., 194, 20
- Planck Collaboration et al. (2011) Planck Collaboration, Ade, P. A. R., Aghanim, N., Arnaud, M., Ashdown, M., Aumont, J., Baccigalupi, C., Balbi, A., Banday, A. J., Barreiro, R. B., & et al. 2011, A&A, 536, A19
- Savage et al. (1977) Savage, B. D., Drake, J. F., Budich, W., & Bohlin, R. C. 1977, ApJ, 216, 291
- Schlafly & Finkbeiner (2011) Schlafly, E. F. & Finkbeiner, D. P. 2011, ApJ, 737, 103
- Schlafly et al. (2010) Schlafly, E. F., Finkbeiner, D. P., Schlegel, D. J., Jurić, M., Ivezić, Ž., Gibson, R. R., Knapp, G. R., & Weaver, B. A. 2010, ApJ, 725, 1175
- Schlegel et al. (1998) Schlegel, D. J., Finkbeiner, D. P., & Davis, M. 1998, ApJ, 500, 525
- Spitzer (1968) Spitzer, L. 1968, Diffuse matter in space (New York: Interscience Publication, 1968)
| b | |||
|---|---|---|---|
| K-km s-1 | mag | ||
| -60o | 124 | 0.0238 | 9.92 |
| 60o | 102 | 0.0234 | 8.13 |
| -50o | 178 | 0.0431 | 8.61 |
| 50o | 136 | 0.0318 | 8.31 |
| -35o | 312 | 0.0951 | 7.36 |
| 35o | 252 | 0.0633 | 8.07 |
| -20o | 439 | 0.1821 | 6.55 |
| 20o | 412 | 0.1569 | 7.14 |
a rescaled by to give optically thin N(H I)