11email: vali@iac.es 22institutetext: Departamento de Astrofísica, Universidad de La Laguna. 38206, La Laguna, Tenerife, Spain 33institutetext: University Paris VII - Diderot, 5 Rue Thomas Mann, 75013 Paris, France 44institutetext: UNS-CNRS-Observatoire de la Côte d’Azur, B.P. 4229, 06304 Nice Cedex 4, France 55institutetext: Institut für Geophysik und extraterrestrische Physik, Technische Universität Braunschweig, Mendelssohnstr. 3, D-38106 Braunschweig, Germany
Thermophysical properties of near-Earth asteroid
(341843) 2008 EV5 from WISE data
Abstract
Aims. To derive the thermal inertia of 2008 EV5, the baseline target for the Marco Polo-R mission proposal, and infer information about the size of the particles on its surface.
Methods. Values of thermal inertia are obtained by fitting an asteroid thermophysical model to NASA’s Wide-field Infrared Survey Explorer (WISE) infrared data. From the constrained thermal inertia and a model of heat conductivity that accounts for different values of the packing fraction (a measure of the degree of compaction of the regolith particles), grain size is derived.
Results. We obtain an effective diameter , geometric visible albedo (assuming ), and thermal inertia J m-2s-1/2K-1at the 1- level of significance for its retrograde spin pole solution. The regolith particles radius is mm for low degrees of compaction, and mm for the highest packing densities.
Key Words.:
Minor planets, asteroids: individual: (341843) 2008 EV5 – Infrared: planetary systems – Radiation mechanisms: thermal1 Introduction
Potentially hazardous, near-Earth asteroid (341843) 2008 EV5, hereafter EV5, has been selected as the baseline target of the sample return mission Marco Polo-R, proposed to the European Space Agency with launch window between 2020 and 2024 (see https://www.oca.eu/MarcoPolo-R/index.html). Studying the nature of the surface of EV5 is therefore important, because collecting samples to obtain unaltered material will require different technological approaches depending on whether the outer layer consists of bare rock, fine-grained, or coarse-grained regolith. Information about regolith grain size can be derived using the heat conductivity model of Gundlach & Blum (2013) given a value of the thermal inertia, which in turn can be constrained by fitting a thermophysical model (TPM) to infrared data (see, e.g., Spencer et al. 1989; Spencer 1990; Lagerros 1996). Previous thermophysical studies of other mission targets can be found in, e.g., Müller et al. (2005, 2011); Wolters et al. (2011); Müller et al. (2012).
In addition, deriving surface physical properties of EV5 is interesting per se. First, thermal inertia plays a key role in the Yarkovsky effect, a non-gravitational dynamical force that induces a gradual drift in the orbits of asteroids with sizes of the order of 40 km and smaller (Bottke et al. 2006). Accounting for this effect is essential to determine accurate orbits of these objects, especially those classified as potentially hazardous (see Delbo’ & Tanga 2009, and references therein). Second, it was a very strong radar target that produced a high-resolution shape model at its December 2008 Earth approach (Busch et al. 2011). Finally, because in spite of the fact that its visible-to-near-infrared spectrum suggests that EV5 belongs to the C-complex (Reddy et al. 2012) and is thus carbonaceous-rich, its diameter of 400 50 m measured from radar observations by Busch et al. (2011) results in a value of geometric albedo of 0.12 0.04, which is slightly outside the limit of what has traditionally been considered primitive. This is also the case for (2) Pallas and the Pallas collisional family (see, for example, Alí-Lagoa et al. 2013).
In this work we apply an asteroid thermophysical model to fit EV5’s outstandingly large set of infrared data obtained by NASA’s Wide-field Infrared Survey Explorer (WISE) to derive its thermal inertia and draw conclusions about the characeteristic particle size of the regolith on its surface.
2 Data
A general introduction to WISE can be found in Wright et al. (2010) and references therein. The NEOWISE project enhanced the WISE data processing system to allow detection and archiving of solar system objects (for details, see Mainzer et al. 2011a). We obtain the data from the WISE All-Sky Single Exposure L1b Working Database, available via the IRSA/IPAC archive111http://irsa.ipac.caltech.edu/Missions/wise.html.
WISE used four broad-band filters with isophotal wavelengths at 3.4, 4.6, 12, and 22 m, referred to as W1, W2, W3, and W4, respectively (Wright et al. 2010). As explained in Alí-Lagoa et al. (2013), we follow a combination of criteria found in Mainzer et al. (2011b), Masiero et al. (2011), and Grav et al. (2012) to ensure the reliability of the data. We implement the correction to the red and blue calibrator discrepancy in W3 and W4, and we use a cone search radius of 0.3″ centred on the MPC ephemeris of the object in our queries. All artefact flags other than p, P, and 0 and quality flags other than A, B, and C222Indicating signal-to-noise ratios , , and , respectively are rejected, and we require the modified Julian date to be within four seconds of the time specified by the MPC. We ensure that the data is not contaminated by inertial sources by removing those points that return a positive match from the WISE Source Catalog within 6″. Finally, all remaining observations in band W1 were rejected since they are fewer than 40% of the data in the band with the maximum number of detections, namely W3. These criteria give a total of 489 useful data points, 158 in W2, 190 in W3, and 141 in W4.
Between EV5’s first and last observations by WISE, taken in 2010 Jan 25 and March 7, the asteroid heliocentric distance decreased slightly, from 1.043 AU to 1.028 AU, it drew closer to the Earth by 0.06 AU, from AU to AU, and the phase angle increased from 71.5∘to 75.3∘.
3 Thermophysical modelling of EV5
In this section we briefly describe the most relevant aspects of the thermophysical model (TPM) we employ. For more details, see Delbó et al. (2007), Delbo’ & Tanga (2009), and Mueller (2007). The technique consists of modelling the observed flux as a function of a given set of parameters and finding the set of parameter values, in our case thermal inertia, surface roughness and a scale factor for the asteroid shape, that minimise the , i.e.,
| (1) |
where runs through all observations, is the model flux, is the measured flux, and its corresponding error. is the unscaled mesh’s model flux, which depends on its shape and spin axis orientation as a function of the geometry of the observation –phase angle and heliocentric and geocentric distances– and the asteroid’s albedo, thermal inertia, and macroscopic surface roughness, the last three assumed to be constant in time and throughout the surface. We also assume that thermal inertia does not depend on the temperature. The factor is related to how we model the size of the object. Each vertex of mesh is characterized by a vector in a given reference frame whose modulus is expressed in some given units. By multiplying all these vectors’ moduli by the same linear scale , we are able to change the model’s size, and this factor is left to vary free and adjusted to minimise the . But because the model flux depends on the object’s area projected towards the observer, which depends on the square of this scaling factor, we have that the model flux is .
The shape of the asteroid is represented by a set of 512 triangular facets based on a detailed radar shape obtained by (Busch et al. 2011). We also took the following physical properties as input for the model: rotation period h (Galad et al. 2009), absolute magnitude (taken from the Small-Body Database of the Jet Propulsion Laboratory and rounded up to have one significant figure on the errorbar), and the retrograde pole-orientation solution preferred by Busch et al. (2011), namely (180∘, -84∘) ∘. Though Busch et al. (2011) conclude that EV5 rotates retrograde, we also modelled the prograde solution and our analysis consistently favours the retrograde case (for more details, see Sect. 4.1).
In the absence of macroscopic surface roughness and zero thermal inertia, the temperature of each facet is a function of the incident solar radiation absorbed, which in turn depends on its albedo, the heliocentric distance, and the projection of its area onto a plane perpendicular to the direction towards the Sun. Surface roughness, is modelled by adding to each facet a hemispherical crater of opening angle and crater surface density , which is the ratio of the area of the craters to the area of the facets. Each crater is in turn divided into facets (typically 40) in order to introduce the effects of multiple scattering, which increases the surface temperature relative to the single scattering case. Non-illuminated crater facets (shadowed) may be heated by reflected sunlight and/or emission from other crater facets, so they also contribute to the flux if they are visible to the observer. The effects of thermal conduction towards layers beneath the surface are accounted for by numerically integrating the one-dimensional heat-diffusion equation in each crater facet for a given value of thermal inertia. The net energy absorbed is re-emitted assuming the facets emit like grey bodies ( 0.9). Our TPM does not account for shape shadowing effects, but we expect these to be negligible. To qualitatively justify this, we calculated the number of facets with potential blockers located 20∘above their horizons. For the three shape models we used, namely the model introduced by Busch et al. (2011) with facets and the simplified models with and , we find that is about 0.05, a very small percentage considering that having such potential blockers above the local horizon does not necessarily imply shadowing, since the sun can still be in a direction where it is visible and it would probably not be blocked simultaneously for all these facets. This conclusion can also be drawn from the small total view factor calculated for EV5 by Rozitis & Green (2013), which is the mean fraction of sky subtended by other facets of the model for any given facet.
We thus calculated model fluxes for a wide range of preset values of thermal inertia, surface roughness, bolometric Bond albedo, and rotational phase , and adopted as best solution the one with the minimum . Thermal inertia values run from = 0 to 2500 J m-2s-1/2K-1, values typical of perfectly insulating material and basaltic rock (Jakosky 1986). Following the procedure of Mueller (2007), we used four preset combinations of (, ) to model surface roughness: no roughness (0∘, 0), low roughness (45∘, 0.5), medium roughness (68∘, 0.8), and high roughness (90∘, 0.9). As the rotational phase at the time of WISE observations cannot be accurately predicted from the rotational phase determined at the time of the radar observations (an error of 0.001 h for a period of about 3.725 h gives an error on the rotational phase of about 230 ∘/year), we treated as a free parameter which took on all values multiple of 10∘between 0∘ and 360∘. For more details, see Sect. 4.3 and Matter et al. (2011), Finally, the bolometric Bond albedo was varied from 0.01 to 0.10.
4 Results
In this section we present the best-fitting values of parameters, whereas in the following subsections we provide a detailed report on thermophysical analysis of EV5’s WISE data, including a brief account of the discarded prograde rotational solution of EV5, the effect of simplifying the shape model to the one we used with a smaller number of facets, the relative minima found in - space, and other possible sources of error that may explain the slightly high minimum effective achieved in our best-fit solution.
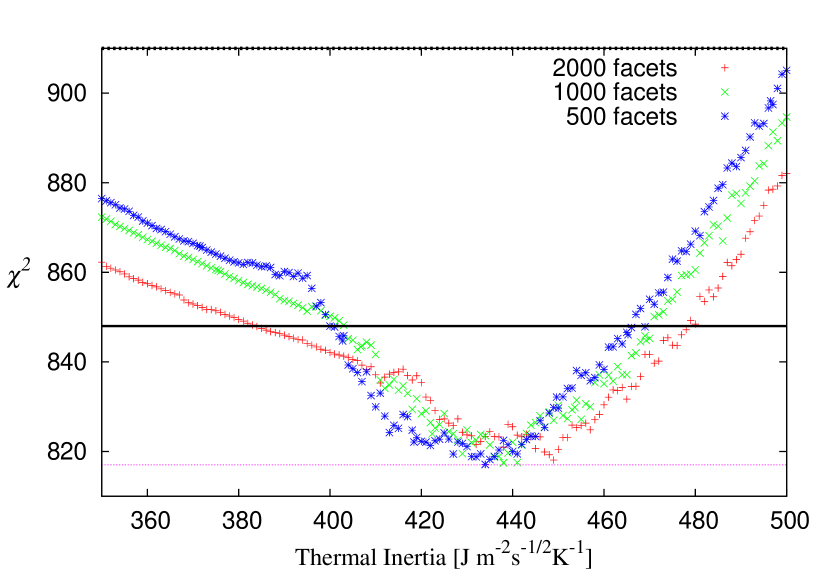
The minimum corresponds to an effective diameter (the diameter of the sphere with the same volume as the scaled shape model), thermal inertia J m-2s-1/2K-1, zero roughness (, ), Bond albedo 0.08, and rotational phase ∘ of the retrograde rotation model. In Fig. 1, we plot vs. thermal inertia for the ∘ models. Interestingly, the curve presents more than one relative minima for some cases, a situation never reported before in the literature (for a more detailed discussion, see Sect. 4.2).
Our minimum is of the order (though somewhat larger) of the effective number of degrees of freedom , where is the number of data points, and is the number of free parameters. Assuming that the data errors are normally distributed, our statistic has a standard deviation of the order of (see, for example, Press et al. 1986). To give a better idea of the goodness-of-fit and to estimate an errorbar for our best-fit parameters, we include the 1- and 3- levels in Fig. 1, represented as a solid and dashed horizontal line, respectively. Within a 1- confidence level, we can constrain to be within the interval (410, 490) J m-2s-1/2K-1, and the surface roughness at a macroscopic level to be negligible, though the minimum of the medium-roughness case is within the 1- limit. On the other hand, at the 3- level, we have J m-2s-1/2K-1, and it is not possible to constrain roughness. The effective diameter is at the 3- level and at the 1- level, which are within the errorbar of previous estimates. However, these errorbars do not take into account the propagation of the error in the spin pole solution or the uncertainty in the Bond albedo, which we cannot constrain. Taking the conservatively broad range of values of Bond albedo, the 1- errorbars in size and thermal inertia are increased: 370 6 m and 450 60 J m-2s-1/2K-1. The ensuing geometric visible albedo is , whose error is dominated by the uncertainty in the absolute magnitude. Note that this value of could be a small overestimate due to the systematic bias toward lower -values (especially 10) of widely used catalogues detected by Pravec et al. (2012).
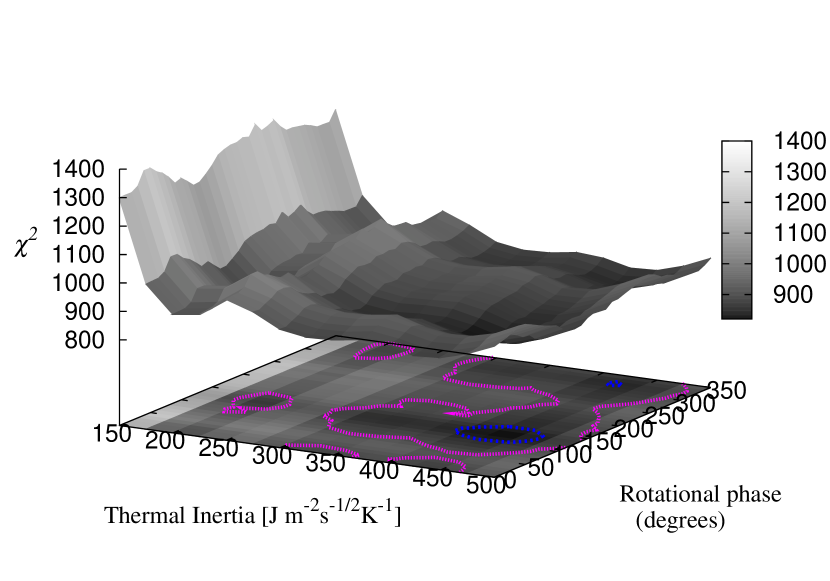
The situation with the rotational phase is more complicated. In Fig. 2, we show intensity maps of the values as functions of thermal inertia and rotational phase for the different roughness cases separately. The white, dashed lines show the 1- and 3- contours (when only one line is visible it corresponds to the latter case). At a 1- level of significance, the zero-roughness case presents two broad intervals of -values with minimum , namely between 90∘ and 180∘, and 300∘and 330∘. Again, we cannot constrain at the 3- level. In these plots, one can also see additional, shallower and broader minima at higher values of for the medium- and high-rougness models.


In Fig. 3 we plot the observed and model fluxes versus Julian Date (hereafter JD, starting to count from 1st January 2010) for the model with best-fitting parameter values. The data show a large degree of scatter as compared to the model, and visual inspection of these plots does not help to choose among models with different but similar values of or surface roughness since the data flux variations in the different bands mostly look uncorrelated to each other and the model. But while effects of shape, spin pole orientation, and rotational period are smaller than the data scatter, the thermal inertia and the diameter are well constrained by the TPM, which produces much better results for EV5 than the near-Earth asteroid thermal model (NEATM, Harris 1998). NEATM considers a non-rotating, perfectly-difussing (Lambertian), zero-thermal-inertia, spherical asteroid, whereas asteroids surfaces are almost always non-spherical, non-Lambertian, not exactly perfect insulators, and may be macroscopically rough. Thus, this idealised model uses a free parameter , the so-called “infrared beaming parameter”, that modifies its surface temperature distribution to better fit the real thermal fluxes of asteroids. Now, the results reported for EV5 in Table 1 of Masiero et al. (2011) cannot be directly compared because these authors do not fit the asteroid diameters when values are available from other more direct measurements (e.g., radar, stellar occultations), as is the case with EV5’s radar size from Busch et al. (2011). In addition, they use a different value of than we use here, namely 19.7. But from our NEATM, which essentially follows that described by Mainzer et al. (2011b) and Masiero et al. (2011) and which we validated in Alí-Lagoa et al. (2013), we obtain higher but compatible values of infrared beaming parameter and size: and 470 70 m.


4.1 The prograde pole solution
We modelled the two spin solutions of EV5 given by Busch et al. (2011). In Fig. 4 we plot the vs. thermal inertia curves for the prograde case with four different values of roughness and rotational phase , which verifies the minimum -values among all tested values of (see Sect. 4). The minimum for the prograde spin state clearly lies beyond the minimum the values of the 1- and 3- levels of significance of the retrograde case (black line and short-dashed line). These results are not unexpected since Busch et al. (2011) already concluded that EV5 rotates retrograde, but they quickly illustrate how thermophysical modelling can help to discriminate between the two possible spin state solutions and at the same time confirm the radar results.

4.2 The effects of using a model with a reduced number of facets
The shape model we used resulted from the smoothing of the original shape model given by Busch et al. (2011), i.e., it is a recomputed triangular mesh with the desired smaller number of triangular facets. While this will clearly reduce the computing time, which is proportional to the number of facets, it may affect the best-fit values and introduce errors in the solution. To study the effects of this approximation, we carried out a sweep of thermal inertia values with a much narrower sampling step around the minimum for three shape models with different number of facets. In all three cases the best-fit solutions had and zero roughness. As shown in Fig. 5, where we plotted vs. thermal inertia for those models, the shift in the best-fit value of produced by this simplification is small compared with its estimated uncertainty.
It is worth noting that the data set we used for this test is a preliminary one in which potential contamination by inertial sources was not addressed. In principle, very few non-inertial sources are expected to contribute significantly to the purely thermal bands W3 and W4, and in the particular case of EV5, the thermal emission in W2 is also expected to dominate (see Sect. 4.4 below). Indeed, none of our conclusions would be changed if we had not removed possible contamination from inertial sources, though the is reduced and the statistics improve slightly.
On the other hand, these tests showed a puzzling feature: there are several relative minima in the curves of Fig. 5. These features are unexpected since, in accordance with the long-proven validity of the model, the usually experiences a rapid increase when the values of the parameters are inadequate, and indeed such relative minima have never been reported before (to the best knowledge of the authors). One possibility is that these secondary minima are caused by slightly different values of thermal inertia and/or roughness better fitting different subset of data, since those two parameters affect the shape of the lightcurve. Nevertheless, the data scatter is so large that it would be impossible to make a meaningful analysis by visual inspection, as may be done when the data set is much smaller, of the order of few tens of measurements.
In addition, as already pointed out in the main text (see Figs. 1 and 2), there are also broad relative minima in –– space for the non-zero roughness cases. These broad minima are narrower and deeper (in relative terms) as roughness increases, which may be due to a trade-off between thermal inertia and roughness: higher degrees of roughness will increase the surface temperatures, which may be partially compensated by high values of thermal inertia. However, as we increase the roughness to very high values, the thermal inertia values that may compensate it is increasingly smaller and hence the minima are narrower.
4.3 Initial rotational phase as a free parameter
We need to give the asteroid shape model the right orientation in space as a function of time. This is accomplished by applying an appropriate sequence of rotations to all vertices of the model at every step, as described, e.g., by Kaasalainen et al. (2002). These rotations are needed to perform the orientation as well as for changing from ecliptic coordinates in a reference frame centered at the asteroid to cartesian coordinates in a frame co-rotating with the asteroid. In particular, the orientation corresponding to the instantaneous rotational phase is given by rotating the co-rotating frame an angle about the -axis, which is aligned with the spin axis of the asteroid, taken as input in ecliptic coordinates. Rotational phase at any given time is simply,
| (2) |
where is the corresponding value at . An alternative way to motivate the use of an offset rotational phase as a free parameter is given by Matter et al. (2011). In essence, the error in the absolute rotational phase of an asteroid grows in time after the reference epoch at which its period is determined. From Eq. (3) of Matter et al. (2011) we obtain 50∘ for EV5, which leads us to revise the value of this parameter.
The thermophysical model does not, however, give a constraint for rotational phase at the 3- level, but shows two intervals of possible -values at the 1- level. In Fig. 6 we plot, for all pairs –, the value of the minimum of all four models with zero, low, medium and hig roughness for the data set with potential contamination from inertial sources. By showing the 1- and 3- countours, in dark-blue and pink colours, this plot illustrates at a glance the uncertainty intervals in the thermal inertia and rotational phase values for any value of roughness.
4.4 The reflected sunlight component in W2 data
The TPM used here does not include the reflected sunlight component of fluxes in bands W1 and W2 (W3 and W4 fluxes are thermal-emission dominated). Thoug we rejected EV5 W1 data based on the minimum detection rate requirement (see Sect. 2), we would not have used this band in our modelling since W1 is dominated by reflected sunlight. Using the NEATM solution with km, and , we estimate that of the flux would be reflected sunlight. On the other hand, this component may contribute 3% to the total W2 flux of EV5. Failing to account for this could slightly but noticeably bias our results since, assuming333The largest SNRs of EV5’s W2 data are 10, though most have lower values, so this would be an upper limit. that all W2 points have signal-to-noise ratios (SNR) of 10, and given that we use 158 W2 points in our analysis, we would achieve an error 1% on the mean W2 flux. Nevertheless, the two-parameter (, ) phase function widely used to estimate the reflected sunlight for a given observation geometry (Bowell et al. 1989) has an uncertainty of about 5% in the final model flux in the W2 band. Because the contribution of the reflected light component itself is comparable to this uncertainty, we decided not to include it in the model.
4.5 The large concavity in EV5’s shape model


Busch et al. (2011) report that shape models without a large concavity could not fit EV5 radar data. Though the concavity is still clearly visible in the simplified mesh, this feature could potentially be a source of inaccuracies given our simplification of the shape model and the multiple reflections between facets within the concavity. If this effect was significant, we would expect the model fluxes to deviate periodically in accordance with the phases of the period in which the concavity is visible to the observer. To test this, in Fig. 7 we plotted vs. relative rotational phase, , for each WISE filer. Here, are the model fluxes and are the data points and corresponding errors at epoch of observation, . The relative rotational phase is calculated from the epoch of observation as follows:
| (3) |
where is the period and is the first epoch of observation in EV5’s data set, which is arbitrarily chosen here as phase zero. In view of Fig. 7, there seems to be no periodic maxima in the deviations of the model fluxes with respect to the data consistent throughout the three WISE bands, so the concavity’s effect is either satisfactorily accounted for by the model or, more likely, its effects are smaller than the data fluctuations. In any case, this is consistent with the conclusions of Rozitis & Green (2013), namely that the multiple reflections between its concavity and ensuing thermal emission do not have an influence on their prediction of EV5’s Yarkovsky-O’Keefe-Radzievskii-Paddack (YORP) effect, therefore it would be unexpected to see an influence on its thermal emision.
5 Regolith grain size
Thermal inertia measurements can be used to determine the grain size of the surface regolith of EV5 (Gundlach & Blum 2013). In the following, we explain our strategy for the grain size determination.
First, the thermal inertia is used to derive the heat conductivity of the surface regolith from
| (4) |
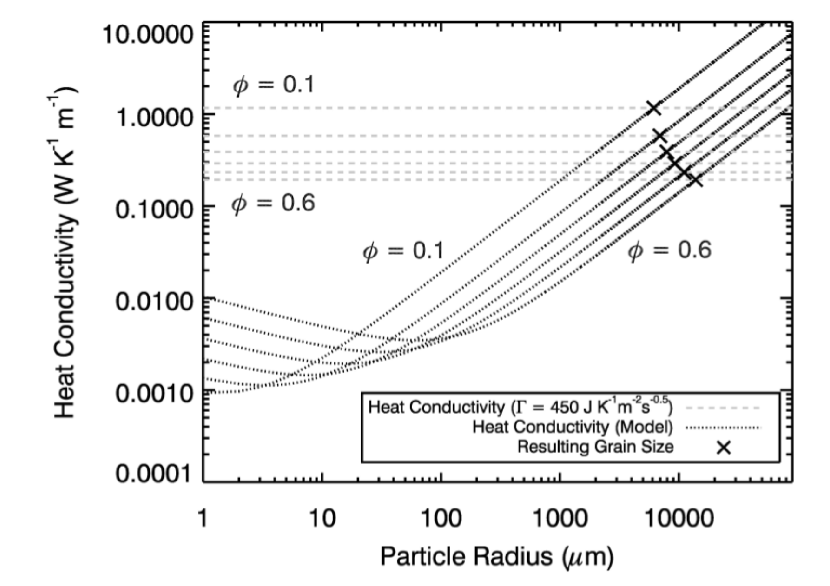
assuming plausible values for the volume filling factor , the mass density , and the heat capacity of the surface regolith. Since the packing density of the surface material is not known, the volume filling factor is treated as a free parameter and is varied between (extremely fluffy packing, plausible only for small regolith particles and low gravitational accelerations) and (close to the densest packing of equal-sized particles) in steps of . For the density and the heat capacity of the surface material, laboratory measurements of the density and heat conductivity of representative meteorites for C-type asteroids (CM2-type Cold Bokkeveld and CK4-type NWA 5515) are used, i.e., and (Opeil et al. 2010). The dashed lines in Fig. 8 show the derived values of the heat conductivity, following Eq. 4, for the different volume filling factors of the material and for a thermal-inertia value of 450 J m-2s-1/2K-1.
To derive from the thermal-conductivity value a typical regolith-grain size, we calculate the heat conductivity of the surface material using a model for the heat conductivity of granular material in vacuum (for details, see Gundlach & Blum 2013), which gives
| (5) |
Here, and are the mean regolith-grain radius and the regolith temperature, respectively. The first term on the rhs. of Eq. 5 describes the heat conduction through the solid network of regolith particles. Here, and are the heat conductivity of the bulk material of the regolith and the Hertz factor, respectively. The bulk heat conductivity of the surface material is derived from laboratory measurements of representative meteorites for C-type asteroids (Cold Bokkeveld and NWA 5515; see Opeil et al. 2010) by taking the porosities of the meteorites into account, . The Hertz factor describes the reduced heat flux through the contacts between the regolith particles and depends on the mean radius of the regolith particles, on their temperature , and on the volume filling factor of the surface material (for details, refer to Gundlach & Blum 2013). The Hertz factor also takes into account the irregularity of regolith-particle shapes and has been calibrated with lunar regolith (Gundlach & Blum 2013).
The second term in Eq. 5 takes the radiative heat conduction through the loose packing of regolith grains into account. Here, , and are the Stefan-Boltzmann constant, the emissivity of the regolith grains (assumed to be ), and the mean free path of the photons within the pore space of the regolith. The mean free path of the photons within the regolith pore space depends on the volume filling factor of the material and on the radius of the regolith grains and reads (see Gundlach & Blum 2013, for more details). The model predictions of the heat conductivity of the surface material, following Eq. 5, are shown in Fig. 8 (dotted curves) for different volume filling factors.
In the last step, the grain size of the surface regolith is derived from the comparison between the heat conductivity derived from the thermal-inertia measurements (dashed lines in Fig. 8) and the modelled heat conductivity as described above (dotted curves in Fig. 8). The intersections of the respective curves are denoted by the crosses in Fig. 8. One can see that the resulting grain radius is generally smaller for lower volume filing factors. For the low gravitational acceleration of EV5 of (based on typical C-complex bulk densities of 1400 kg m-3 given by Britt et al. 2002), it is possible that the inter-particle forces prevent the collapse of the regolith to its densest packing so that we cannot exclude low volume filling factors of . In this case, the mean particle radius is . If, however, the inter-particle forces are negligible with respect to gravity, then packing densities of are expected so that the mean particle radius becomes . The errors of the grain size estimations are then determined by quadratically adding the error of the thermal inertia measurements and the error due to the uncertainty in volume filling factor. For the error of the thermal inertia measurements we used the lower limit of and an upper limit of .
6 Discussion
The thermal inertia of EV5 obtained here is higher than the average value of km-sized NEAs (200 40 J m-2s-1/2K-1, Delbó et al. 2007), something to be expected for a smaller object. When compared to equally-sized, S-type Itokawa (750 J m-2s-1/2K-1, Müller et al. 2005), EV5’s smaller thermal inertia may be explained by their different compositions (assuming similar degrees of porosity), since more primitive C-complex asteroid such as EV5have much lower metallic content (or indeed none) than ollivine/pyroxene-rich S-types surfaces. When compared with other two similarly-sized, C-complex asteroids, (162173) 1999 JU3 and (175706) 1996 FG3, (for quick reference, see Table 3 of Gundlach & Blum 2013, and references therein), FG3 is approximately a factor of 3 larger and its thermal inertia is a third of EV5’s (Wolters et al. 2011), which result in its much smaller grain size of – mm. On the other hand, EV5 and JU3 have comparable gravitational acceleration and thermal inertia (Hasegawa et al. 2008) and their characteristic grain sizes are compatible within errorbars, though for EV5 the maximum value is about a factor of 2 smaller. With its somewhat smaller grain size, EV5’s thermal inertia matching that of JU3 could indicate a higher thermal conductivity and would be consistent with the suggestion of Busch et al. (2011) from radar albedo measurements–which are above the average for the 17 C-class, near-Earth asteroids observed with radar– that EV5’s surface material may contain some amount of metal. This can put a constraint on the possible meteorite analogues for EV5. Reddy et al. (2012) studied visible-to-near-infrared spectra of EV5 and preferred almost non-metallic, low albedo CI chondrites based on spectral slope and an unconfirmed absorption band at 0.48 m, but rejected as possible matches other carbonaceous chondrites (CR, CO, CH, and CK meteorites) with similar spectral slopes but higher metal content.
7 Conclusions
In this work we have performed thermophysical modelling of WISE data of (341843) 2008 EV5 using the two spin-pole solutions given by Busch et al. (2011). Our results favour the retrograde case, in consistency with the conclusions of Busch et al. (2011). The best-fit value of thermal inertia within 1-, i.e., J m-2s-1/2K-1, is attained for a rotational phase of 130∘ and considering no surface macroscopic roughness, though the last two parameters are not constrained at a 3- level of significance. The effective diameter and geometric visible albedo are and , also consistent with previous determinations. The errorbar in is at the 1- level and does not take into account the uncertainty in the spin pole solution, so it is a minimum error estimate. From the mentioned value of , the model of thermal conductivity by Gundlach & Blum (2013) results in a mean regolith-grain radius of mm for small values of the volume filling factor, and mm for the highest packing densities.
Acknowledgements.
We thank Dr. B. Rozitis for a thorough and constructive review that greatly improved this work. We have benefitted from discussions with J. Hanuš. VAL acknowledges support from the project AYA2011-29489-C03-02 (MEC, former Spanish Ministry of Education and Science). This work was supported by the grant 11-BS56-008 (Shocks) of the Agence National de la Recherche (ANR) of France. Bastian Gundlach was supported by DFG under Grant Bl 298/19-1. JL acknowledges support from the projects AYA2011-29489-C03-02 and AYA2012-39115-C03-03 (MINECO, Spanish Ministry of Economy and Competitiveness). This publication uses data products from NEOWISE, a project of the Jet Propulsion Laboratory/California Institute of Technology, funded by the Planetary Science Division of the NASA. We made use of the NASA/ IPAC Infrared Science Archive, which is operated by the Jet Propulsion Laboratory, California Institute of Technology, under contract with the NASA.References
- Alí-Lagoa et al. (2013) Alí-Lagoa, V., de León, J., Licandro, J., et al. 2013, A&A, 554, A71
- Bottke et al. (2006) Bottke, Jr., W. F., Vokrouhlický, D., Rubincam, D. P., & Nesvorný, D. 2006, Annual Review of Earth and Planetary Sciences, 34, 157
- Bowell et al. (1989) Bowell, E., Hapke, B., Domingue, D., et al. 1989, in Asteroids II, ed. R. P. Binzel, T. Gehrels, & M. S. Matthews, 524–556
- Britt et al. (2002) Britt, D. T., Yeomans, D., Housen, K., & Consolmagno, G. 2002, Asteroids III, 485
- Busch et al. (2011) Busch, M. W., Ostro, S. J., Benner, L. A. M., et al. 2011, Icarus, 212, 649
- Delbó et al. (2007) Delbó, M., Dell’Oro, A., Harris, A. W., Mottola, S., & Mueller, M. 2007, Icarus, 190, 236
- Delbo’ & Tanga (2009) Delbo’, M. & Tanga, P. 2009, Planet. Space Sci., 57, 259
- Galad et al. (2009) Galad, A., Vilagi, J., Kornos, L., & Gajdos, S. 2009, MPBu, 36, 116
- Grav et al. (2012) Grav, T., Mainzer, A. K., Bauer, J., et al. 2012, ApJ, 744, 197
- Gundlach & Blum (2013) Gundlach, B. & Blum, J. 2013, Icarus, 223, 479
- Harris (1998) Harris, A. W. 1998, Icarus, 131, 291
- Hasegawa et al. (2008) Hasegawa, S., Müller, T. G., Kawakami, K., et al. 2008, PASJ, 60, 399
- Jakosky (1986) Jakosky, B. M. 1986, Icarus, 66, 117
- Kaasalainen et al. (2002) Kaasalainen, M., Mottola, S., & Fulchignoni, M. 2002, Asteroids III, 139
- Lagerros (1996) Lagerros, J. S. V. 1996, A&A, 310, 1011
- Mainzer et al. (2011a) Mainzer, A., Bauer, J., Grav, T., et al. 2011a, ApJ, 731, 53
- Mainzer et al. (2011b) Mainzer, A., Grav, T., Masiero, J., et al. 2011b, ApJ, 736, 100
- Masiero et al. (2011) Masiero, J. R., Mainzer, A. K., Grav, T., et al. 2011, ApJ, 741, 68
- Matter et al. (2011) Matter, A., Delbo, M., Ligori, S., Crouzet, N., & Tanga, P. 2011, Icarus, 215, 47
- Mueller (2007) Mueller, M. 2007, Doctoral Dissertation (available from ArXiv e-prints)
- Müller et al. (2012) Müller, T. G., O’Rourke, L., Barucci, A. M., et al. 2012, A&A, 548, A36
- Müller et al. (2005) Müller, T. G., Sekiguchi, T., Kaasalainen, M., Abe, M., & Hasegawa, S. 2005, A&A, 443, 347
- Müller et al. (2011) Müller, T. G., Ďurech, J., Hasegawa, S., et al. 2011, A&A, 525, A145
- Opeil et al. (2010) Opeil, C. P., Consolmagno, G. J., & Britt, D. T. 2010, Icarus, 208, 449
- Pravec et al. (2012) Pravec, P., Harris, A. W., Kušnirák, P., Galád, A., & Hornoch, K. 2012, Icarus, 221, 365
- Press et al. (1986) Press, W. H., Flannery, B. P., & Teukolsky, S. A. 1986, Numerical recipes
- Reddy et al. (2012) Reddy, V., Corre, L. L., Hicks, M., et al. 2012, Icarus, 221, 678
- Rozitis & Green (2013) Rozitis, B. & Green, S. F. 2013, MNRAS, 433, 603
- Spencer (1990) Spencer, J. R. 1990, Icarus, 83, 27
- Spencer et al. (1989) Spencer, J. R., Lebofsky, L. A., & Sykes, M. V. 1989, Icarus, 78, 337
- Wolters et al. (2011) Wolters, S. D., Rozitis, B., Duddy, S. R., et al. 2011, MNRAS, 418, 1246
- Wright et al. (2010) Wright, E. L., Eisenhardt, P. R. M., Mainzer, A. K., et al. 2010, AJ, 140, 1868