Temperature dependence of crystal field excitations in CuO
Abstract
We report a study on the temperature dependence of the charge-neutral crystal field () excitations in cupric oxide, using nonresonant inelastic x-ray scattering (IXS) spectroscopy. Thanks to a very high energy resolution (=60 meV), we observe thermal effects on the excitation spectrum fine structure between temperatures of 10–320 K. With an increasing temperature, the spectra broaden considerably. We assign the temperature dependence of the excitations to the relatively large electron-phonon coupling.
Orbital physics in transition metal oxides (TMO’s) remains in the forefront of modern physics. The complex interplay between orbital and other electron degrees of freedom results in a wide range of phenomena that pose challenges for condensed-matter physics, such as metal-insulator transitions, superconductivity, and colossal magnetoresistance. Tokura and Nagaosa (2000) Cupric oxide CuO (tenorite) is an antiferromagnetic insulator that has recently attracted interest as an induced multiferroic with high (Ref. Kimura et al., 2008). Unlike its periodic-table neighbors NiO or CoO, CuO does not have a cubic structure with an octahedral coordination of the metal ion, but instead has a monoclinic unit cell and a slightly distorted square planar local coordination. These CuO4 units bear remarkable resemblance to the CuO2 planes in cuprate high- superconductors. The understanding of the electronic structure of CuO is thus an important benchmark for the quest on superconductivity. CuO also displays many intriguing properties such as charge-stripe ordering Zheng et al. (2000) and spin-phonon interaction. Chen et al. (1995)
The orbital excitations that take place within the shell of a transition metal ion, also called or crystal-field excitations, are well known probes of the local electronic structure. They have traditionally been studied using optical absorption spectroscopies, Rückamp et al. (2005) but electron-energy-loss spectroscopies Fromme (2001) and resonant IXS (RIXS) Ament et al. (2011); M. Moretti Sala et al. (2011); Ghiringhelli et al. (2004, 2009); J. Schlappa et al. (2012) have been relatively recent introductions to the excitation toolbox. Even more recently, non-resonant IXS (NRIXS) has emerged as complementary, bulk-sensitive and high-resolution tool for excitations. Larson et al. (2007); Haverkort et al. (2007) Indeed, in many transition metal oxides they have been extensively studied using NRIXS. Larson et al. (2007); Hiraoka et al. (2009, 2011); Iori et al. (2012); Huotari et al. (2010) A detailed theoretical framework has been formulated for the interpretation of non-resonant IXS for studies of excitations via an effective operator formalism. van Veenendaal and Haverkort (2008)
Only few studies have been reported on the crystal-field and charge-transfer excitations in CuO. Optical-absorption studies cannot probe it since the band gap Marabelli et al. (1995) is smaller than the excitation energy. Döring et al. Döring et al. (2004) studied CuO using RIXS by resonantly enhancing the charge-transfer excitation at the Cu absorption edge ( keV). Ghiringhelli et al. Ghiringhelli et al. (2004, 2009) have studied the excitations using RIXS at the Cu absorption edge ( eV). They reported excitation spectra centered at around 2 eV. However, detailed high-resolution analyses are needed in order to fully understand the spectral characteristics and assignment of this fundamentally important compound.
CuO exhibits two successive magnetic transitions at K and K.Forsynth et al. (1988); Yang et al. (1989) Below , CuO is in an antiferromagnetic commensurate collinear phase, and between the two transition temperatures in an incommensurate spiral phase. The latter phase has recently drawn interest because it has ferroelectric properties with a very high ferroelectric critical temperature .Kimura et al. (2008) The band gap has also been shown to have a strong dependence of temperature, due to a relatively strong electron-phonon coupling.Marabelli et al. (1995) The present study aimed at the determination of the spectra as a function of temperature, especially to see whether the two phase transitions or electron-phonon coupling have detectable influences on the spectral lineshape. While for example the electronic structure of CoO has been studied as a function of temperature recently, Kurian et al. (2013); Wray et al. (2013) for CuO temperature-dependent high-energy-resolution studies have not been reported to our knowledge.
In this article, we report high-resolution ( meV) NRIXS spectra of CuO in temperatures between 10–320 K. The observable in NRIXS is the intensity of radiation scattered via an inelastic process where both momentum and energy are transferred to the electron system.Schülke (2007) In the following we assume atomic units, i.e., . The probability for scattering is quantified by the doubly differential cross section, which is related to the electron dynamic structure factor Schülke (2007) as
where is the Thomson scattering cross section, and , the dynamic structure factor, contains the information on the material properties to be investigated. The same function is measured in electron energy loss spectroscopy (EELS). Fromme (2001) Both EELS and NRIXS have their advantages. In general, NRIXS has its strengths in being bulk sensitive, yielding also access to extreme sample environments such as high pressure, and having an access to high momentum transfers. The can be written as
where () and () are the initial and final states (energies) of the electron system, respectively, with a summation over all electrons . The dynamic structure factor is also related to the macroscopic dielectric function as
This equivalence is often used to relate optical spectra and dielectric screening to the results of an energy-loss experiment such as EELS or NRIXS.Huotari et al. (2010); Weissker et al. (2006) The theoretical framework on how NRIXS can access dipole-forbidden excitations in different systems has been laid down in, e.g., Refs. Soininen et al., 2005; Haverkort et al., 2007; Caciuffo et al., 2010; van Veenendaal and Haverkort, 2008; Gordon et al., 2008.
CuO has a monoclinic crystal structure (space group ) (Ref. Åsbrink and Norrby, 1970) with four nonequivalent Cu and O sites in the primitive unit cell.Forsynth et al. (1988); Yang et al. (1989) The lattice parameters are Å, Å, Å, , . The structure of CuO can be thought to consist of two different kinds of CuO4 plaquettes that are at an angle of 77.84∘ with respect to each other. The orientation of the -vector with respect to the planes is thus in general an average over the two nonequivalent planes.
In the following discussion we assume Cu2+ ions in a CuO4 plaquette with a point group symmetry. Within the crystal field model, Figgis and Hitchman (2000) the local field splits the energy levels to (), (), (), and doubly degenerate ( and ). In the ground state, the hole occupies the orbital. More refined calculations Eskes et al. (1990); Huang et al. (2011); Lany (2013); Iori et al. (2012); Rödl et al. (2008, 2009); Rödl and Bechstedt (2012); Schrön et al. (2012); Takahashi and Igarashi (1997); Haverkort et al. (2012) can be done in order to include Cu-O hybridization and band structure but the crystal field model is sufficient to capture the overall energy-level picture. The CuO4 plaquettes in CuO are not square, but rather nerly rectangular parallelograms with side lenghts of 2.62 Å and 2.90 Å, and exhibit two different Cu-O distances (1.95 Å and 1.96 Å). This lifts the degeneracy of the and orbitals, with an energy splitting that is expected to be 60 meV (Ref. Huang et al., 2011). This splitting would be expected to be resolvable with the energy resolution of the current study.
The experiment was performed at the beamline ID16 of the European Synchrotron Radiation Facility. id (1) The incident photon beam was monochromatised using a combination of Si(111) premonochromator and a Si(444) channel-cut to a bandwidth of 40 meV. The beam was focused using a toroidal mirror to a spot size of 30100 m2 (VH) on the sample. We used a spectrometer designed for NRIXS experiments.Verbeni et al. (2009) It was equipped with six diced Si() analysers fixed at a Bragg angle of 88.5∘, with a photon energy of 7.9 keV. The total energy resolution was 60 meV. The sample temperature was controlled using a miniature He-flow cryostat. The sample was a single crystal of CuO (the same as used in Ref. Döring et al., 2004). The spectra were measured at a fixed momentum transfer value Å with the average in the direction . Based on the expected angular dependence of excitations van Veenendaal and Haverkort (2008), in this geometry the and peaks are expected to be excited most strongly, with the peak to be weak. The spectra were measured in several temperatures between 10 K and 320 K.
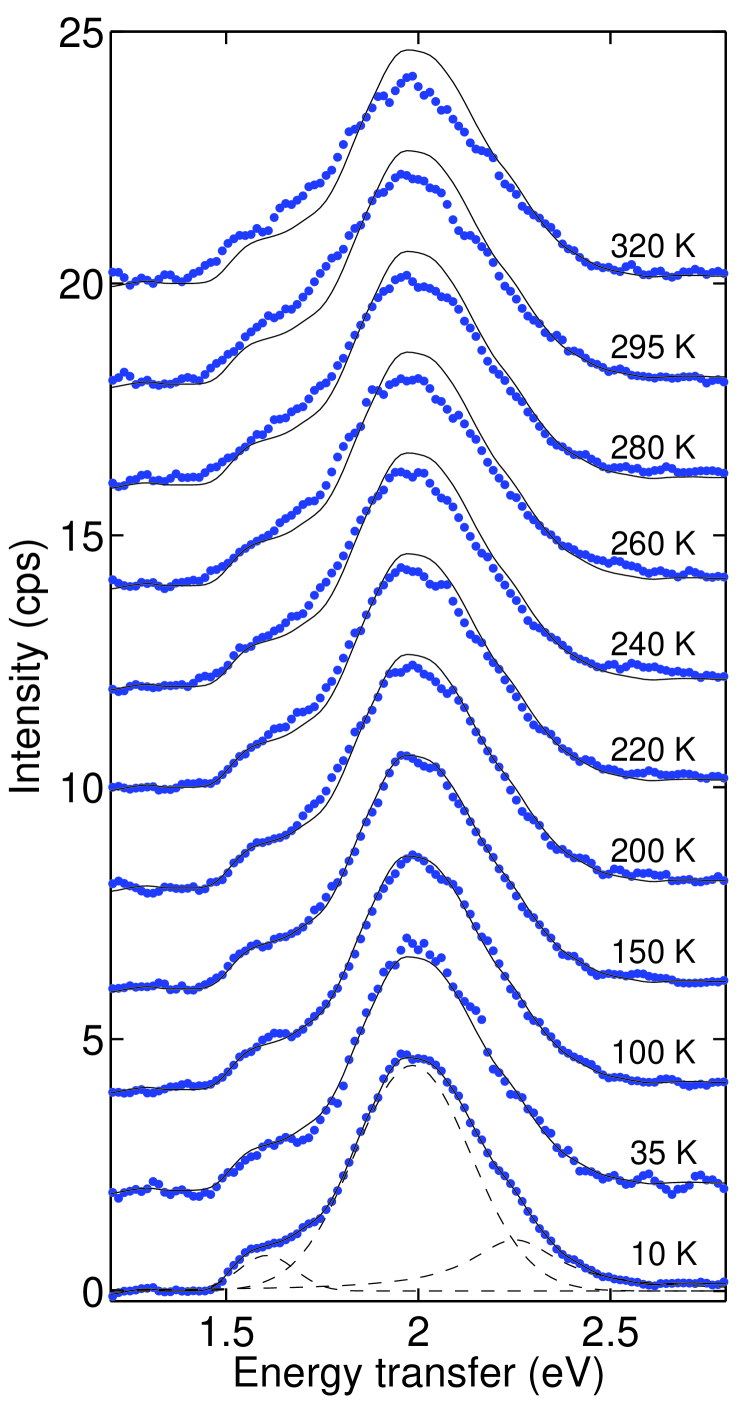
All collected spectra as a function of temperature, after subtracting a sloping background due to the quasielastic line tail, are shown in Figure 1. The spectra have been normalised to have the same area between 1–3 eV. The spectra can be broken into a few components: a main peak at 2 eV and a weaker peak manifesting itself as a shoulder at 1.6 eV, and an even weaker shoulder (mainly visible at lowest temperatures) at 2.2 eV. A recent ab initio calculationHuang et al. (2011) predicts the peaks to be assigned as, from lowest to highest energy, excitations from the orbital to the , , and orbitals. The assignment of the peaks to specific -orbital can be confirmed with either angular dependence M. Moretti Sala et al. (2011) or their dependence on (Ref. van Veenendaal and Haverkort, 2008), which are subject of consequent studies. In this particular work, we concentrate on the overall temperature dependence of the spectra.
The main effect of increasing temperature from K is a clear broadening of the overall spectral shape. Due to the broadening, the low-energy shoulder seems to merge into the main peak and is nearly undetectable at room temperature. Thus, an important result is the bandwidth of the excitations: with a 60-meV energy resolution the main peak has a width of the order of 400 meV even at K. This is partly due to the overlap of the and the excitation but even then the individual components have a width of about 300–400 eV. While in the orbital ionic picture the states are expected to have a very narrow line shape, when switching on the band structure the states gain non-negligible bandwidth due to the electron-ion interaction and hybridization. Ching et al. (1989); Wu et al. (2006); Lany (2013); Heinemann et al. (2013) The observed width extrapolated to K thus may reflect the width of the density of states of the occupied and unoccupied bands.Iori et al. (2012) Time-dependent density functional theory that takes into account band structure, realistic transition matrix elements and local field effects could possibly explain the spectral linewidth and shape in a more detailed way. Gurtubay et al. (2005); Huotari et al. (2009); Kozhevnikov et al. Another way of viewing this is to consider that excitations couple to the continuum states beyond the band gap. Thus the temperature dependence could be quantified by relating the width as a function of temperature to the thermal behavior of the band gap itself. It should be noted that the excitations in NiO also have non negligible band width of the order of meV, Huotari et al. even though the band gap is larger in NiO (4 eV in comparison to 1.35 eV of CuO in room temperature).
In order to quantify the change in the shape as a function of temperature, we fitted the spectra by Pearson VII functions. Wang and Zhou (2005) An example of such fit in the case of K is shown in Figure 1. Since the lowest and highest energy peaks are weak in this geometry, their position nor width can not be fitted very reliably. However, the determination of the width of the main peak at 2.0 eV can be done with a very high accuracy. The resulting fitted values for the width (full-width-at-half maximum, FWHM) of the 2.0-eV peak are shown in Fig. 2 as a function of temperature. One important result is that the peak width across different temperatures does not have a significant relation to the magnetic transitions as it does not exhibit significant changes across either transition temperature. Instead, the thermal behavior of the peak width seems to be rather smooth across the studied temperature range.
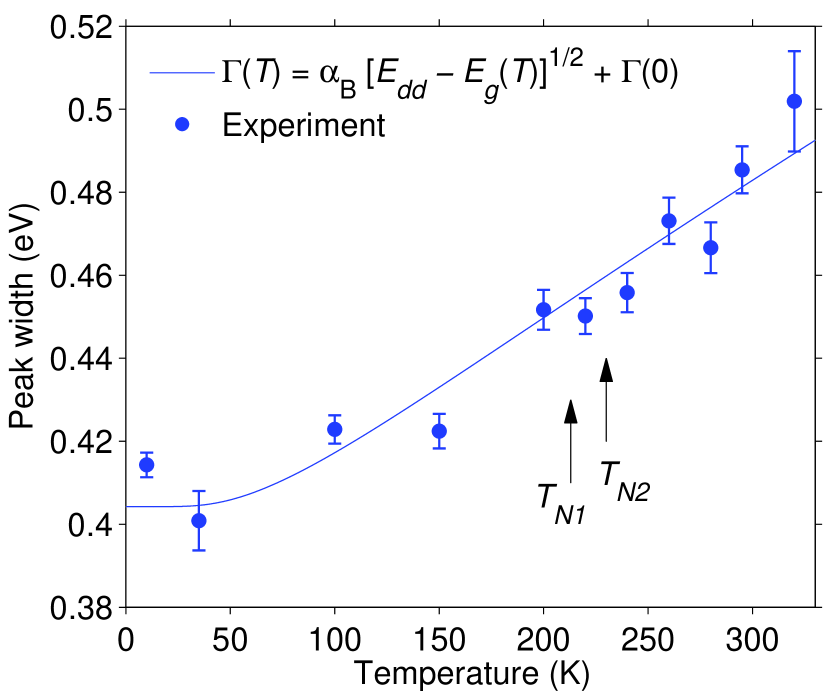
Thus, the effect of temperature on excitations in CuO is clear and easily detectable. The width of the band gap of CuO has been reported to vary from eV at K to 1.35 eV at K.Marabelli et al. (1995) If the relatively large width of the excitations ( 400 meV) is due to interaction with continuum states owing to the presence of the band gap, the decreasing gap width with increasing temperature could explain the observed behavior. In this scenario, an increase of the density of states at, or near to, the energy of excitations could increase the width of the peaks. The temperature-dependence of the optical gap has been explained to be due to the large electron-phonon coupling. Marabelli et al. (1995) Electron-phonon coupling thus seems a natural reason for the temperature-dependence of the excitations as well.
Using a Bose-Einstein statistical factor for phonons with average energy of , the gap energy as a function of temperature Marabelli et al. (1995) can be fitted to a formLautenschlager et al. (1987)
with eV, eV and K. We assume a density of states above the gap of the free-electron form , when , and when . Assuming a linear dependence of the spectral linewidth on the density of states at the excitation energy,
we get a good agreement with the experiment with eV and eV1/2. The resulting fit is shown in Fig. 2. Even if the observed peak here is a superposition of different excitations, which gives a non-negligible contribution to , the temperature dependence is the most interesting result here. The fit agreement is good, yielding insight that the interaction with the continuum states could be the underlying reason for the excitation lineshape. The temperature dependence shows a good agreement with a correspondence to the band gap variation that in turn has its underlying reasons in the electron-phonon coupling.
The ab initio optical absorption spectrum in the range of excitations in NiO has been calculated based on molecular dynamics simulations in finite temperature, Domingo et al. (2012) but to our knowledge, such calculations do not exist for CuO. A finite distribution of Cu-O bond lengths in finite temperatures, due to thermal disorder, is expected to have an effect similar to the one observed here. This is because the excitation energy is proportional to , where is the Cu-O bond distance. Further, in principle, the coupling to the lattice could be possibly quantified from phonon parameters. Kuz’menko et al. (2001); Homes et al. (1995) However, the good agreement obtained by using the phenomenological fit to the band-gap energy, already gives important insights to the coupling of the excitations to the band gap and the electron-phonon coupling.
In conclusion, we have measured the excitation spectra of bulk CuO with non-resonant IXS with high energy resolution as a function of temperature. Most importantly, the study reveals the coupling of the orbital excitations to phonons via the temperature dependence of the spectral shape. The spectral changes can be understood of being due to the interaction with the continuum states above the band gap, which in turn depends on temperature due to electron-phonon coupling. These results are important to understand the bandwidth related to the excitations and their temperature dependence.
Acknowledgements.
Beamtime was granted by the European Synchrotron Radiation Facility. Funding was provided by the Academy of Finland (Grants 1256211, 1127462, and 1259526) and University of Helsinki Research Funds (Grant 490076). We are grateful for C. Henriquet, M.-C. Lagier, and the whole beamline ID16 team and support groups for expert assistance, advice, and encouragement in the experiment. We would like to thank M. W. Haverkort, M. Hakala, M. Gatti, and C. Rödl for fruitful discussions.References
- Tokura and Nagaosa (2000) Y. Tokura and N. Nagaosa, Science 288, 462 (2000).
- Kimura et al. (2008) T. Kimura, Y. Sekio, H. Nakamura, T. Siegrist, and A. P. Ramirez, Nature Mater. 7, 291 (2008).
- Zheng et al. (2000) X. G. Zheng, C. N. Xu, Y. Tomokiyo, E. Tanaka, H. Yamada, and Y. Soejima, Phys. Rev. Lett. 85, 5170 (2000).
- Chen et al. (1995) X. K. Chen, J. C. Irwin, and J. P. Franck, Phys. Rev. B 52, R13130 (1995).
- Rückamp et al. (2005) R. Rückamp, E. Benckiser, M. W. Haverkort, H. Roth, T. Lorenz, A. Freimuth, L. Jongen, A. Möller, G. Meyer, P. Reutler, et al., New J. Phys. 7, 144 (2005).
- Fromme (2001) B. Fromme, d-d excitations in transition metal oxides (Springer-Verlag, Berlin, 2001).
- Ament et al. (2011) L. J. P. Ament, M. van Veenendaal, T. P. Devereaux, J. P. Hill, and J. van den Brink, Rev. Mod. Phys 83, 705 (2011).
- M. Moretti Sala et al. (2011) M. Moretti Sala et al., New Journal of Physics 13, 043026 (2011).
- Ghiringhelli et al. (2004) G. Ghiringhelli et al., Phys. Rev. Lett. 92, 117406 (2004).
- Ghiringhelli et al. (2009) G. Ghiringhelli et al., Eur. Phys. J. Special Topics 169, 199 (2009).
- J. Schlappa et al. (2012) J. Schlappa et al., Nature 485, 82 (2012).
- Larson et al. (2007) B. C. Larson, W. Ku, J. Z. Tischler, C.-C. Lee, O. D. Restrepo, A. G. Eguiluz, P. Zschack, and K. D. Finkelstein, Phys. Rev. Lett. 99, 026401 (2007).
- Haverkort et al. (2007) M. W. Haverkort, A. Tanaka, L. H. Tjeng, and G. A. Sawatzky, Phys. Rev. Lett. 99, 257401 (2007).
- Hiraoka et al. (2009) N. Hiraoka, H. Okamura, H. Ishii, I. Jarrige, K. D. Tsuei, and Y. Q. Cai, Eur. Phys. J. B 70, 157 (2009).
- Hiraoka et al. (2011) N. Hiraoka, M. Suzuki, K. D. Tsuei, H. Ishii, Y. Q. Cai, M. W. Haverkort, C. C. Lee, and W. Ku, EPL 96, 37007 (2011).
- Iori et al. (2012) F. Iori, F. Rodolakis, M. Gatti, L. Reining, M. Upton, Y. Shvyd’ko, J.-P. Rueff, and M. Marsi, Phys. Rev. B 86, 205132 (2012).
- Huotari et al. (2010) S. Huotari, J. A. Soininen, G. Vankó, G. Monaco, and V. Olevano, Phys. Rev. B 82, 064514 (2010).
- van Veenendaal and Haverkort (2008) M. van Veenendaal and M. W. Haverkort, Phys. Rev. B 77, 224107 (2008).
- Marabelli et al. (1995) F. Marabelli, G. B. Parravicini, and F. Salghetti-Drioli, Phys. Rev. B 52, 1433 (1995).
- Döring et al. (2004) G. Döring et al., Phys. Rev. B 70, 085115 (2004).
- Forsynth et al. (1988) J. B. Forsynth, P. J. Brown, and B. M. Wanklyn, J. Phys. C: Solid State Phys. 21, 2917 (1988).
- Yang et al. (1989) B. X. Yang et al., Phys. Rev. B 39, 4343 (1989).
- Kurian et al. (2013) R. Kurian, M. M. van Schooneveld, N. Zoltán, G. Vankó, and F. M. F. de Groot, J. Phys. Chem. C 117, 2976 (2013).
- Wray et al. (2013) L. A. Wray, J. Li, Z. Q. Qiu, J. Wen, Z. Xu, G. Gu, S.-W. Huang, E. Arenholz, W. Yang, Z. Hussain, et al., Phys. Rev. B 88, 035105 (2013).
- Schülke (2007) W. Schülke, Electron Dynamics by Inelastic X-Ray Scattering (Oxford University Press, Oxford, 2007).
- Weissker et al. (2006) H.-C. Weissker, J. Serrano, F. Bruneval, F. Sottile, S. Huotari, G. Monaco, M. Krisch, V. Olevano, and L. Reining, Phys. Rev. Lett. 97, 237602 (2006).
- Soininen et al. (2005) J. A. Soininen, A. L. Ankudinov, and J. J. Rehr, Phys. Rev. B 72, 045136 (2005).
- Caciuffo et al. (2010) R. Caciuffo et al., Phys. Rev. B 81, 195104 (2010).
- Gordon et al. (2008) R. A. Gordon, G. T. Seidler, T. T. Fister, M. W. Haverkort, G. A. Sawatzky, A. Tanaka, and T. K. Sham, EPL 81, 26004 (2008).
- Åsbrink and Norrby (1970) S. Åsbrink and L.-J. Norrby, Acta Crystallogr. Sect. B: Struct. Crystallogr. Cryst. Chem. (1970).
- Figgis and Hitchman (2000) B. N. Figgis and M. A. Hitchman, Ligand field theory and its applications (Wiley-VCH, 2000).
- Eskes et al. (1990) H. Eskes, L. H. Tjeng, and G. A. Sawatzky, Phys. Rev. B 42, 288 (1990).
- Huang et al. (2011) H.-Y. Huang, N. A. Bogdanov, L. Siurakshina, P. Fulde, J. van der Brink, and L. Hozoi, Phys. Rev. B 84, 235125 (2011).
- Lany (2013) S. Lany, Phys. Rev. B 87, 085112 (2013).
- Rödl et al. (2008) C. Rödl, F. Fuchs, J. Furthmüller, and F. Bechstedt, Phys. Rev. B 77, 184408 (2008).
- Rödl et al. (2009) C. Rödl, F. Fuchs, J. Furthmüller, and F. Bechstedt, Phys. Rev. B 79, 235114 (2009).
- Rödl and Bechstedt (2012) C. Rödl and F. Bechstedt, Phys. Rev. B 86, 235122 (2012).
- Schrön et al. (2012) A. Schrön, C. Rödl, and F. Bechstedt, Phys. Rev. B 86, 115134 (2012).
- Takahashi and Igarashi (1997) M. Takahashi and J. Igarashi, Phys. Rev. B 56, 12818 (1997).
- Haverkort et al. (2012) M. W. Haverkort, M. Zwierzycki, and O. K. Andersen, Phys. Rev. B 85, 165113 (2012).
- id (1) In 2013, The IXS beamline ID16 was replaced by a new upgraded beamline ID20 of the European Synchrotron Radiation Laboratory.
- Verbeni et al. (2009) R. Verbeni, T. Pylkkänen, S. Huotari, L. Simonelli, G. Vankó, K. Martel, C. Henriquet, and G. Monaco, J. Synchrotron Radiat. 16, 469 (2009).
- Ching et al. (1989) W. Y. Ching, Y.-N. Xu, and K. W. Wong, Phys. Rev. B 40, 7684 (1989).
- Wu et al. (2006) D. Wu, Q. Zhang, and M. Tao, Phys. Rev. B 73, 235206 (2006).
- Heinemann et al. (2013) M. Heinemann, B. Eifert, and C. Heiliger, Phys. Rev. B 87, 115111 (2013).
- Gurtubay et al. (2005) I. G. Gurtubay, J. M. Pitarke, W. Ku, A. G. Eguiluz, B. C. Larson, J. Tischler, P. Zschack, and K. D. Finkelstein, Phys. Rev. B 72, 125117 (2005).
- Huotari et al. (2009) S. Huotari, C. Sternemann, M. C. Troparevsky, A. G. Eguiluz, M. Volmer, H. Sternemann, H. Müller, G. Monaco, and W. Schülke, Phys. Rev. B 80, 155107 (2009).
- (48) A. V. Kozhevnikov, M. C. Troparevsky, T. C. Schulthess, A. G. Eguiluz, T. Pylkkänen, L. Paolasini, P. A. Metcalf, G. Monaco, and S. Huotari, to be published.
- (49) S. Huotari et al., to be published.
- Wang and Zhou (2005) H. J. Wang and J. Zhou, J. Appl. Cryst. 38, 830 (2005).
- Lautenschlager et al. (1987) P. Lautenschlager, M. Garriga, L. Viña, and M. Cardona, Phys. Rev. B 36, 1987 (1987).
- Domingo et al. (2012) A. Domingo, A. Rodríguez-Fortea, M. Swart, C. de Graaf, and R. Broer, Phys. Rev. B 85, 155143 (2012).
- Kuz’menko et al. (2001) A. B. Kuz’menko et al., Phys. Rev. B 63, 094303 (2001).
- Homes et al. (1995) C. C. Homes, M. Ziaei, B. P. Clayman, J. C. Irwin, and J. P. Franck, Phys. Rev. B 51, 3140 (1995).