Local increase of symmetry on cooling in KNi2Se2
Abstract
KNi2Se2 exhibits an increase of symmetry on cooling below K, as observed by Raman spectroscopy and synchrotron x-ray diffraction. X-ray absorption spectroscopy confirms that the symmetry increase is due to changes in nickel-nickel interactions and suppression of charge density wave fluctuations. Density functional theory calculations reveal a zone- boundary lattice instability that provides a model of the room-temperature x-ray pair distribution function data, but fails to describe the higher local symmetry observed for K. Together, these results support many- body correlation effects as drivers for the unusual heavy fermion electronic ground state in KNi2Se2.
Strong electron-electron and electron-phonon interactions give rise to broken symmetry states. A prototypical example is the charge density wave (CDW) state, which lowers the symmetry and introduces an additional periodic modulation of electron density.Gruner (1994); Johannes and Mazin (2008); Eiter et al. (2013) CDWs belong to a larger family of spontaneous charge separation phenomena, such the charge ordering observed in the manganites Mitchell et al. (2001); Bozin et al. (2007) and organic conductors.Merino and McKenzie (2001) In these materials, the formation of charge-separated states is almost always observed at low temperature, when thermal fluctuations are no longer able to disrupt the electronic order. In rare situations, many-body interactions can produce a re-entrant transition in which the charge periodicity is destroyed and higher symmetry is restored on further cooling.Merino and McKenzie (2001); Murray and Tešanović (2013) In fact, a decrease of charge-order fluctuations on cooling has been observed in metallic organic conductors with 1/4-filled bands that are close to charge order; the experimentally observed response is rather weak since the effect results from the electronic repulsion within a single band.Merino et al. (2006)
We have recently discovered that KNi2S2 Neilson et al. (2013) and KNi2Se2 Neilson et al. (2012); Neilson and McQueen (2012) have signatures of CDW fluctuations at room temperature that disappear below K. This surprising observation has stimulated extensive experimental Lazarević et al. (2013); Lei et al. (2012); Wang et al. (2013a, b); Hardy et al. (2013) and theoretical Murray and Tešanović (2013); Stanev and Littlewood (2013); Bannikov and Ivanovskii (2013a); Lu et al. (2012); Bannikov and Ivanovskii (2013b) studies aimed at understanding the unusual nature of charge coupling with spin, orbital, and lattice degrees of freedom.
Most strikingly, KNi2Se2 shows an increase of carrier mobility () below K that occurs at the same temperature at which CDW fluctuations disappear. The compound enters a heavy fermion state below K with an effective electronic mass of 6 to 18, and superconductivity below =0.8 K.Neilson et al. (2012) Our studies showed that the magnetic response is rather weak and temperature independent.Neilson et al. (2012) An explanation of a heavy fermion state was proposed in terms the fluctuation of a CDW involving electron-electron correlations.Murray and Tešanović (2013). The theory suggests that the loss of CDW fluctuations at low temperature results from both many-body physics and the hybridization between the localized, 1/4-filled band and a dispersive conduction band.
In this letter, we determine that there is an increase in symmetry on cooling in KNi2Se2, likely driven by electronic correlations. Raman spectroscopy provides direct evidence for the increase of local point group symmetry and loss of CDW fluctuations in KNi2Se2 on cooling. An analysis of the structure derived from high-resolution powder synchrotron x-ray diffraction (SXRD) shows signatures of the CDW fluctuations, due to out-of-plane displacements of Ni atoms at room temperature, that then disappear on cooling. X-ray absorption spectroscopy (XAS) and the extended x-ray absorption fine structure (EXAFS) confirm that the CDW fluctuations arise from displacements of the positions of nickel atoms. Density functional theory (DFT) calculations predict an intrinsic lattice instability driven by electron-phonon coupling. A calculated imaginary frequency phonon mode at the zone boundary qualitatively reproduces the room-temperature distortion observed by synchrotron x-ray total scattering, but fails to describe the low temperature ground state of KNi2Se2. In agreement with the theoretical work on the canonical CDW materials,Johannes and Mazin (2008), the nature of the CDW fluctuations in this material implies that the fluctuations are not driven by Fermi surface nesting, but are instead driven by local bonding interactions.
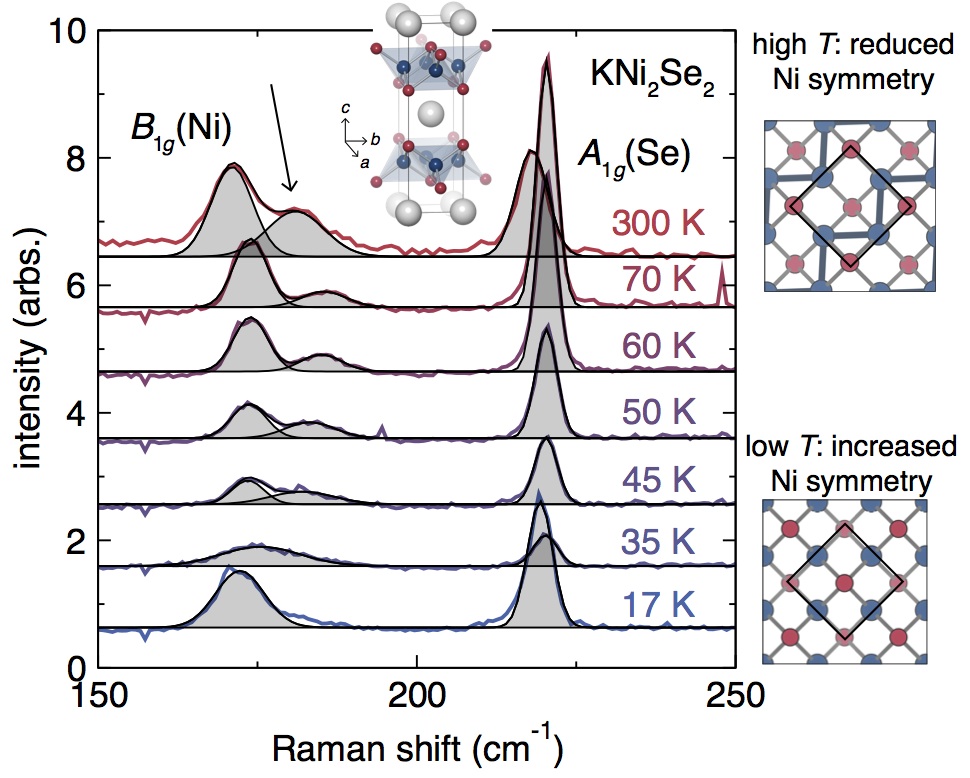
Raman spectra were obtained from the () plane of single micro-crystals in a parallel-sided fused silica capillary (evacuated to torr at RT) in a T64000 Jobin-Yvone spectrometer equipped with an Olympus microscope. The laser power was below 0.3 mW to avoid sample heating, estimated by comparing Stokes and anti-Stokes spectra at K. From a symmetry analysis of the low-temperature crystal structure presented in Ref. Neilson et al. (2012) (space group ), we expect four Raman-active optical phonons.Orobengoa et al. (2009) In particular, Ni atoms in ( Wyckoff positions, Ref. Neilson and McQueen (2012)) contribute and modes, of which only is observed in the () plane. Se atoms ( Wyckoff positions, Ref. Neilson and McQueen (2012)) show and Raman active modes, of which only is observed in the () plane. Indeed, in the Raman spectra at the lowest temperatures we observe two strong bands, located at 171 and 219 cm-1 (21.2 and 27.2 meV; Fig. 1), which we assign to the vibration of Ni atoms and the vibration of Se atoms, respectively, based on our calculations and Ref. Lazarević et al. (2013). The low temperature spectrum of KNi2Se2 has a shape very similar to the non-stoichiometric compound K0.95Ni1.86Se2, for which no distortion is reported,Lazarević et al. (2013) even though the frequencies in the spectra of KNi2Se2 are higher.
On increasing the temperature above 50 K, the lower-frequency Raman band shifts to higher frequencies, and another phonon becomes well resolved at 186 cm-1. This shape of the spectra persists to room temperature. The appearance of an additional phonon mode for K is a direct evidence for a decrease in local point symmetry of KNi2Se2 on warming.
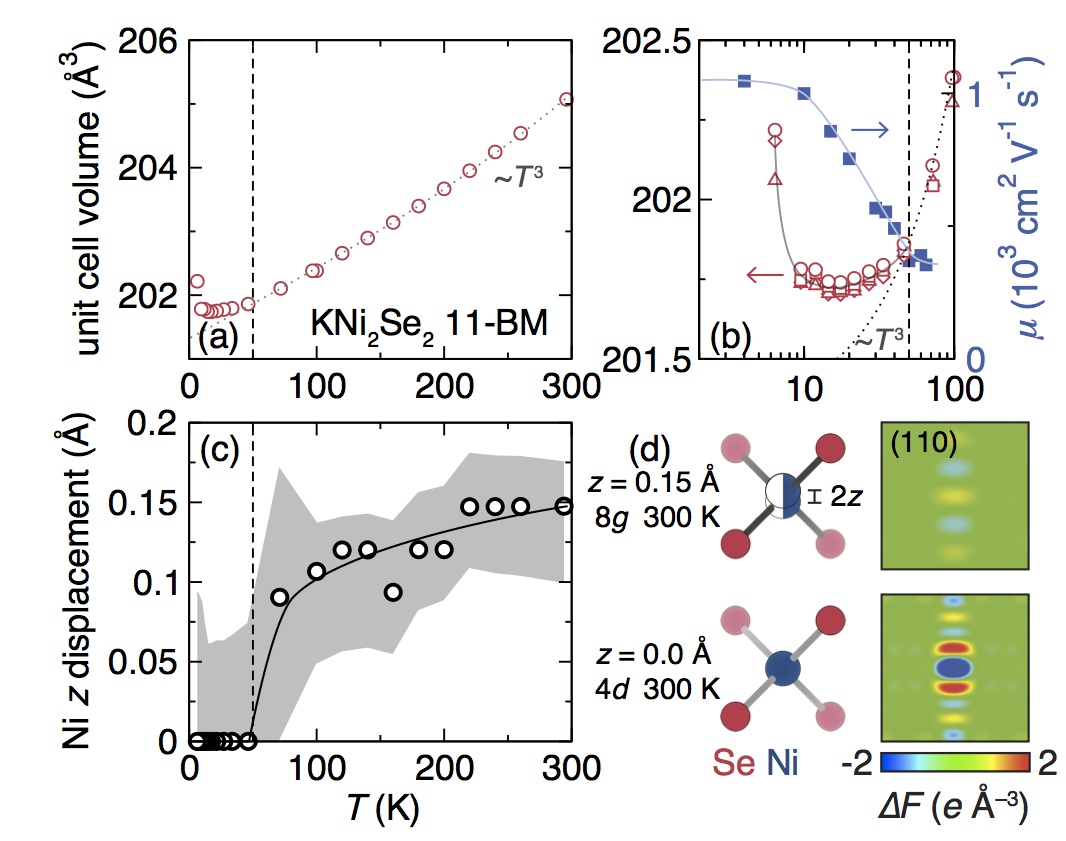
At K Rietveld analysis of the high-resolution SXRD data Wang et al. (2008); Neilson et al. (2013); Larson and Dreele (2000); Toby (2001) reveals a change in the average structure that gives the best description of the data [Fig 2(c)]. For , the nickel atom is found at the 4 Wyckoff position, (0, 0.5, 0.25). However, for K, the goodness-of-fit (g.o.f.) is improved by displacing the Ni atom from this ideal position to the Wyckoff position with a 50% fractional occupancy, as illustrated by the K Fourier difference maps in Fig. 2(d). This demonstrates an apparent decrease in the local symmetry of Ni positions on heating above K. In fact, if we describe the Ni atoms using the Wyckoff positions in a unit cell, we would expect two Ni Raman-active modes ( and ) in the () plane, in agreement with our experimental Raman spectra at K.
XAS data (beamline 20-BM-B Ravel and Newville (2005); Newville (2001)) within the measured temperature range from =300 to 8.5 K show no significant changes of the formal valence (Ni1.5+, Se2-), as neither Ni nor Se edges move in energy within the uncertainty of the XAS experiment ( eV). This confirms our previous speculation that the charge fluctuations are not due to single-ion effects, but instead result from nickel-nickel interactions. However, several different methods indicate slight changes in the unit cell and details of crystal structure as a function of temperature, showing that the local symmetry change is due to the Ni atoms.
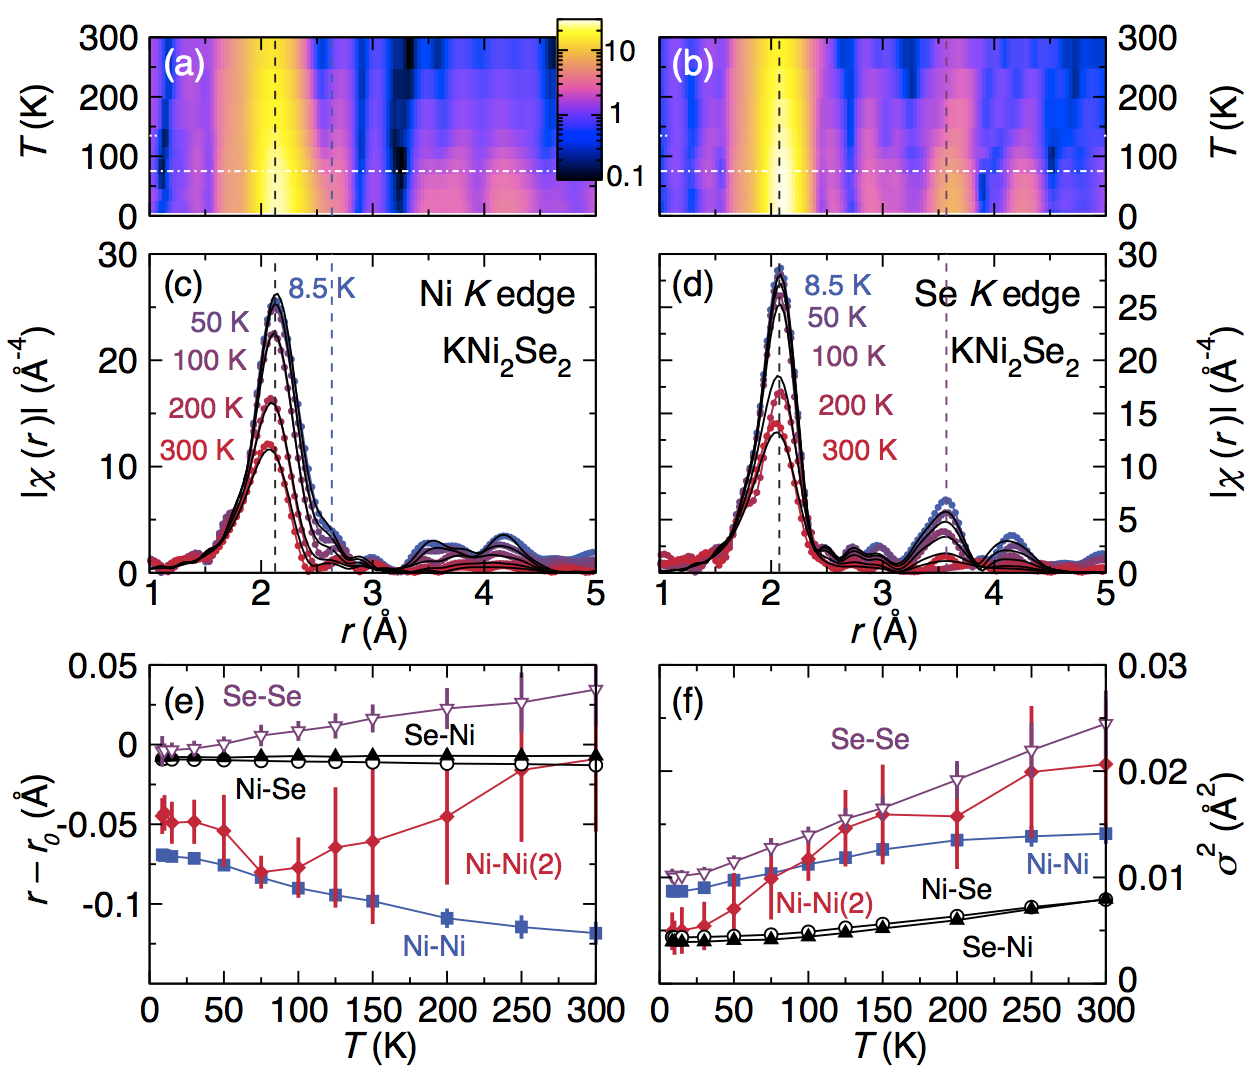
There is a significant redistribution of the Fourier-transformed EXAFS signal (in real space) for the Ni edge as a function of temperature [Fig.3(a)], indicative of a change in the Ni coordination environment. In contrast, there is no shift in the Se edge EXAFS [Fig.3(b)]. The EXAFS confirms that it is the nickel atoms that are responsible for the apparent local increase of symmetry on cooling.
The EXAFS data were quantitatively modeled using the average crystal structure to simulate the path lengths out to a cluster size of Å. The quality of fit of the model, as judged by the -factor (datafitdata]), is temperature independent from (); above that temperature the -factor increases nearly linearly to by K. This reduced fit quality is also visible in Fig.3(c) and (d) and indicates that the average crystal structure does not accurately describe the local Ni and Se environments for K. Attempts to fit a distorted model to the higher temperature EXAFS were unreliable. The fits of the ideal undistorted structure provide physically meaningful temperature dependences of the path length changes () and mean-squared displacements ().
The Ni-Se (Ni edge, Ni to Se path; 4 degenerate) and Se-Ni (Se edge, Se to Ni path; 4 degenerate) paths show very little temperature dependence [Fig.3(e)] and the exhibit the expected gradual increase on warming. The Se-Se path (Se edge, Se to Se nearest neighbor) also does not show any temperature dependent inflections. In contrast, the Ni-Ni path (the 4 degenerate nearest neighbor nickel separation) has a significant temperature dependence, showing that the distance between Ni atoms decreases on cooling from K, saturating around K, which is consistent with the Ni atom position from Rietveld analysis. The next-nearest Ni-Ni separation [Ni-Ni(2); 4 degenerate] shows a sharp inflection at K, consistent with the out-of-plane displacement of the Ni position determined by X-ray diffraction. While the significant error bars and increase in prevent an accurate assignment of the exact disposition of that path length at high temperatures, it is clear that the microscopic Ni environment changes at .
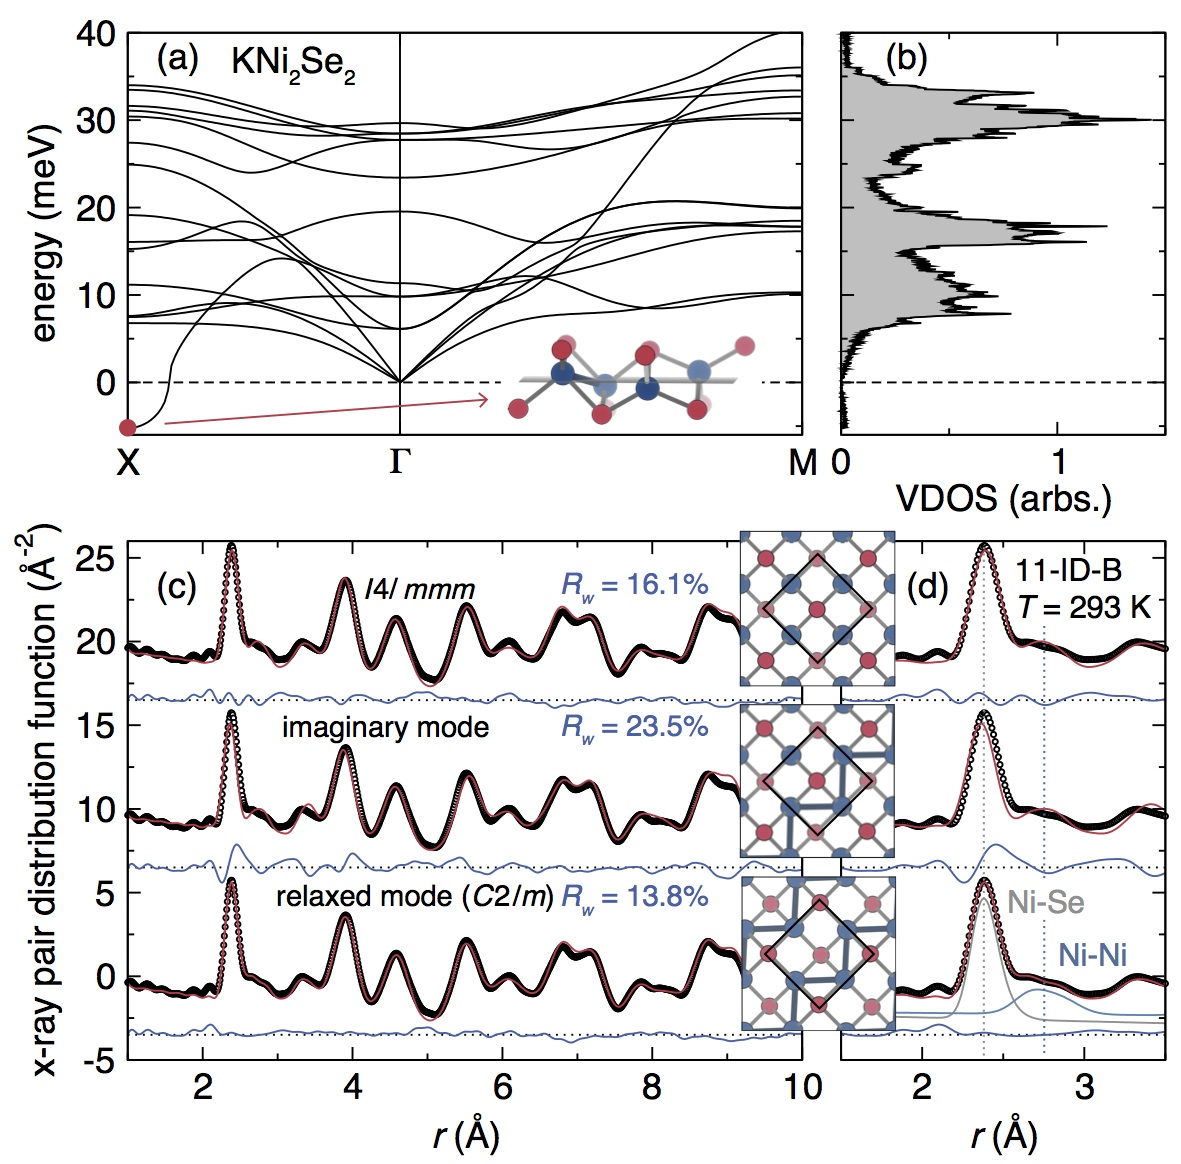
DFT calculations were carried out to gain insight to the nature of the observed structural distortions. A linear-response DFT calculation of the zone center phonons elk ; Perdew et al. (2008) for the low-temperature crystal structure of KNi2Se2 generally agrees with the results of the Raman scattering measurements 111see EPAPS for calculation details and mode energies, as well as with the mode energies and assignments reported in Ref. Lazarević et al. (2013). Calculation of the in-plane phonon dispersion reveals an imaginary frequency eigenvector at the point in the Brillouin zone [, meV, Fig. 4]. Imaginary frequency modes from DFT can be indicators of lattice instabilities, as exemplified by the localized, aperiodic distortions in Bi 2Ti2O7.Shoemaker et al. (2010) In the present case, this prediction for a distorted ground state contrasts with the experimentally observed undistorted ground state at the lowest temperatures measured (see Figures 2 and 3, and Ref. Neilson et al. (2012)). This contradiction suggests that the level of theory used for the DFT calculations lacks the ability to adequately describe the structure. However, this predicted lattice instability does resemble the distortion of KNi2Se2 observed above K. The primary polarization components of the imaginary frequency eigenvector are out-of-plane Ni displacements, as illustrated in Fig. 4(a) [, with a small component along , such that ].
To determine the validity of the distortion predicted by DFT, X-ray total scattering experiments were performed to identify the distortion (APS, 11-ID-B, 90 ke, = 30 Å-1 Chupas et al. (2003); Hammersley et al. (1996); Qiu et al. (2004); Farrow et al. (2007)) The DFT-predicted distortion (after scaling the amplitude by a least-squares fit) does not directly improve the fit to the x-ray PDF at room temperature where we see the evidence for CDW [Fig.4 (c) and (d); 222See EPAPS, Table II]. However, using isodistort Campbell et al. (2006), the imaginary-frequency zone-boundary phonon polarizations were decomposed into the subgroup symmetry, 333See EPAPS, Table II, which allowed for an excellent description to the PDF out to Å after a least-squares refinement [Fig. 4(c) and (d)]. The resulting configuration contains short and long Ni-Ni bonds, akin to the long-range ordered CDW modulations in the structurally related compounds, SrRh2As2Zinth et al. (2012) and KCu2Se2.Tiedje et al. (2003) While the bond distances from the room temperature PDF can be described by a distortion, the overall crystal symmetry determined by high-resolution SXRD remains . While the space group setting that we used with should have more modes visible in the Raman spectrum, the true atomistic configuration may possess pseudo-symmetry, such that the local point group symmetries do not provide additional modes than beyond what is observed. The Ni atoms exhibit the most significant distortions. Therefore, we expect that only the Ni point group symmetry is significantly changed with temperature, and the distortions are oriented out of the plane. These results are in agreement with the Rietveld analysis of SXRD data [Fig.2(c)]and Raman scattering.
An additional piece of evidence for the importance of electronic correlations is an increase in unit cell volume on cooling below K, yielding a negative coefficient of thermal expansion [Fig. 2(a,b)]. This result is highly reproducible on several heating and cooling cycles, akin to KNi2S2.Neilson et al. (2013) A negative coefficient of thermal expansion can be a signature of the formation of a heavy fermion state (confer CeAl3 Andres et al. (1975)). The observed temperature dependence of the unit cell coincides with changes in the carrier mobility and suggests that the structure and electronic properties are highly correlated.
In conclusion, this letter shows a direct evidence of a decrease of local symmetry in KNi2Se2 with increasing temperature. Out-of plane Ni atom displacements are a signature of CDW fluctuations driven by local Ni-Ni interactions, rather than Fermi surface nesting, that do not exhibit any long range order, and do not reduce the average symmetry of the unit cell. Raman spectroscopy directly demonstrates the lowering of local symmetry at high temperatures. Generally, a raising of symmetry on cooling is unusual, as it naively suggests an increase in configurational entropy, when considering only the degeneracy of lattice modes. Hybridization of localized orbitals with the conduction band, as previously proposed,Murray and Tešanović (2013) may provide a state in which the total entropy is decreased by such a raising of lattice symmetry and explain why our DFT calculations fail to correctly predict the ground state of this material. Such interactions between localized and delocalized electronic systems have been proposed as an origin of nematicity, coherence/incoherence crossover and heavy electrons in the iron-based superconductors,Hardy et al. (2013); Stanev and Littlewood (2013); McKenzie et al. (2001); Merino and McKenzie (2001); Yin et al. (2013); Caron et al. (2011, 2012) . The work presented here unambiguously demonstrates the presence and importance of charge-lattice coupling in ThCr2Si2-type materials.
We thank James Murray and Zlatko Tesanovic for inspiration and motivation, as well as Igor Mazin for helpful discussions and Kevin Bayer and Karena Chapman for data collection at 11-ID-B. This research and the Raman spectrometer are principally supported by the US Department of Energy (DoE), Office of Science, Office of Basic Energy Sciences (BES), Division of Materials Sciences and Engineering under Award DE-FG02-08ER46544, as well as start-up funds from the Johns Hopkins University and funding from the David and Lucile Packard Foundation. This research has benefited from the use of beamlines 11-BM-B, 11-ID-B, and 20-BM-B at the Advanced Photon Source at Argonne National Laboratory, supported by the U.S. DoE, Office of Science, Office of Basic Energy Sciences, under Contract No. DE-AC02-06CH11357.
References
- Gruner (1994) G. Gruner, Density waves in solids (Addison-Wesley Publishing Company, Advanced Book Program, 1994).
- Johannes and Mazin (2008) M. D. Johannes and I. I. Mazin, Phys. Rev. B 77, 165135 (2008).
- Eiter et al. (2013) H.-M. Eiter, M. Lavagnini, R. Hackl, E. A. Nowadnick, A. F. Kemper, T. P. Devereaux, J.-H. Chu, J. G. Analytis, I. R. Fisher, and L. Degiorgi, Proc. Natl. Acad. Sci. USA 110, 64 (2013).
- Mitchell et al. (2001) J. Mitchell, D. Argyriou, A. Berger, K. Gray, R. Osborn, and U. Welp, J. Phys. Chem. B 105, 10731 (2001).
- Bozin et al. (2007) E. Bozin, M. Schmidt, A. DeConinck, G. Paglia, J. Mitchell, T. Chatterji, P. Radaelli, T. Proffen, and S. J. L. Billinge, Phys. Rev. Lett 98, 137203 (2007).
- Merino and McKenzie (2001) J. Merino and R. H. McKenzie, Phys. Rev. Lett. 87, 237002 (2001).
- Murray and Tešanović (2013) J. M. Murray and Z. Tešanović, Phys. Rev. B 87, 081103 (2013).
- Merino et al. (2006) J. Merino, A. Greco, N. Drichko, and M. Dressel, Phys. Rev. Lett. 96, 216402 (2006).
- Neilson et al. (2013) J. R. Neilson, T. M. McQueen, A. Llobet, J. Wen, and M. R. Suchomel, Phys. Rev. B 87, 045124 (2013).
- Neilson et al. (2012) J. R. Neilson, A. Llobet, A. V. Stier, L. Wu, J. Wen, J. Tao, Y. Zhu, Z. B. Tesanovic, N. P. Armitage, and T. M. McQueen, Phys. Rev. B 86, 054512 (2012).
- Neilson and McQueen (2012) J. R. Neilson and T. M. McQueen, J. Am. Chem. Soc 134, 7750 (2012).
- Lazarević et al. (2013) N. Lazarević, M. Radonjić, M. Šćepanović, H. Lei, D. Tanasković, C. Petrovic, and Z. V. Popović, Phys. Rev. B 87, 144305 (2013).
- Lei et al. (2012) H. Lei, K. Wang, H. Ryu, D. Graf, J. B. Warren, and C. Petrovic, arXiv , 1211.1371 (2012).
- Wang et al. (2013a) H. Wang, C. Dong, Q. Mao, R. Khan, X. Zhou, Z. Li, B. Chen, J. Yang, Q. Su, and M. Fang, arXiv (2013a).
- Wang et al. (2013b) H. Wang, C. Dong, Q. Mao, R. Khan, X. Zhou, C. Li, B. Chen, J. Yang, and M. Fang, arXiv , 1305.1033 (2013b).
- Hardy et al. (2013) F. Hardy, A. E. Boehmer, D. Aoki, P. Burger, T. Wolf, P. Schweiss, R. Heid, P. Adelmann, Y. X. Yao, G. Kotliar, J. Schmalian, and C. Meingast, arXiv , 1302.1696 (2013).
- Stanev and Littlewood (2013) V. Stanev and P. B. Littlewood, Phys. Rev. B 87, 161122 (2013).
- Bannikov and Ivanovskii (2013a) V. Bannikov and A. Ivanovskii, Physica B: Cond. Matt. 418, 76 (2013a).
- Lu et al. (2012) F. Lu, J. Z. Zhao, and W.-H. Wang, J. Phys.: Condens. Matter 24, 495501 (2012).
- Bannikov and Ivanovskii (2013b) V. Bannikov and A. Ivanovskii, Physica C: Superconductivity (2013b).
- Orobengoa et al. (2009) D. Orobengoa, C. Capillas, M. I. Aroyo, and J. M. Perez-Mato, J. Appl. Crystallogr. 42, 820 (2009).
- Wang et al. (2008) J. Wang, B. H. Toby, P. L. Lee, L. Ribaud, S. M. Antao, C. Kurtz, M. Ramanathan, R. B. V. Dreele, and M. A. Beno, Rev. Sci. Instrum. 79, 085105 (2008).
- Larson and Dreele (2000) A. C. Larson and R. B. V. Dreele, Los Alamos National Laboratory Report LAUR (2000).
- Toby (2001) B. H. Toby, J. Appl. Crystallogr. 34, 210 (2001).
- Ravel and Newville (2005) B. Ravel and M. Newville, J. Synch. Rad. 12, 537 (2005).
- Newville (2001) M. Newville, Journal of Synchrotron Radiation 8, 322 (2001).
- (27) “elk, http://elk.sourceforge.net/,” .
- Perdew et al. (2008) J. P. Perdew, A. Ruzsinszky, G. I. Csonka, O. A. Vydrov, G. E. Scuseria, L. A. Constantin, X. Zhou, and K. Burke, Phys. Rev. Lett. 100, 136406 (2008).
- Note (1) See EPAPS for calculation details and mode energies.
- Shoemaker et al. (2010) D. P. Shoemaker, R. Seshadri, A. L. Hector, A. Llobet, T. Proffen, and C. J. Fennie, Phys. Rev. B 81, 144113 (2010).
- Chupas et al. (2003) P. J. Chupas, X. Qiu, J. Hanson, P. Lee, C. Grey, and S. J. L. Billinge, J. Appl. Crystallogr. 36, 1342 (2003).
- Hammersley et al. (1996) A. Hammersley, S. Svensson, M. Hanfland, A. Fitch, and D. Hausermann, High Pressure Research 14, 235 (1996).
- Qiu et al. (2004) X. Qiu, J. W. Thompson, and S. J. L. Billinge, J. Appl. Crystallogr. 37, 678 (2004).
- Farrow et al. (2007) C. L. Farrow, P. Juhas, J. W. Liu, D. Bryndin, E. S. Bozin, J. Bloch, T. Proffen, and S. J. L. Billinge, J. Phys.: Condens. Matter 19, 335219 (2007).
- Note (2) See EPAPS, Table II.
- Campbell et al. (2006) B. J. Campbell, H. T. Stokes, D. E. Tanner, and D. M. Hatch, J. Appl. Crystallogr. 39, 607 (2006).
- Note (3) See EPAPS, Table II.
- Zinth et al. (2012) V. Zinth, V. Petricek, M. Dusek, and D. Johrendt, Phys. Rev. B 85, 014109 (2012).
- Tiedje et al. (2003) O. Tiedje, E. E. Krasovskii, W. Schattke, P. Stoll, C. Näther, and W. Bensch, Phys. Rev. B 67, 134105 (2003).
- Andres et al. (1975) K. Andres, J. E. Graebner, and H. R. Ott, Phys. Rev. Lett. 35, 1779 (1975).
- McKenzie et al. (2001) R. H. McKenzie, J. Merino, J. B. Marston, and O. P. Sushkov, Phys. Rev. B 64, 085109 (2001).
- Yin et al. (2013) Z. Yin, A. Kutepov, and G. Kotliar, Phys. Rev. X 3, 021011 (2013).
- Caron et al. (2011) J. M. Caron, J. R. Neilson, D. C. Miller, A. Llobet, and T. M. McQueen, Phys. Rev. B 84, 180409(R) (2011).
- Caron et al. (2012) J. M. Caron, J. R. Neilson, D. C. Miller, K. Arpino, A. Llobet, and T. M. McQueen, Phys. Rev. B 85, 180405(R) (2012).