Suites of dwarfs around nearby giant galaxies
Abstract
Updated Nearby Galaxy Catalog (=UNGC) contains the most comprehensive summary of distances, radial velocities and luminosities for eight hundred galaxies located within 11 Mpc from us. The highest density of observables in UNGC makes this sample indispensable for checking results of N-body simulations of cosmic structures on a Mpc scale.
Environment of each galaxy in UNGC was characterized by a tidal index depending on the separation and mass of the galaxy’s Main Disturber (=MD). We ascribed the UNGC galaxies with a common MD to its suite, and ranked suite members according to their . All suite members with positive are assumed to be physical companions of the MD. About 58% of the sample are members of physical groups.
The distribution of suites by the number of members, n, follows to a relation . The twenty most populated suites contain 468 galaxies, i.e. 59% of the UNGC sample. The fraction of MDs among the brightest galaxies is almost 100% and drops to 50% at .
We discuss various properties of MDs, as well as galaxies belonging to their suites. The suite abundance practically does not depend on morphological type, linear diameter or hydrogen mass of MD, revealing the tightest correlation with the MD dynamical mass. Dwarf galaxies around MDs exhibit well-known segregation effects: the population of outskirts has later morphological types, richer HI-contents and higher rates of star formation activity. Nevertheless, there are some intriguing cases when dwarf spheroidal galaxies occur at the far periphery of the suites, as well as some late-type dwarfs residing close to MDs.
Comparing simulation results with galaxy groups, most studies assume the Local Group is fairly typical. However, we recognize that the nearby groups significantly differ from each other and there is a considerable variation in their properties. The suites of companions around the Milky Way and M 31, consisting the Local Group, do not look as a quite typical nearby group.
The multiplicity of nearby groups on number of their physical members can be described by the Hirsh-like index , indicating that the Local Volume contains 9 groups with populations exceeding 9 companions to their MDs.
1 Introduction
The standard LCDM cosmological model with cold dark matter and dark energy efficiently explains the observed properties of the universe on large scales (Klypin et al. 2003). The modern cosmological N-body simulations have resolutions good enough to investigate structures with size about or better than 1 Mpc and with individual halos about solar masses (Klypin et al. 2011, Kitaura et al. 2012). However, our advances in the matching the simulation results with the observational data on such small scales still look very modest. One reason for this is a limited database on the distances even to the nearest galaxies.
Over the last 10–15 years, mass measurements of distances to the nearby galaxies have been undertaken by several observational teams, relying on the unique resolution of the Hubble Space Telescope (HST). Use of a Tip of the Red Giant Branch (TRGB) stars as a “standard candle” (Lee et al. 1993) allows to determine the distances for more than 300 of the most nearby galaxies with an error of %. The first summary of the new and old distance estimates was presented in the catalog of galaxies of the Local Volume (Karachentsev et al. 2004), which contains data on 450 galaxies in a sphere of 10 Mpc radius around the Milky Way. Later on, the distance estimates and other integral parameters of nearby galaxies have been accumulated in the Extragalactic Distance Database (http://edd.ifa.hawaii.edu) by Tully et al. (2008) and Database on the Local Volume Galaxies (http://www.sao.ru/lv/lvgdb) by Kaisina et al. (2012). The Updated Nearby Galaxy Catalog (Karachentsev et al. 2013 = UNGC) contains the most complete summary of various observable characteristics for galaxies located within 11 Mpc. The UNGC catalog is currently the most representative and homogeneous sample of neighboring galaxies, most of which have known linear separations, luminosities and line-of-sight velocities. Unlike most catalogs which are limited by flux, this sample is restricted by distance. It makes UNGC the most suitable for comparison with N-body simulations on the small scales (0.1–10) Mpc.
2 Environment of nearby giant galaxies
For each of the 869 galaxies in the UNGC catalog (Karachentsev et al. 2013) we determined its “tidal index” (Karachentsev and Makarov, 1999)
where is the -band luminosity of the neighboring galaxy, and is its spatial separation from the considered galaxy. Ranking the surrounding galaxies by the value of their tidal force , we are looking for the most significant, influential neighbor, which is designated as the Main Disturber (MD). We assume that the total mass of the galaxy is proportional to its luminosity in -band, and that the mass-to-light ratio does not depend on the luminosity and morphology. The constant in (1) has been chosen so that the galaxy with locates on the “zero velocity sphere” relative to its MD. In other words, the galaxy with is considered to be causally connected with its MD, since the crossing time for this pair is shorter than the age of the universe , where km s-1 Mpc-1 is the Hubble parameter. Accordingly, a galaxy with a negative should be considered as physically not bound with its neighbors. Such objects are usually referred to as the “field” galaxies. Evidently, this approach is only justified for the close volume where all the fairly massive galaxies are already discovered and their distances have been measured.
In the Tables 1 and 2 of the UNGC catalog (Karachentsev et al. 2013) we have presented the observing and physical characteristics of 869 of the Local Volume galaxies, taking into account corrections for external and internal extinction. We have excluded from this sample 75 galaxies with distance estimates of Mpc and united all the remaining objects in associations with their common Main Disturber. We call the set of galaxies with one common Main Disturber as the MD “suite”. Within each suite, its members were ranked by highest tidal index . A sub-sample of members of the suite with we determine as a physical group, where the MD is the dominant galaxy by mass. In almost all the cases, the groups of galaxies formed this way matched with the list of nearby groups by Karachentsev (2005).
The suites around the MDs themselves were ranked according to the number of suite members from the maximum of for the suite around M81 to . The sample of galaxies of the Local Volume reorganized this way is presented in Table 1, the full version of which is available at the LVG page on the website of the Special Astrophysical Observatory of the Russian Academy of the Sciences (http://www.sao.ru/lv/lvgdb).
The table columns contain the following data:
(1) the name of the galaxy;
(2) linear diameter of the galaxy in kpc, determined at Holmberg’s isophote (26.5 mag/square arcsec);
(3) absolute magnitude of the galaxy in the B-band corrected for extinction;
(4) logarithm of the stellar mass in solar units;
(5) logarithm of the indicative (dynamic) mass within the Holmberg diameter, where the rotation velocity is expressed in km s-1, the Holmberg diameter — in angular minutes, and the distance — in Mpc;
(6) logarithm of the hydrogen mass in solar units;
(7) tidal index ;
(8) Main Disturber’s name;
(9) distance to the galaxy in Mpc;
(10) line-of-sight velocity of the galaxy (in km s-1) relative to the velocity of MD;
(11) number of members in the suite of MD, to which the galaxy belongs.
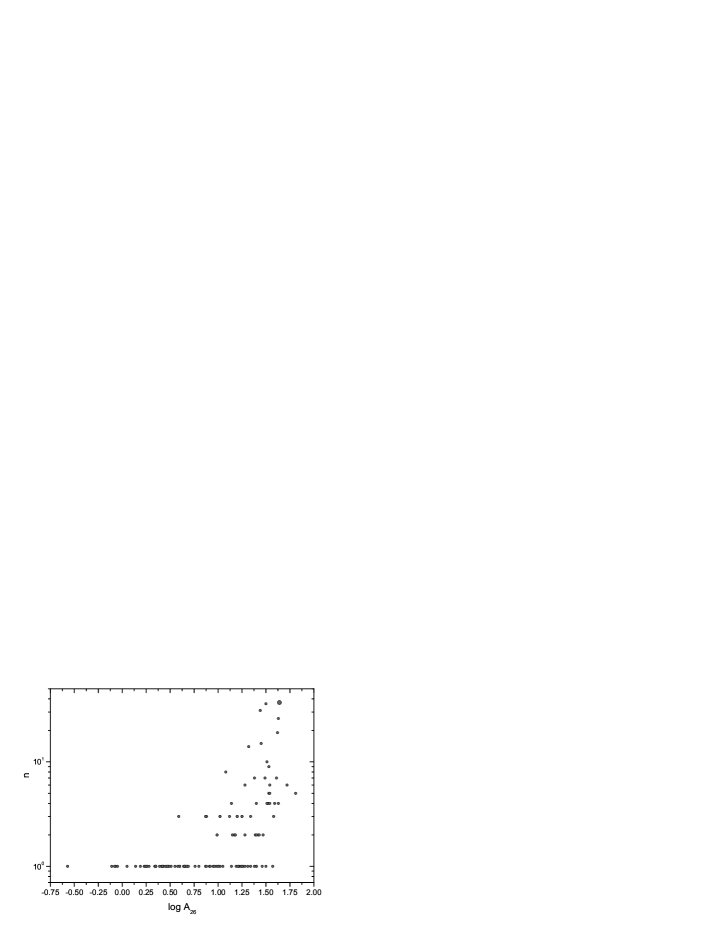
The distribution of the number of suites around the MDs by the number of their members is demonstrated in Fig. 1 in the logarithmic scale. Open circles in the figure correspond to the total number of galaxies in the suite with any tidal indices. The filled circles show the number of bound companions, satisfying . Standard errors are depicted by vertical bars. In general, the distribution of suites by the number of galaxies in them is represented quite well by the power law , which is described in the figure by the straight line.
Among the 794 galaxies of the Local Volume 457 galaxies or 58% have values. In other words, they are the members of physical groups of different multiplicity. It should be noted that according to Makarov & Karachentsev (2011), for galaxies of the Local Universe located within the sphere of Mpc radius, the relative number of galaxies in groups is 52%. Thus the abundance of galaxy group members in small and large volumes is almost the same. The agreement of these quantities can be considered as some evidence of representativeness of the Local Volume in terms of structure and dynamics of galaxy systems.
The data in Table 1 show that most of the galaxies in the Local Volume are concentrated in suites around a small number of the most massive galaxies. Thus, only 20 most populated suites contain 468 galaxies, i.e. 59% of the total population of the Local Volume.111We have not included in this list a suite of 12 galaxies around NGC 4414, which lies outside the LV at a distance of 18 Mpc, neither the suite of 10 galaxies around NGC 1291, the distance to which is very uncertain. Some parameters of these 20 structures and properties of their main galaxies are presented in Table 2 with columns containing: (1) the abbreviated name of the main galaxy (MD); (2) the distance to the MD in Mpc, by which the list of suites is ordered; (3) the total number of galaxies in the MD suite, including the field objects; (4) the number of physical group members with ; (5) the number of “bright” bound companions of the main galaxy with absolute magnitudes brighter than ; (6) the absolute magnitude of the main galaxy; (7, 8) its stellar as well as dynamical masses within the Holmberg diameter in solar masses; (9) linear Holmberg diameter of MD in kpc; (10,11) hydrogen mass and morphological type of the main galaxy by de Vaucouleurs classification; (12 - 14) tidal indices, characterizing the MD environment: — tidal index determined by the most significant neighbor; — tidal index determined by the total contribution of the five most significant neighbors, ; and — logarithm of the mean density of stellar mass around the galaxy (excluding the galaxy itself) within a 1 Mpc radius, expressed in units of the global mean density Mpc-3 (Jones et al. 2006).
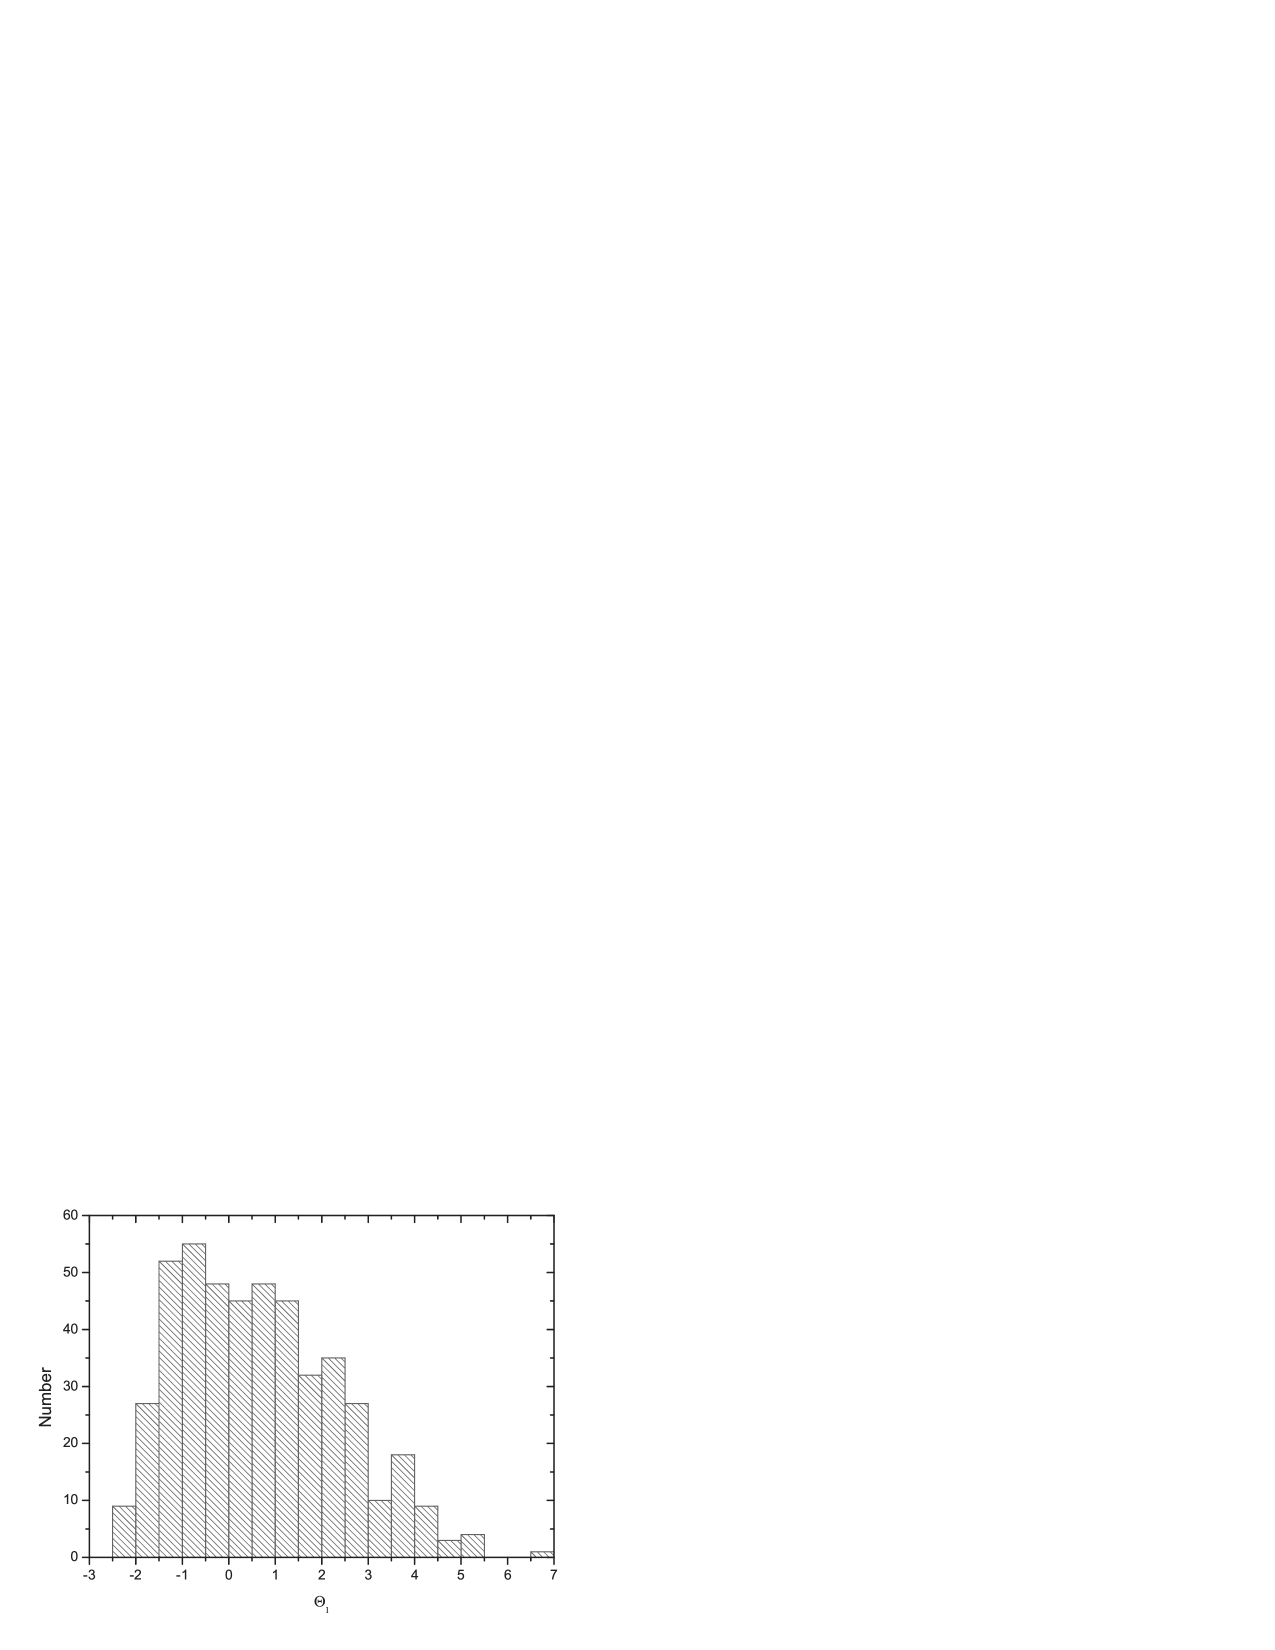
The distribution of members of the 20 most populated suites by the tidal index is shown in Fig. 2. As follows from it, about 60% of members of these suites have , i.e., are physically bound with the main galaxy. It should be noted, however, that not all the galaxies of the Local Volume have their distances measured with high accuracy. Therefore, the boundary strip may contain galaxies of different status: both the group members and field galaxies.
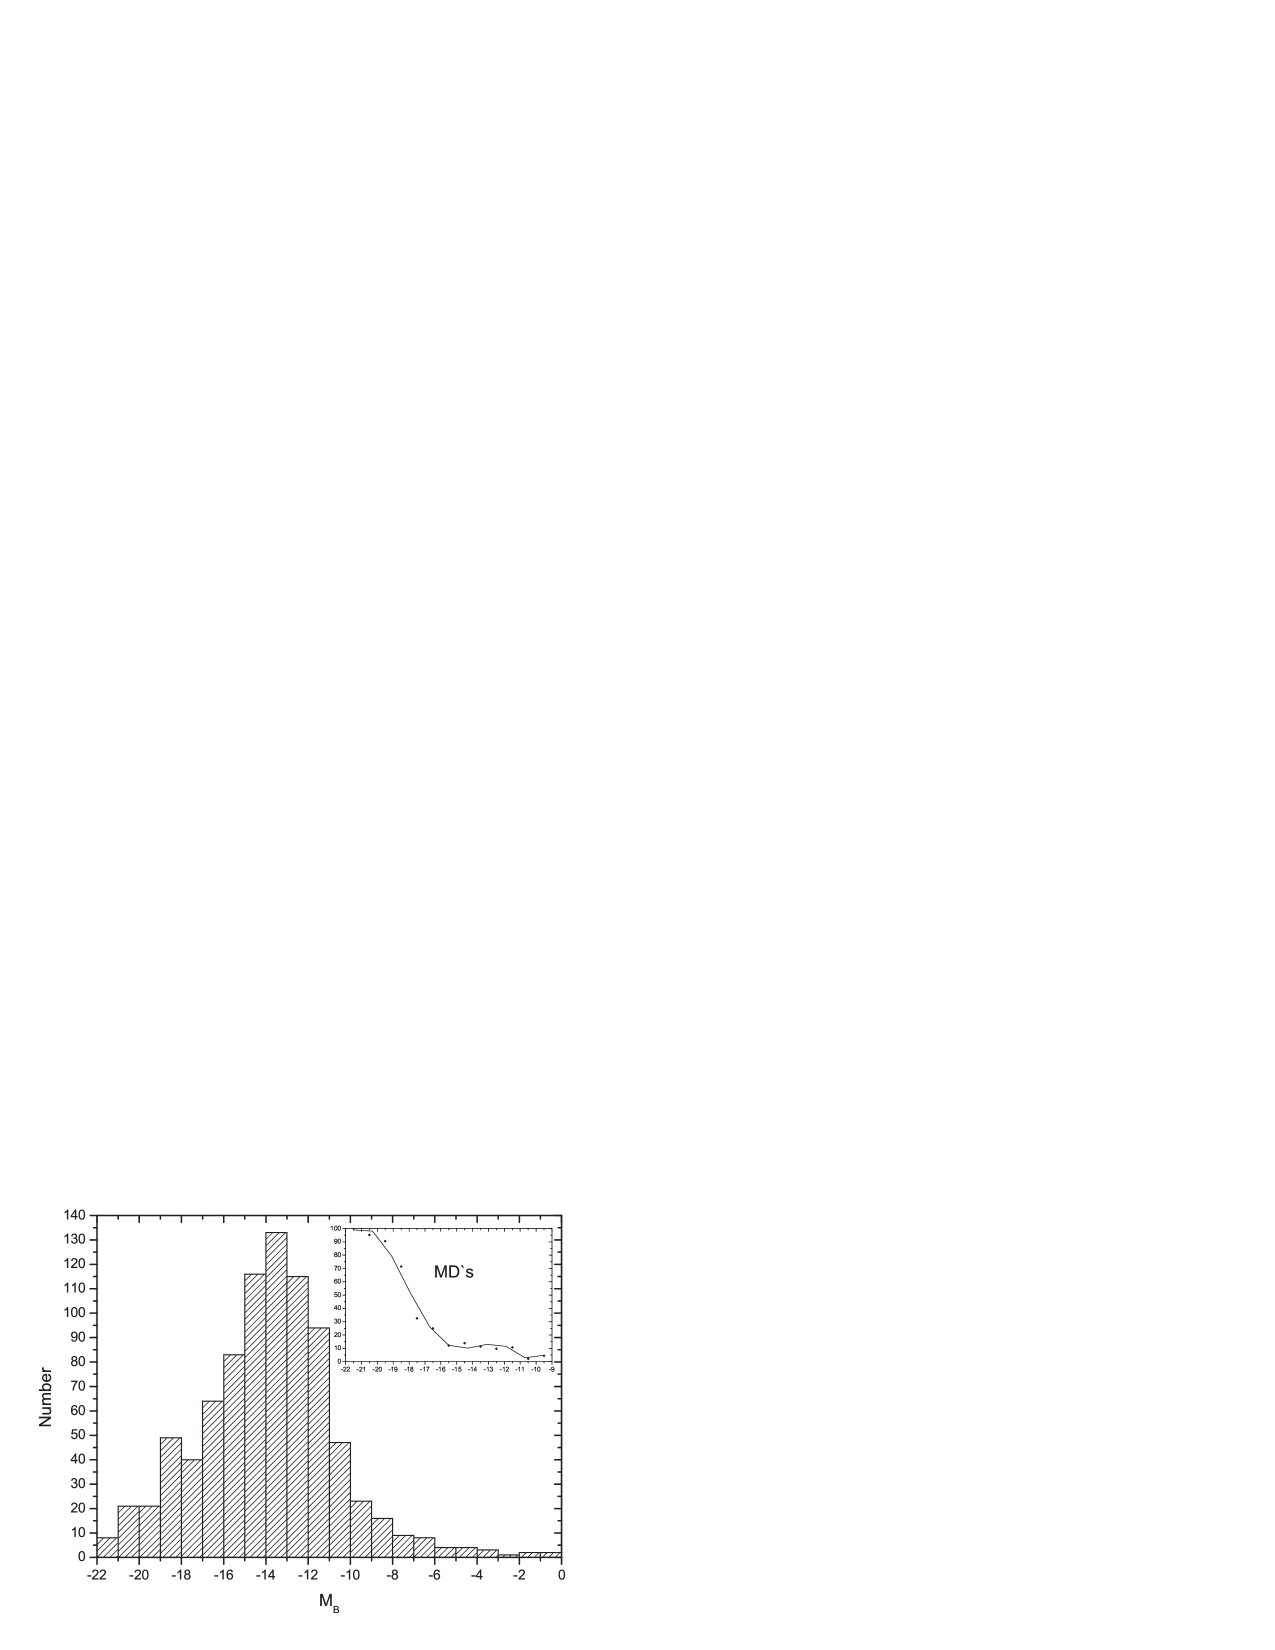
We noted above that more than a half of the total population of the Local Volume is located in the field of gravitational influence of only 20 giant galaxies. Figure 3 represents the distribution of galaxies of the Local Volume by the absolute -band magnitude. The inset picture shows what fraction of the Main Disturbers as function of the absolute magnitude.
The relative number of MDs among the brightest galaxies is close to 100%. As might be expected, the fraction of MDs decreases towards the low-luminosity galaxies, dropping below 50% at . A similar pattern was noted by Wang & White (2012) according to the data on SDSS survey. MDs are also presented on the faint end of the luminosity function. They can be conditionally divided into two categories: a) dwarf companions located close to a giant galaxy (an example is a dwarf spheroidal system SagdSph, tumbledown by the tidal influence of the Milky Way), b) tight pairs of dwarf galaxies, for example, UGCA 319+DDO 161, KK 78+DDO 64, KK 65+DDO 47, where each component of the pair is a MD for the second component. The list of similar isolated multiple dwarf galaxies in the volume of Mpc radius was compiled by Makarov & Uklein (2012).
It should be stressed that the considered sample of nearby galaxies suffers with different selection effects. Clearly, these are very complex and variable due to the heterogeneous nature of many of the surveys that contribute to the UNGC catalog. For instance, there are a luminosity bias with distance, a HI-bias over the sky because of the declination horizon and limited angular resolution for radio telescopes, etc. In particular, blind HI-surveys, like HIPASS and ALFALFA, are efficient to reveal gas-rich irregular dwarfs in the Zone of Avoidance, which are practically invisible in optical surveys, but the radio surveys are nearly insensitive to detect dwarf spheroidal objects.
3 Some properties of the Main Disturbers
Returning to the Table 2 data, let us note some features of the main galaxies in the suites, which foster the presence of a large number of companions around MDs. Four panels of Fig. 4 show the dependence of the number of physical members of the suite (i.e. members of group), , on the stellar and dynamical mass of the MD, as well as its linear diameter and hydrogen mass. As one can see, the most obvious relationship occurs for the dynamic mass of the main galaxy , which was earlier noticed by Karachentsev & Kasparova (2005). It should be noted, however, that due to the selectivity by luminosity, the suites of nearby MDs look more populated than the suites of their distant counterparts. To reduce the selectivity effect with distance, we have excluded from our analysis the dwarf galaxies with absolute magnitudes . The reduced number of bright physical companions is indicated in Table 2 as .
Considering each parameter in Table 2 as a feature that may affect the number of members of the suite, we calculated the correlation coefficients of these parameters with the total number of galaxies in the suite , the number of physical members and the number of bright physical companions . The results are shown in Table 3.
If we assume the correlation coefficients larger than 0.25 by modulus to be significant, then the data in Table 3 leads to the following conclusions. a) Linear diameter of the main galaxy, its hydrogen mass and morphological type have practically no effect on the population of a suite. b) The total number of members of the suite and the number of bound companions show a positive correlation with the luminosity of the main galaxy, its dynamical mass , and all three tidal indices ; however, the presence of a significant correlation between and with distance indicates the effect of observational selection as the cause of listed correlations. c) For bright physical group members, , the correlation with distance virtually disappears. The number of is significantly influenced by the value of stellar dynamic mass of the MD, and by the contrast of stellar density of the environment, . But the last circumstance is almost trivial, since it is the abundance of MD’s companions that determines the density contrast . The above trends may shed some light on the conditions of formation and evolution of massive galactic halos surrounded by small sub-haloes.
4 Properties of galaxies in MD suites
We know that the groups and clusters of galaxies reveal segregation effects along the radius by the luminosity, morphological type and other characteristics. The tidal index is an indicator of distance of the suite member from its main galaxy, normalized to the MD mass. This allows to rank the members of different suites by , to form a synthetic unified suite.
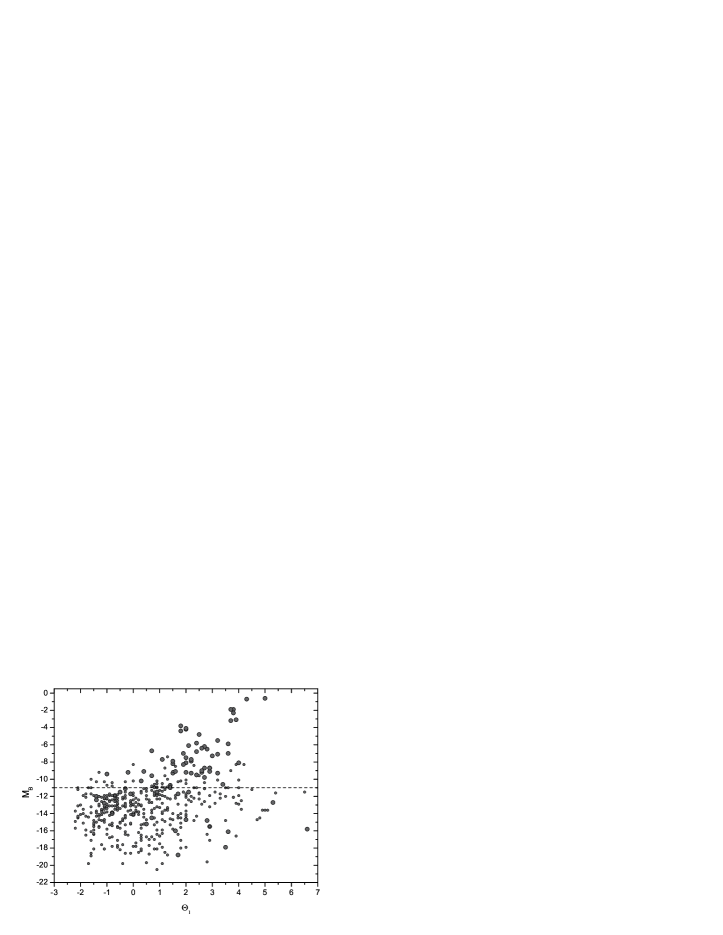
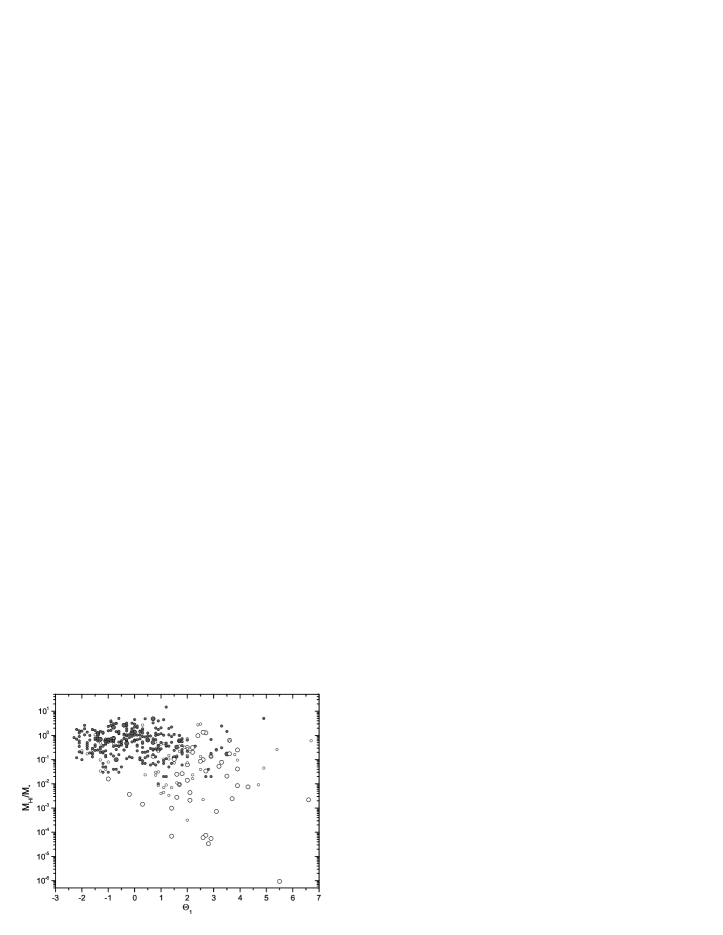
Figure 5 presents the distribution on several parameters of galaxies in the 20 most populated suites (Table 2) along the scale. On its left top panel, absolute magnitude of galaxies of the synthetic suite is clearly correlated with . However, exclusion of galaxies fainter than (above the dashed horizontal line), mainly found in the vicinity of the Milky Way, Andromeda and M81, makes this correlation insignificant. The top right panel of the figure shows the hydrogen-to-stellar mass ratio as a function of . The open circles mark the objects where only the upper limit of the HI flux is estimated. Despite a large dispersion of ratios, its mean value systematically decreases from the field galaxies towards members of groups. This known effect is usually explained by sweeping-out the gas of dwarf galaxies in groups as they pass through the dense halo regions of a massive galaxy (Slater & Bell 2013). Note, however, that among the field galaxies with there are objects with low hydrogen abundances per stellar mass unit. To explain these cases, we need to employ some other mechanisms of gas loss by dwarf galaxies, for example, the “cosmic web stripping” (Benotez-Llambay et al. 2013).
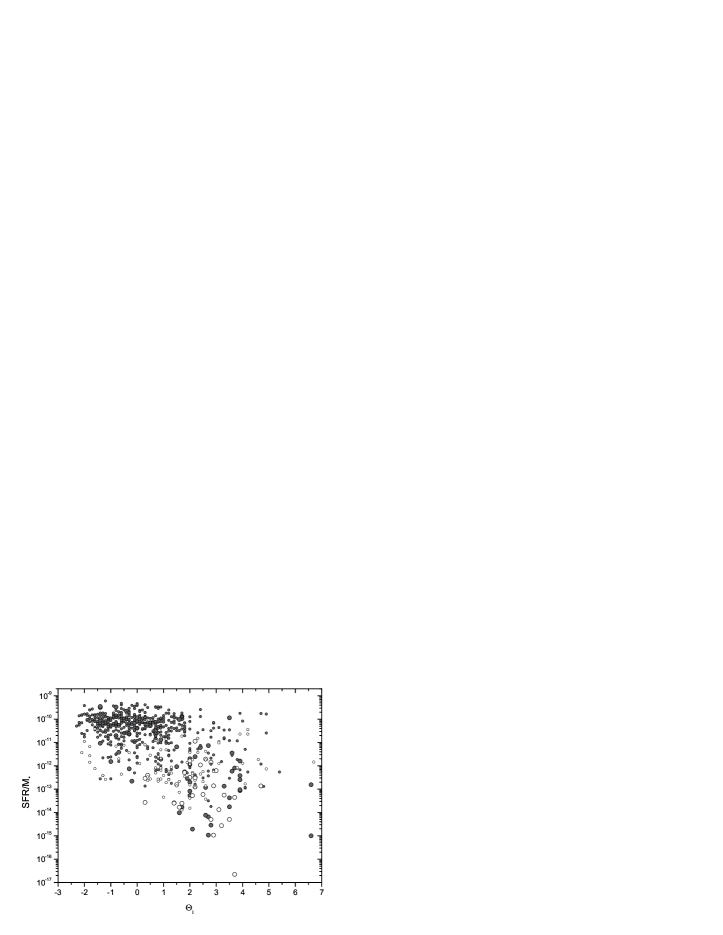
The lower left panel reproduces the specific star formation rate (SFR) in the galaxies of synthetic suite as a function of . The was estimated by the flux and ultraviolet flux measured with GALEX. Empty symbols correspond to the upper limit of the and fluxes. The smallest scatter in occurs in the galaxies belonging to outskirts of the suites. With the growth of there are many cases of depressed star formation. Just like for the hydrogen-to-stellar mass ratio, , the decrease of a specific star formation rate, , in densest regions is apparently caused by the effect of sweeping gas out from the shallow potential well of the dwarf galaxies.
The bottom right panel of Fig. 5 shows the distribution of galaxies of the synthetic suite by morphological types in de Vaucouleurs classification at different . Again, the gas-rich late-type dwarf galaxies, T = 10, 9 (=Ir, Im, BCD), prevail in the low-density regions with , while the early-type objects, T (=E, S0, dSph), are found mainly in the dense central parts of the suites. Note that in this panel there are three objects marked with the type T = 11. We have classified in this category the intergalactic HI-clouds without any signs of stellar population. The fact that two of them have the values is likely determined by the selectivity effect: in the regions of nearby groups, the HI-surveys are as a rule performed to a deeper extent than in the vast areas between the groups.
Despite the presence of a quite evident morphological segregation of galaxies along the radius of the groups, the lower left corner of the {} diagram hosts a number of galaxies with the characteristics: T. These galaxies can be critical when testing different scenarios of formation of early-type galaxies. Twelve of them are shown in Table 4 in order of increasing . The first column shows the name of the galaxy, the second indicates its morphological type with detailed classification of dwarf galaxies (Karachentsev et al. 2013). The designations of parameters in the subsequent columns are the same as in Table 2. The penultimate column shows the difference between the line-of-sight velocities of the suite galaxy and its MD. Some objects from the list (KKR 8, KKH 65, KK 258, KK 227) coincide with the list of isolated early-type galaxies in the Local Supercluster (Karachentseva et al. 2010).
As we can see from Table 4, this list contains only the dwarf systems with linear diameters of less than 4 kpc and absolute magnitudes not brighter than . We have classified a half of them as transition objects (Tr) between dIr and dSph. Three dwarf galaxies of S0 and E types: NGC 4600, NGC 404 and NGC 59 reveal a gas content according to the optical emission spectra and HI fluxes. In fact, only 4 out of 12 galaxies: KKR 8, KKH 65, KKR 25 and UGC 8882 remain well founded representatives of isolated early-type galaxies. Moreover, only one of them, KKR 25 was studied in detail in the optical and radio ranges (Makarov et al. 2012) and has a reliable distance estimate by the TRGB method (Karachentsev et al. 2001).
From the aspect of evolution of dwarf galaxies, of great interest here are not only the isolated early-type galaxies, but also the gas-rich dwarfs of Ir, Im, BCD types which are located closely to the massive galaxies. They occupy the opposite diagonal corner on the {} diagram with respect to the isolated early-type objects. Table 5 lists the data on 18 irregular dwarf galaxies, T = 9,10 types, with the tidal indices around the giant galaxies with absolute magnitudes . The galaxies here are ranked according to their . The parameter designations in the columns are the same as in Table 4.
As one can see, the majority of dwarf galaxies of this list are detected in the HI line. This may assume that other yet undetected dwarf systems have significant amounts of neutral hydrogen, but they are too close to the massive galaxies and are not resolved as individual HI-sources.
The average absolute magnitude of the dwarfs in Tables 4 and 5 is almost identical: and , respectively. This agreement is to be expected if the late-type dwarf galaxies are experiencing their first passage near the massive galaxy, and after that, being deprived of their gas, move to the category of spheroidal dwarfs.
Attention is drawn to an inhomogeneous distribution of the number of irregular dwarfs, which are tightly located around the MDs. This way, four dwarf galaxies are close to the M81 and all of them are young stellar systems formed in the tidal HI-filaments connecting M81 with M82 and NGC 3077 (Yun 1999, Makarova et al. 2002, Karachentsev et al. 2011). Two giant spiral galaxies: NGC 6744 and NGC 6946 have 4 and 3 irregular dwarfs in their close vicinities, respectively. The Milky Way and 6 other MDs have only one such companion each. (We have not included the SMC galaxy in Table 5 because its MD is not the Milky Way, but the LMC galaxy.) At the same time, such massive galaxies as M31, Centaurus A and Sombrero (NGC 4594) have no nearby gas-rich dwarf companions at all.
It should be noted, however, that among the dwarf galaxies from Table 5, only one galaxy — LMC has its distance measured with high accuracy. In the other objects of this list the distance error is about 25%.
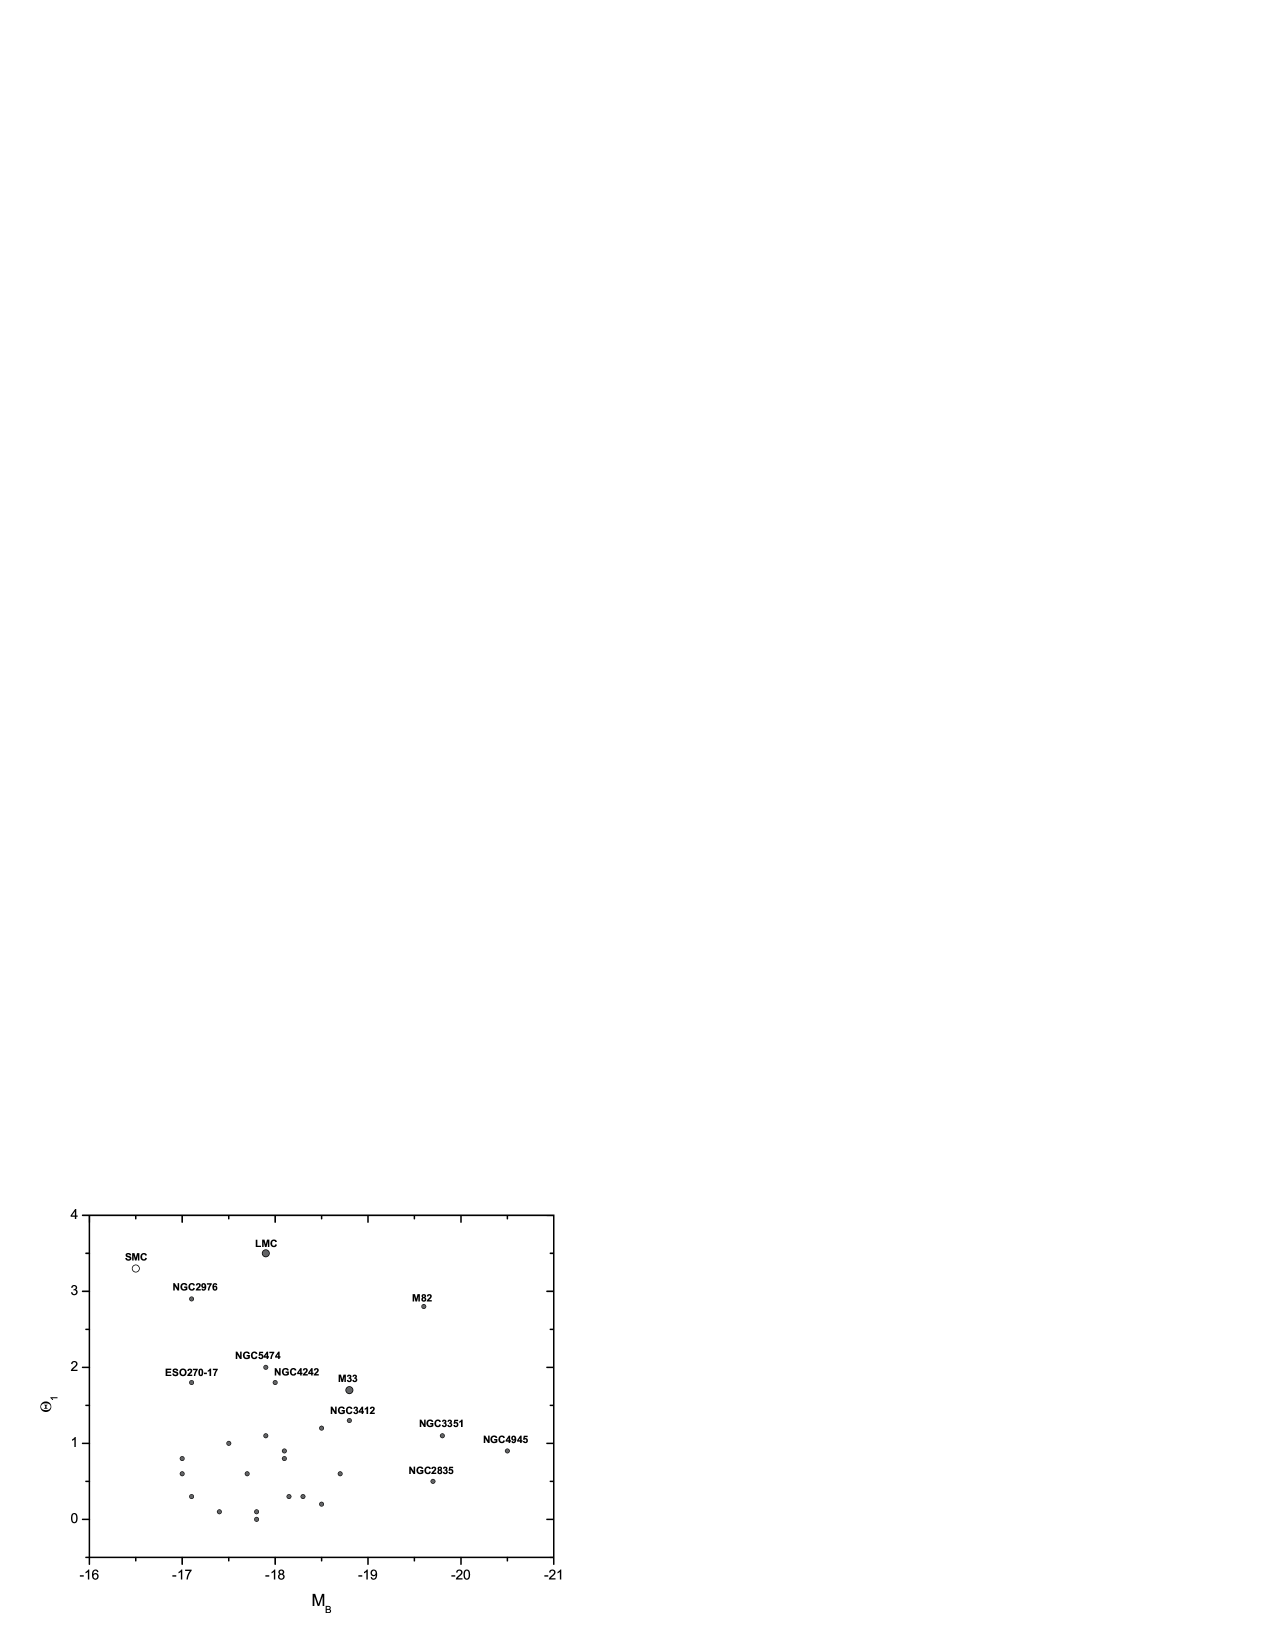
As can be seen from the Table 5, the Milky Way stands out among the other MDs by the presence of a nearby massive companion, LMC. This peculiarity of the Milky Way was noted by Rodriguez-Puebla et al. (2013), Jiang et al. (2012) and other authors. This fact remains valid if we not only consider the T = 9, 10 dwarf companions, but also all other types of companions. Around the 20 most significant MDs of the Local Volume (Table 2) there are 27 physical companions with and absolute magnitudes brighter than . The distribution of these galaxies by {} is shown in Fig. 6. We have also placed there the SMC galaxy, which lies in the potential well of the Milky Way, although its MD is the LMC (see Table 1). As one can see, some giant galaxies have physical companions of high luminosity, such as M33 in M31, NGC 3351 in NGC 3368 and NGC 2835 in NGC 2784. However, they are not located as close to their MDs, as the LMC to our Galaxy. Note that among the 27 massive nearby companions in Fig. 6, all but NGC 3412 are late-type galaxies with large amounts of neutral gas and active star formation. This circumstance may indicate that many gas-rich companions are still in the initial stage of falling towards their MDs.
As follows from Fig. 6, the Milky Way with the suite of its companions does not look like a quite typical group. This observational fact should be taken into account when comparing the results of N-body simulations (Knebe et al. 2011, Libeskind et al.2010) with the properties of the galaxies in the Local Group.
According to {} diagram the suite around M81 is most similar to our Galaxy with its neighbors. However, the M81 group has its essential features: the presence of HI-filaments (Yun 1999), young “tidal” Holm IX- type dwarfs (Makarova et al. 2002), and also BCD galaxies (Chiboucas et al. 2009), which all are absent in the Local Group.
5 On the kinematics of companions in MD suites
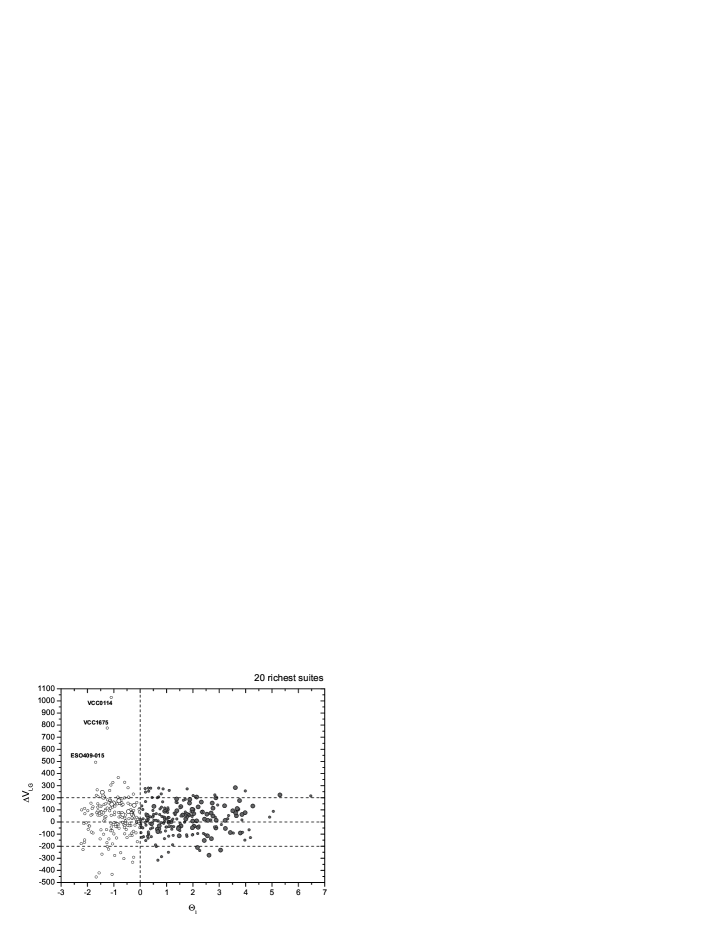
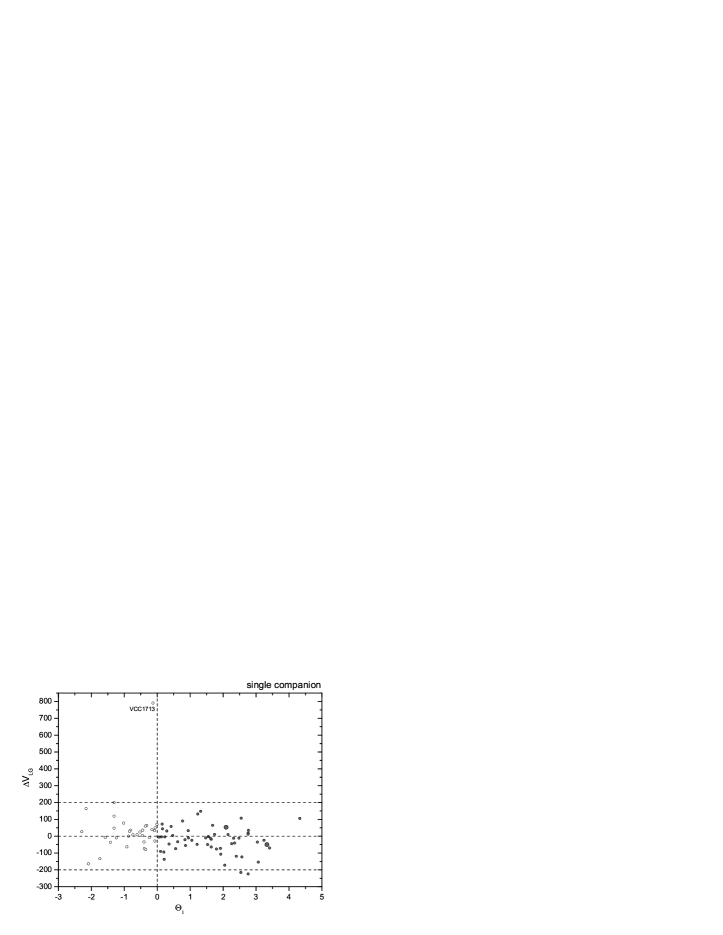
The penultimate column of Table 1 shows the line-of-sight velocities of galaxies of the suite relative to the velocity of the main galaxy. These data provide important information about the kinematics and dynamics of the nearest groups. The distribution of line-of-sight velocity difference in 20 most populated suites around their massive main galaxies is shown in the left panels of Fig. 7. Physical members of the groups with are depicted by filled circles, while the peripheral objects (or field galaxies) are marked by open circles. As we can see from the top panel, the variance of the line-of-sight velocity difference is almost independent on the value of in the region of .
All the group members, except one lie in the strip of km s-1. However, among the field galaxies with , there are some cases with a large line-of-sight velocity difference, for example, dwarf galaxies VCC 114 and VCC 1675 in front of the Virgo cluster, for which the giant Sombrero galaxy (NGC 4594) turned out to be the MD. Increasing relative velocity scatter in the region of is quite expected and indicates the absence of a physical relation of such galaxies with their MDs.
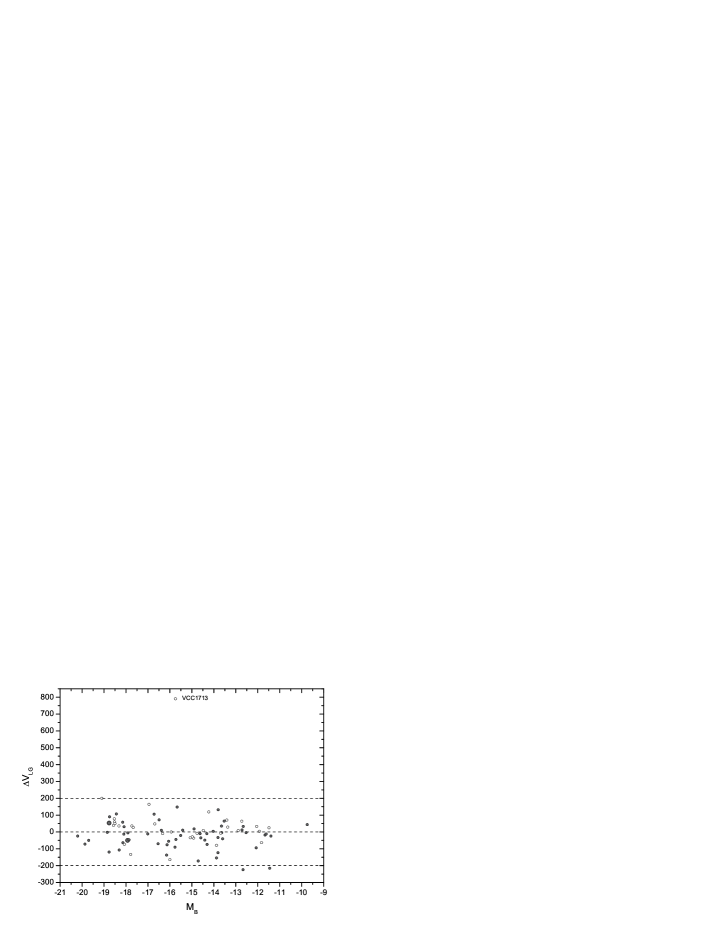
The bottom left panel of Fig. 7 compares the velocity difference in the suite galaxies with the absolute magnitude of their main galaxy. In the physical group members (filled circles), the velocity dispersion tends to decrease towards the low luminosity of main galaxies.
The right-hand panels of Fig. 7 represent the same data for the least populated suites which are composed of one galaxy only. The luminosities and masses of MDs with one companion are much lower than those of the main galaxies of 20 populated suites. Obviously, for this reason, the variation in the line-of-sight velocity difference there lies in a narrower strip of only km s-1, which is substantially lower than in the companions of massive galaxies.
It should be mentioned that a significant part of galaxies in the nearby suites has no line-of-sight velocity measurements to date. Filling this gap is an urgent observational task.
6 Concluding remarks
The above data show that nearby groups of galaxies significantly differ from each other in the structure and morphological composition of its population. This fact should be taken into account when comparing the results of N-body simulations of the Cosmic Web structure with the observational data.
Usually, an object of such a comparison is the Local Group (Libeskind et al. 2010, Zavala et al. 2009, Knebe et al. 2011), which consists of two dynamically isolated suites of dwarf galaxies around the Milky Way and Andromeda (M31), approaching each other with the mutual velocity of centers km s-1. However, by a number of features the Local Group is not typical among the nearby groups. Therefore, a comparison of the results of numerical simulations should be conducted with the characteristics of the mean (synthetic) group of the Local Volume, relying in particular on the data of Table 2.
One of important observational parameters of nearby groups is the number of their members. To characterize not a single group, but rather their ensemble in a certain volume we usually chose the value of the mean group population, . Trentham & Tully (2002) added another dimensionless variable to this parameter, the ratio of the numbers of dwarf and normal galaxies , which according to them varies greatly from one group to another. It is easy to see that both of these parameters, and are not robust characteristics, as they are sensitive to the choice of the threshold absolute magnitudes for dwarf galaxies and normal ones.
If one considers the belonging a certain galaxy to its Main Disturber as an analogue of a bibliographic reference, then the ensemble of suites around the MDs in a fixed volume can be described by a single number – the h-index suggested by Jorge E. Hirsch (2005). The value of equal to, say, 10 means that the given volume contains 10 suites (or groups) with the number of companions to the MDs of 10 or more. According to the data of Table 1, we see that the suites in the Local Volume are characterize by h-index of . Ignoring the suite members with as the general field galaxies, for the physical groups of galaxies in the Local Volume we obtain the index. The h-index is quite robust. If we exclude the ultra-dwarf galaxies with from the group members, then the h-index for the groups will remain unchanged.
We have to note that, in general, the suite can show hierarchy structure: the main suite can contains sub-suites. Table 1 gives us these examples: the LMC belongs to the suite of the Milky Way, but at the same time it is the MD for its close neighbor — SMC; another example in the Local Group is the dwarf spheroidal galaxy And XXII near M 33, which is itself a member of the suite of M 31. In such cases, the populations of “secondary” sub-suites can be considered as members of the general suite around the most massive galaxy. Nevertheless, it follows from the Table 1 data that the account of the presence of hierarchical sub-groups does not change the value of the h-index for the Local Volume.
The nowadays sky surveys in the optical range and in the HI line discover new galaxies in the Local Volume and measure/refine their line-of-sight velocities. The Hubble Space Telescope continues the programs measuring the distances to the nearby galaxies. These targeted efforts promise to make soon the Local Volume as the fair sample for the analysis of various properties of galaxies and their systems.
Acknowledgements
This work was supported by the Russian Foundation for Basic Research through grants RFBR-DFG 12–02–91338, RFBR-RUS-UKR 12–02–90407 and RFBR 11-02-00639, as well as the Ministry of Education and Science of the Russian Federation (project 8523). Support for the HST proposals GO 12546, 12877, and 12878 was provided by NASA through grants from the Space Telescope Science Institute. We acknowledge the usage of the HyperLeda database (http://leda.univ-lyon1.fr). This research has made use of the NASA/IPAC Extragalactic Database (NED), which is operated by the Jet Propulsion Laboratory, California Institute of Technology, under contract with the National Aeronautics and Space Administration.
References
Bell E.F., McIntosh D.H., Katz N., Weinberg M.D., 2003, ApJS, 149, 289
Benitez-Llambay A., Navarro J.F., Abadi M.G. et al., 2013, ApJ, 763L, 41
Chiboucas K., Karachentsev, I.D., Tully R.B., 2009, AJ, 137, 3009
Hirsch J.E., 2005, Proceedings of the National Academy of Science, 102, 16569 (arXiv:physics/0508025)
Jiang C.Y., Jing Y.P., Li Cheng, 2012, arXiv:1209.5930
Jones D.H., Peterson B.A., Colless M., Saunders,W., 2006, MNRAS, 369, 25
Kaisina E.I., Makarov D.I., Karachentsev, I.D., Kaisin S.S., 2012, AstBu, 67, 115
Karachentsev I.D., Makarov D.I., 1999, IAU Symposium, 186, 109
Karachentsev I.D., Makarov D.I., Kaisina E.I., 2013, AJ, 145, 101
Karachentsev I.D., Kaisina E.I., Kaisin S.S., Makarova L.N., 2011, MNRAS, 415L, 31
Karachentsev, I.D., 2005, AJ, 129, 178
Karachentsev I.D., Kasparova A.V., 2005, Astronomy Letters, 31, 152
Karachentsev I.D., Karachentseva V.E., Huchtmeier W.K., Makarov D.I., 2004, AJ, 127, 2031
Karachentsev I.D., Sharina M.E., Dolphin A., et al, 2001, A & A, 379, 407
Karachentseva V.E., Karachentsev I.D., Sharina M.E., 2010, Astrophysics, 53, 513 (arXiv:1104.2506)
Kitaura F.S., Erdogdu P., Nuza S.E. et al., 2012, MNRAS, 427L, 35
Klypin A., Hoffman E., Kravtsov A., Gottloeber S., 2003, ApJ, 596, 19
Klypin A., Trujillo-Comez S., Primack J., 2011, ApJ, 740, 102
Knebe A., Libeskind N.I., Doumler T., et al. 2011, MNRAS, 417L, 56
Lee M.G., Freedman W.L., & Madore B.F., 1993, AJ, 106, 964
Libeskind N.I., Yepes G., Knebe A., et al, 2010, MNRAS, 401, 1889
Makarov D.I., Uklein R.I., 2012, Astr. Bull., 67, 135
Makarov D.I., Makarova L.N., Sharina M.E. et al., 2012, MNRAS, 425, 709
Makarov D.I., Karachentsev I.D., 2011, MNRAS, 412, 2498
Makarova L.N., Grebel E.K., Karachentsev I.D., et al, 2002, A & A, 396, 473
Rodrigues-Puebla A., Avila-Reese V., Drory N., 2013, ApJ, 773, 172
Slater C.T., Bell E.F., 2013, ApJ, 773, 17
Trentham N., Tully R.B., 2002, MNRAS, 335, 712
Tully R.B., Shaya E.J., Karachentsev I.D. et al., 2008, ApJ, 676, 184
Yun M.S., 1999, in IAU symposium, vol.186, Galaxy Interactions at Low and High Redshift, J.E. Barnes & D.B.Sanders, ed., p.81
Wang W., White S., 2012, MNRAS, 424, 2574
Zavala J., Jing Y.P., Faltenbacher A., et al, 2009, ApJ, 700, 1779
| Name | MD | |||||||||
| HolmIX | 2.96 | 13.6 | 7.70 | 8.53 | 8.40 | 5.1 | MESSIER081 | 3.61 | 88 | 53 |
| ClumpI | 0.20 | 8.3 | 5.57 | 4.2 | MESSIER081 | 3.60 | 129 | 53 | ||
| KDG061 | 1.55 | 12.9 | 8.09 | 4.0 | MESSIER081 | 3.60 | 256 | 53 | ||
| CKT2009d0959+68 | 0.88 | 10.1 | 6.29 | 4.0 | MESSIER081 | 3.60 | 150 | 53 | ||
| ClumpIII | 0.11 | 8.3 | 5.57 | 3.9 | MESSIER081 | 3.60 | 85 | 53 | ||
| NGC2976 | 6.17 | 17.1 | 9.42 | 9.15 | 8.03 | 2.9 | MESSIER081 | 3.56 | 38 | 53 |
| MESSIER082 | 13.16 | 19.6 | 10.57 | 9.86 | 8.95 | 2.8 | MESSIER081 | 3.53 | 224 | 53 |
| KDG064 | 2.19 | 12.6 | 7.98 | 2.7 | MESSIER081 | 3.70 | 17 | 53 | ||
| CKT2009d0934+70 | 0.87 | 9.6 | 6.80 | 2.5 | MESSIER081 | 3.66 | 53 | |||
| IKN | 3.15 | 11.6 | 7.60 | 6.20 | 2.5 | MESSIER081 | 3.75 | 105 | 53 | |
| HIJASS J1021+6842 | 7.51 | 2.3 | MESSIER081 | 3.70 | 83 | 53 | ||||
| CKT2009d0939+71 | 0.38 | 8.4 | 5.60 | 2.3 | MESSIER081 | 3.63 | 53 | |||
| KK77 | 2.89 | 12.0 | 7.76 | 6.14 | 2.2 | MESSIER081 | 3.48 | 53 | ||
| F8D1 | 2.70 | 12.6 | 7.99 | 6.20 | 2.2 | MESSIER081 | 3.77 | 96 | 53 | |
| KDG063 | 2.18 | 12.1 | 7.80 | 6.70 | 6.91 | 2.0 | MESSIER081 | 3.50 | -104 | 53 |
| DDO078 | 2.23 | 11.5 | 7.54 | 1.9 | MESSIER081 | 3.72 | 87 | 53 | ||
| HolmI | 5.29 | 14.5 | 8.01 | 7.95 | 8.01 | 1.7 | MESSIER081 | 3.84 | 187 | 53 |
| CKT2009d1006+67 | 0.39 | 8.5 | 6.37 | 1.6 | MESSIER081 | 3.87 | 53 | |||
| CKT2009d0955+70 | 0.48 | 9.1 | 6.60 | 1.5 | MESSIER081 | 3.93 | 53 | |||
| KDG073 | 1.29 | 10.8 | 6.56 | 6.39 | 6.51 | 1.4 | MESSIER081 | 3.70 | 159 | 53 |
| UGC05497 | 0.96 | 12.3 | 7.18 | 6.11 | 6.02 | 1.4 | MESSIER081 | 3.70 | 163 | 53 |
| CKT2009d0926+70 | 0.56 | 10.0 | 6.24 | 5.64 | 1.3 | MESSIER081 | 3.93 | 53 | ||
| CKT2009d0944+69 | 0.26 | 7.4 | 5.92 | 1.3 | MESSIER081 | 3.98 | 53 | |||
| BK6N | 1.23 | 11.1 | 7.38 | 1.2 | MESSIER081 | 3.85 | 53 | |||
| HS117 | 1.90 | 11.2 | 6.72 | 6.25 | 5.01 | 1.2 | MESSIER081 | 3.96 | 12 | 53 |
| BK3N | 0.40 | 9.6 | 6.09 | 5.82 | 7.26 | 1.2 | MESSIER081 | 4.02 | 3 | 53 |
| Note. Only a portion of this table is shown here to demonstrate its form and content. | ||||||||||
| Machine-readable version of the full table is available. | ||||||||||
| MD | D | ||||||||||||
|---|---|---|---|---|---|---|---|---|---|---|---|---|---|
| M.Way | 0.01 | 38 | 29 | 5 | 20.8: | 10.5: | 11.3: | 25: | 9.5: | 4 | 2.8 | 2.9 | 1.6 |
| M 31 | 0.77 | 42 | 39 | 10 | 21.40 | 10.73 | 11.50 | 43.4 | 9.73 | 3 | 4.9 | 4.9 | 1.4 |
| IC 342 | 3.28 | 10 | 9 | 9 | 20.69 | 10.60 | 11.15 | 34.2 | 10.16 | 6 | 0.1 | 0.5 | 1.7 |
| M 81 | 3,63 | 53 | 37 | 22 | 20.92 | 10.93 | 11.27 | 31.4 | 9.44 | 3 | 2.5 | 2.6 | 1.5 |
| N 5128 | 3.75 | 37 | 26 | 16 | 20.78 | 10.91 | 11.70 | 42.6 | 8.46 | -2 | 0.7 | 1.0 | 1.6 |
| N 253 | 3.94 | 25 | 8 | 7 | 21.29 | 11.04 | 11.24 | 40.8 | 9.15 | 5 | 0.4 | 0.3 | 0.7 |
| N 4826 | 4.37 | 11 | 3 | 3 | 19.51 | 10.48 | 10.70 | 17.8 | 8.26 | 2 | 0.8 | 0.5 | 1.0 |
| N 4736 | 4.66 | 31 | 15 | 12 | 19.86 | 10.61 | 10.73 | 20.7 | 8.32 | 2 | 0.6 | 0.1 | 0.8 |
| N 5236 | 4.92 | 28 | 15 | 14 | 20.64 | 10.86 | 11.32 | 28.2 | 10.00 | 5 | 0.5 | 0.0 | 0.0 |
| M 101 | 7.38 | 11 | 6 | 5 | 21.12 | 10.85 | 11.35 | 65.2 | 9.91 | 6 | 0.4 | 0.5 | 0.2 |
| N 4631 | 7.38 | 16 | 5 | 4 | 20.28 | 10.49 | 10.41 | 33.7 | 9.72 | 7 | 1.8 | 1.9 | 1.0 |
| N 2683 | 7.73 | 13 | 2 | 2 | 20.36 | 10.60 | 11.14 | 29.5 | 8.94 | 3 | 0.0 | 0.2 | 1.3 |
| N 4258 | 7.83 | 31 | 19 | 17 | 21.20 | 10.94 | 11.33 | 41.5 | 9.64 | 4 | 1.1 | 1.3 | 0.6 |
| N 6744 | 8.30 | 12 | 6 | 6 | 20.96 | 10.79 | 11.35 | 52.8 | 10.19 | 4 | 2.0 | 2.0 | 1.2 |
| N 2903 | 8.87 | 15 | 4 | 4 | 20.89 | 10.82 | 11.13 | 32.4 | 9.44 | 4 | 1.7 | 1.7 | 0.8 |
| N 5055 | 8.99 | 11 | 5 | 5 | 20.98 | 10.99 | 11.34 | 42.2 | 9.62 | 4 | 0.1 | 0.1 | 0.9 |
| N 4594 | 9.30 | 32 | 10 | 10 | 21.82 | 11.30 | 11.76 | 32.5 | 8.36 | 1 | 2.5 | 2.6 | 0.4 |
| N 3115 | 9.68 | 12 | 7 | 7 | 20.77 | 10.95 | 10.50 | 24.0 | 8.75 | 1 | 2.3 | 2.6 | 0.2 |
| N 2784 | 9.82 | 9 | 6 | 6 | 19.65 | 10.80 | - | 19.3 | 8.0 | 2 | 3.1 | 3.2 | 1.0 |
| N 3368 | 10.42 | 31 | 31 | 31 | 20.40 | 10.83 | 11.14 | 27.2 | 9.18 | 3 | 1.1 | 1.5 | 2.1 |
| –0.48 | –0.37 | 0.23 | 0.41 | 0.03 | –0.02 | –0.06 | 0.29 | 0.27 | 0.44 | |
| –0.48 | –0.31 | 0.17 | 0.39 | 0.08 | 0.12 | –0.11 | 0.43 | 0.39 | 0.74 | |
| –0.08 | –0.24 | 0.42 | 0.33 | 0.07 | 0.05 | -0.17 | 0.17 | 0.12 | 0.63 |
| Name | Type | MD | D | ||||||||
|---|---|---|---|---|---|---|---|---|---|---|---|
| KKR08 | Sph–L | 1.35 | 11.7 | 7.62 | 7.02 | 1.6 | NGC4594 | 8.00 | 32 | ||
| KKH65 | Sph–L | 1.70 | 12.7 | 8.02 | 1.4 | NGC3627 | 10.00 | 8 | |||
| UGC1703 | Tr– N | 1.05 | 11.5 | 7.56 | 6.30 | 1.3 | Maffei2 | 4.19 | 8 | ||
| KDG216 | Tr– L | 1.99 | 12.1 | 7.78 | 6.77 | 1.2 | NGC4826 | 6.00 | 11 | ||
| KK258 | Tr– L | 0.98 | 10.3 | 7.06 | 5.65 | 1.1 | NGC0253 | 2.00 | 25 | ||
| KDG218 | Tr– L | 2.73 | 11.9 | 7.71 | 6.61 | 1.0 | NGC5236 | 5.00 | 28 | ||
| KKR25 | Sph–L | 0.59 | -9.4 | 6.71 | 4.91 | 1.0 | M 31 | 1.86 | 157 | 42 | |
| NGC4600 | S0e–N | 3.49 | 15.8 | 9.12 | 7.06 | 1.0 | NGC4594 | 7.35 | 181 | 32 | |
| NGC0404 | S0e–N | 3.25 | 16.5 | 9.28 | 9.58 | 7.93 | 0.8 | Maffei2 | 3.05 | 21 | 8 |
| KK227 | Tr– L | 2.06 | 12.5 | 7.97 | 0.6 | NGC5055 | 10.00 | 11 | |||
| NGC0059 | dEe–N | 3.52 | 15.7 | 8.72 | 8.25 | 7.40 | 0.5 | NGC0253 | 5.30 | 155 | 25 |
| Tucana | Tr– L | 0.73 | 9.2 | 6.62 | 4.18 | 0.2 | Milky Way | 0.88 | 138 | 38 | |
| UGC8882 | dE– N | 2.58 | 13.9 | 7.67 | 0.0 | M 101 | 8.32 | 104 | 11 |
| Name | Type | MD | D | ||||||||
|---|---|---|---|---|---|---|---|---|---|---|---|
| HolmIX | Ir– N | 2.96 | 13.6 | 7.70 | 8.53 | 8.40 | 5.1 | M 81 | 3.61 | 88 | 53 |
| KK200071 | Ir– N | 4.41 | 14.7 | 8.13 | 4.7 | NGC6744 | 8.30 | 12 | |||
| ClumpI | Ir– N | 0.20 | 8.3 | 5.57 | 4.2 | M 81 | 3.60 | 129 | 53 | ||
| CKT0959+68 | Ir– L | 0.88 | 10.1 | 6.29 | 4.0 | M 81 | 3.60 | 150 | 53 | ||
| KK200072 | Ir– L | 1.36 | 11.9 | 7.00 | 4.0 | NGC6744 | 8.30 | 12 | |||
| ClumpIII | Ir– N | 0.11 | 8.3 | 5.57 | 3.9 | M 81 | 3.60 | 85 | 53 | ||
| KKSG18 | BCD–N | 4.45 | 16.6 | 9.27 | 3.9 | NGC3115 | 9.70 | 17 | 12 | ||
| KKSG20 | Ir– N | 1.68 | 12.8 | 7.37 | 6.69 | 6.18 | 3.9 | NGC3521 | 10.70 | 38 | 4 |
| KK200070 | Ir– L | 1.37 | 12.1 | 7.09 | 3.8 | NGC6744 | 8.30 | 12 | |||
| LV1217+47 | Tr– L | 0.69 | 11.0 | 6.66 | 6.44 | 3.6 | NGC4258 | 7.80 | 31 | ||
| LMC | Im– N | 10.06 | 17.9 | 9.42 | 9.44 | 8.66 | 3.5 | M.Way | 0.05 | 93 | 38 |
| ESO104-044 | Ir– L | 4.37 | 14.8 | 8.17 | 8.81 | 8.33 | 3.5 | NGC6744 | 8.30 | 92 | 12 |
| KK251 | Ir– L | 3.48 | 13.6 | 7.70 | 8.32 | 8.05 | 3.5 | NGC6946 | 5.89 | 78 | 8 |
| N2903-HI-1 | Ir– N | 0.71 | 11.7 | 6.92 | 5.99 | 6.42 | 3.3 | NGC2903 | 8.90 | 27 | 15 |
| KK69 | Ir– L | 3.15 | 12.2 | 7.12 | 6.65 | 7.51 | 3.3 | NGC2683 | 7.70 | 53 | 13 |
| UGC11583 | Ir– L | 4.71 | 14.3 | 7.98 | 8.98 | 8.27 | 3.3 | NGC6946 | 5.89 | 74 | 8 |
| LeG13 | Ir– N | 1.25 | 12.8 | 7.35 | 5.97 | 6.75 | 3.1 | NGC3368 | 10.40 | 22 | 31 |
| KK252 | Ir– L | 2.33 | 14.1 | 7.89 | 8.73 | 7.04 | 3.1 | NGC6946 | 5.89 | 86 | 8 |