Electronic properties of \CFS investigated by x-ray magnetic linear dichroism
Abstract
We present experimental XMLD spectra measured on epitaxial (001)-oriented thin \CFS films, which are rich in features and depend sensitively on the degree of atomic order and interdiffusion from capping layers. Al- and Cr-capped films with different degrees of atomic order were prepared by DC magnetron sputtering by varying the deposition temperatures. The local structural properties of the film samples were additionally investigated by nuclear magnetic resonance (NMR) measurements. The XMLD spectra of the different samples show clear and uniform trends at the edges. The Al-capped samples show similar behavior as previous measured XMLD spectra of Co2FeSi0.6Al0.4. Thus, we assume that during deposition Al atoms are being implanted into the subsurface of \CFS. Such an interdiffusion is not observed for the corresponding Cr-capped films, which makes Cr the material of choice for capping \CFS films. We report stronger XMLD intensities at the Co and Fe egdes for films with a higher saturation magnetization. Additionally, we compare the spectra with ab initio predictions and obtain a reasonably good agreement. Furthermore, we were able to detect an XMCD signal at the Si -edge, indicating the presence of a magnetic moment at the Si atoms.
pacs:
75.70.-i, 78.70.Dm, 71.20.Lp, 75.50.-y,I Introduction
Materials with a high spin polarization at the Fermi edge are promising for spintronic devices.Wolf et al. (2001) Heusler compounds, which have been predicted to be half-metallic ferromagnets, are currently considered as potentially interesting materials for this purpose.de Groot et al. (1983) Heusler compounds have a distinctive stoichiometry and crystallize in the L21-structure X2YZ, where X and Y are transition metals and Z is a main group element. Among the Heusler compounds, \CFS has shown the highest magnetization of 6 per formula unit,Wurmehl et al. (2005) in agreement with the Slater-Pauling rule , where is the number of valence electrons.Fecher et al. (2006) Moreover, \CFS is the Heusler compound with the highest Curie temperature. Therefore, \CFS might be an ideal material for spintronics applications, provided that the prediction of half-metallic ferromagnetic properties is correct, as was indeed recently suggested by Ref. Bombor et al., 2013.
However, Co2FeSi is predicted to be a half-metallic compound only if electron correlations are considered in the form of the on-site repulsion energy U. Neglecting the electron correlations, \CFS is predicted to be a conventional ferromagnet.Kallmayer et al. (2011) Hence, a reliable probe of half-metallic ferromagnetism in \CFS is still needed. The calculations reported in Ref. Kallmayer et al., 2011 show a significant change in the x-ray magnetic linear dichroism (XMLD) spectra if electron correlation effects are considered. Thus, XMLD may serve as a crucial test for band structure calculation schemes as the XMLD, in a single-particle picture, is roughly speaking proportional to the first derivative of the minority density-of-states function (PDOS) in contrast to the x-ray magnetic circular dichroism being directly proportional to the DOS.Kunes et al. (2004) Meinert et al.Meinert et al. (2012) already investigated XMLD for \CFS and compared it to a variety of density functional theory-based calculations. Although the comparison, shown in Ref. Meinert et al., 2012, rules out some band structure models, qualitative differences between experiment and theoretical predictions still remained.
In this article, we present XMLD spectra measured on a series of \CFS film samples with systematically varied atomic order. The increase of atomic order results in an increase of magnetization, which suggests a concomitant transition from metallic to half-metallic ferromagnetic behavior. Thus, according to theoretical calculations, a considerable altering of the spectra is expected. To address the relation between the measured XMLD spectra and the underlying electronic structure, we employed various exchange-correlation functionals, used a few different values of the Hubbard () parameter and performed a number of calculations using the so-called non-selfconsistent fixed spin moment technique. Although the overall spectrum is well given, the fine structure appearing predominantly at the edge is not sufficiently captured.
II Experimental
Epitaxial (001)-oriented \CFS films were grown by DC magnetron sputtering onto MgO(001) substrates in a UHV system with a base pressure of 1·10-9 mbar. The distance between the film and the stoichiometric target of \CFS was 10 cm, while the Ar working pressure was 7.77·10-2 mbar. Different degrees of local atomic order in the films were achieved by setting different substrate temperatures at each film deposition in the range of 470∘C to 730∘C. The substrate temperature was determined with a pyrometer set to an emissivity of 0.31. To prevent oxidation the films were capped immediately after deposition with a 3 nm thick capping layer grown at room temperature. We used both Al and Cr as a capping layer.
The saturation magnetization of each film was determined with a superconducting quantum interference device (SQUID) magnetometer (Quantum Design, MPMS-XL-5) at 20 K and 300 K with magnetic fields up to 3 T. Thickness determination and structural characterization were performed by x-ray reflection/diffraction with a Phillips X’pert diffractometer.
The x-ray absorption spectra (XAS) were recorded at the synchrotron light source BESSY II (beamline UE56/1-SGM). The samples were mounted perpendicular to the beam and were magnetically saturated by an external field parallel to the film surface. The degree of linear polarization of the synchrotron radiation was close to 100 %. All measurements were performed at room temperature with the total-electron-yield (TEY) technique where the specimen current is measured. The photon intensity was measured by a gold mesh. The polarization of the photon beam was switched between linear vertical and linear horizontal while the magnetic field was kept constant. The linear dichroism is calculated as the difference between spectra measured with horizontal and vertical polarization.
The NMR experiments were performed in an automated, coherent, phase sensitive and frequency tuned spin-echo spectrometer provided by NMR Service Erfurt, Germany. The NMR spectra were recorded at a temperature of 5 K and in the frequency range of 120-200 MHz with steps of 0.5 MHz. No external magnetic field was applied during the measurements. All NMR spectra were corrected for the magnetic enhancement factor as well as the dependence, resulting in relative spin-echo intensities, which are proportional to the number of nuclei with a given NMR resonance frequency. The procedure of the enhancement correction is described in Refs. Wurmehl and Kohlhepp, 2008 and Panissod, 1997.
II.1 Ab initio calculations
The electronic structure of the \CFS was calculated with the WIEN2k codeBlaha et al. (2001) in the density-functional theory (DFT) framework, employing the local spin density approximationPerdew and Wang (1992) and the general gradient appoximation (GGA), the latter as parameterized by Perdew-Burke-ErnzerhofPerdew et al. (1996) for the exchange-correlation term. Electronic correlations were included by using the so-called Hubbard U approach (LSDA+U, GGA+U) in the self-interaction corrected formulation.Anisimov et al. (1993) Calculations on the basis of the conventional usual local spin density approximation or the GGA alone, i.e. without additional Hubbard U, do not give a correct magnetic moment for Co2FeSi as was already pointed out before by several authors (see Refs. Kallmayer et al., 2011 and Meinert et al., 2012 and references therein). All calculations presented here were done for the lattice parameter Å.
The core electrons were treated fully relativistically (Dirac equations) and for the semicore and valence states the spin-orbit interaction (SOI) was included through a variational scheme.Blaha et al. (2001) The convergence of the electronic structure calculations was ensured by the following parameters: the convergence criterion of the total energy was better than Ry/atom; the energy cutoff given as the product of the muffin-tin radius and the maximum reciprocal space vector was 8.5, the largest reciprocal vector in the charge Fourier expansion, , was set to 12 Ry1/2, the maximum angular momentum value of partial waves inside the muffin-tin spheres was 10, and a grid of 202020 -points was applied to sample the 1st Brillouin zone. The same -point mesh was used to determine dipolar squared momentum matrix elements, which occur in the Kubo formula for the permittivity tensor. To account for lifetime effects a broadening with a Lorentzian with a width of 0.3 eV was applied for the x-ray spectra from core (localized) to unoccupied states (delocalized states). The core level exchange splitting was also included.Kunes and Oppeneer (2003) The Kramers-Kronig transformations were performed and the complex values of permittivity tensor elements were obtained. Subsequently, permittivity elements served as input for our in-house optical code solving Fresnel equations using 4-vector Yeh’s formalism as extended for magnetic multilayers.Višňovský (1991) We hence obtain the reflectivity and transmittivity matrices () for each magnetization direction M. The absorbance is defined as
| (1) |
where is absorptance, denotes scatter and reflection of the material. The thickness dependent reflectivity and transmittivity matrices then lead to the attenuation coefficient , which for both polarizations M and M is calculated according to the Beer-Lambert law
| (2) |
where the incident intensity and the attenuated intensity for the first (second) polarization is , where is the sample thickness. Note, that the absorption coefficient differs from absorptance defined as , i.e. incoming and absorbed intensity. Finally, the linear dichroism is computed here as XMLD = . Note, that this holds only for normal incidence. The normalization factor used was .
III Structural properties
The long range order of the atomic structure of the films was determined with 4-circle x-ray diffraction. The obtained lattice constant of the films is 5.64 0.01 Å, in agreement with previous measurements of \CFS thin films as well as bulk material.Schneider et al. (2006) The rocking curves reveal widths between 0.29∘ and 0.73∘. To determine the L21 structure within the sample series, it is not sufficient to compare the maximum intensities of the (202) - and (111) - film reflections. Rather the ratio of the integrated peak areas of - scans provides a better estimation of the real intensity ratios. We measured the rocking curves of the (202) - and (111) - reflections, which were fitted with Gaussian functions to determine the enclosed areas of the reflections. We compare our values with results calculated for powder diffraction corrected with the geometry factor according to Bragg Brenato and multiplicity. The ratio of the individual reflections is given by the program PowderCell as . Higher ratios of are due to Fe atoms located on Si sites and vice versa. Structural data and magnetization values measured by a SQUID magnetometer, as well as NMR results, are summarized in Table 1.
| Film | TSub | dcapping | msat | NMR freq. | NMR linewidth | NMR spacing | Fe-Si off- | ||
|---|---|---|---|---|---|---|---|---|---|
| ( ∘C) | (nm) | (/f.u.) | () | (MHz) | (MHz) | (MHz) | stoichiometry (%) | ||
| CFS(Cr1) | 470 | 3.0 Cr | 4.89 | 0.87 | 21.7 | 144.85 | 8.59 | 33 | 1.59 |
| CFS(Cr2) | 620 | 3.0 Cr | 4.33 | 0.55 | 17.0 | 145.54 | 8.03 | 33 | 1.38 |
| CFS(Cr3) | 640 | 3.0 Cr | 5.37 | 0.46 | 15.1 | 144.41 | 8.03 | 31 | 1.12 |
| CFS(Cr4) | 730 | 3.0 Cr | 5.80 | 0.37 | 11.1 | 144.15 | 7.90 | 27 | 0.32 |
| CFS(Al1) | 540 | 3.0 Al | 5.02 | 0.54 | - | 144.89 | 8.39 | 33 | 1.72 |
| CFS(Al2) | 640 | 3.0 Al | 5.31 | 0.69 | - | 144.42 | 7.68 | 30 | 1.38 |
| CFS(Al3) | 715 | 3.0 Al | 4.98 | 0.35 | - | 144.68 | 8.75 | 31 | 1.48 |
| CFS(Al4) | 715 | 3.6 Al | 6.10 | 0.34 | - | 146.60 | 6.57 | 28 | 0.47 |
We see an increase of the saturation magnetization with higher substrate temperatures, except for CFS(Cr2), which exhibits the lowest value. In the Al-capped series we find the same for CFS(Al3). In general a systematic dependency for all values on the substrate temperature is observed.
IV Results
IV.1 Experimental results
IV.1.1 XMLD spectra
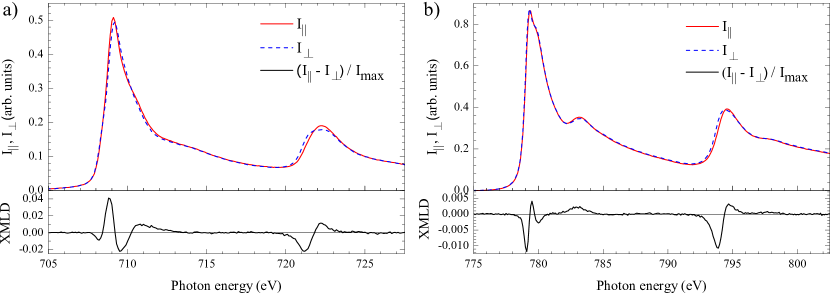
The absorption intensity is measured for the electric field vector of the linearly polarized beam parallel and perpendicular to the magnetization vector. The differences result in the corresponding XMLD spectra. The XMLD spectra were measured for each sample at the Co and Fe edges with the magnetization vector along the in-plane directions [100] and [110]. Each XMLD spectrum was normalized by the maximum value of the respective edge of the averaged XAS spectrum. Fig. 1 shows exemplarily two XAS spectra measured in [100] orientation at the Fe (a) and Co (b) edge with the corresponding XMLD spectra. At the Co [100] XAS spectra the maximum at the edge is followed by a shoulder with a distance of 4 eV. This is typical for the Heusler structure and was already observed for different Heusler compounds (Refs. Telling et al., 2006; Klaer et al., 2009; Elmers et al., 2003). An analogous shoulder is visible for the Co edge at the energy 798.1 eV above the peak, which is smaller due to lifetime broadening effects.Elmers et al. (2003)
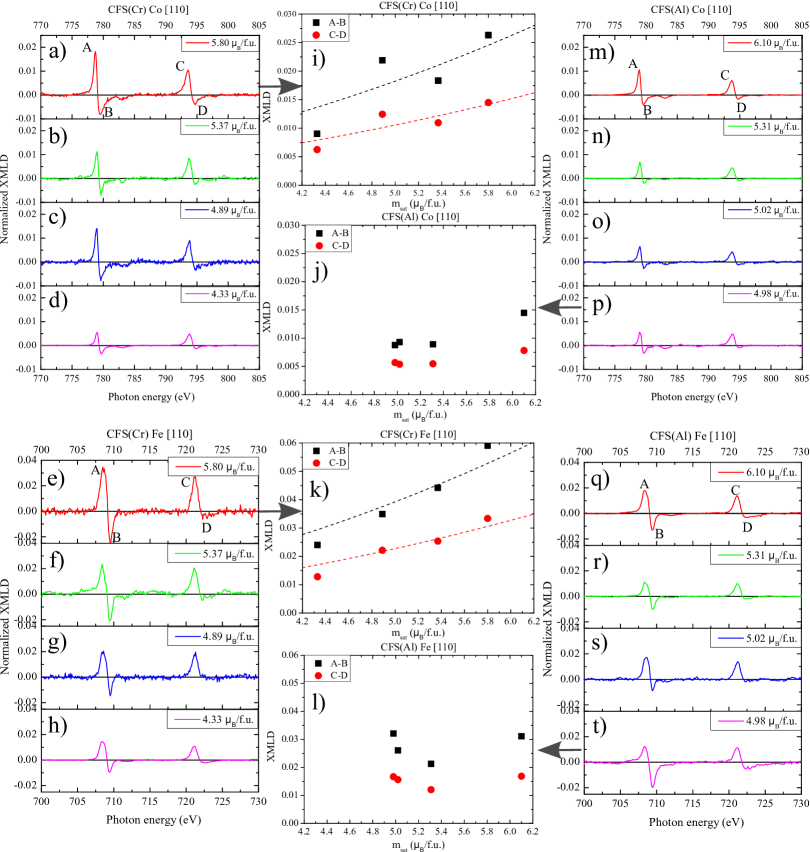
The complete set of XMLD spectra for each film is presented in Fig. 2 (for the case of [100]) and Fig. 3 (for the case of [110]). For direct comparison, the XMLD spectra for Cr- and Al-capped films are displayed on the left- and right-hand side, respectively. The spectra measured at the Co -edge are presented in the top panels and those measured at Fe -edge in the bottom panels.
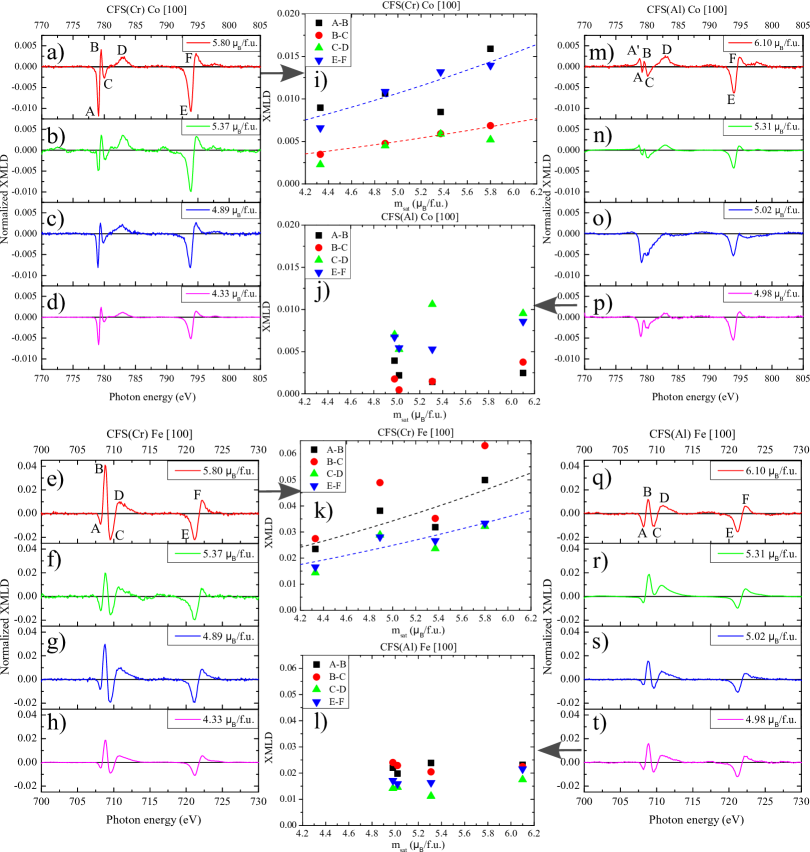
The structure of the XMLD spectra clearly exhibits more features at the edge than the XMCD spectra of \CFS, which was already predicted by Ref. Kallmayer et al., 2011 and reported in Ref. Meinert et al., 2012. The spectra measured for the \CFS(Cr4) film with the deposition temperature of 730∘C (Fig. 1 and Fig. 2 a,e) agree in all details of the spectra with the spectra reported in Ref. Meinert et al., 2012. The largest XMLD signal is observed for the \CFS(Cr) film with the highest magnetization (5.8 /f.u.). Maximum XMLD values of 4.1 % at the Fe edge for [100] (Fig. 2 e) and 3.4 % at the Co edge for [110] (Fig. 3 e) are obtained.
IV.1.2 Influence of the capping layer
Due to the surface sensitivity of the TEY method different interface properties for different capping materials can be detected. The information depth of TEY is given by the mean free path of the emitted secondary electrons and typically amounts to 2.5 nm.Kallmayer et al. (2011) We compare two series of samples prepared with identical conditions except for the different capping materials Al and Cr. Both capping materials do not contribute to the absorption spectra in the investigated energy range. Thus, we anticipated no change in the measured XMLD spectra of the films with different capping layers. Contrarily, the two sets of spectra show pronounced differences, as discussed in the following.
The XMLD spectra of the \CFS(Cr) films (see left column of Fig. 2 and Fig. 3) show similar features within the film series at a given field and beam geometry. In contrast, the XMLD spectra of Al-capped films (see right column of Fig. 2 and Fig. 3) show pronounced variations for different samples.
The most striking differences between Cr- and Al-capped films are observed for [100] at the Co edge (Fig. 2 a and Fig. 2 m). For the \CFS(Cr) series at the edge, we note a sharp minimum (A) followed by a sharp maximum (B). For the \CFS(Al) samples, instead, the XMLD spectra starts with a maximum (A’) followed by the minimum A (Fig. 2 m,n). Samples with lower magnetization (Fig. 2 o,p) show a minor (A) but do not show a positive maximum (B).
We assume that the Al atoms interdiffuse into the film. To support our assumption we recorded XMLD spectra (Fig. 4) of a Co2FeSi0.6Al0.4 film, which was deposited at 700∘C and capped with a 3 nm Al layer. Co2FeSi0.6Al0.4 was chosen to mimic a \CFS film with an interdiffusion of Al atoms in the subsurface for the surface-sensitive TEY method. The spectra reveal the same features as for the Al-capped \CFS films for both Fe and Co and directions [100] and [110].
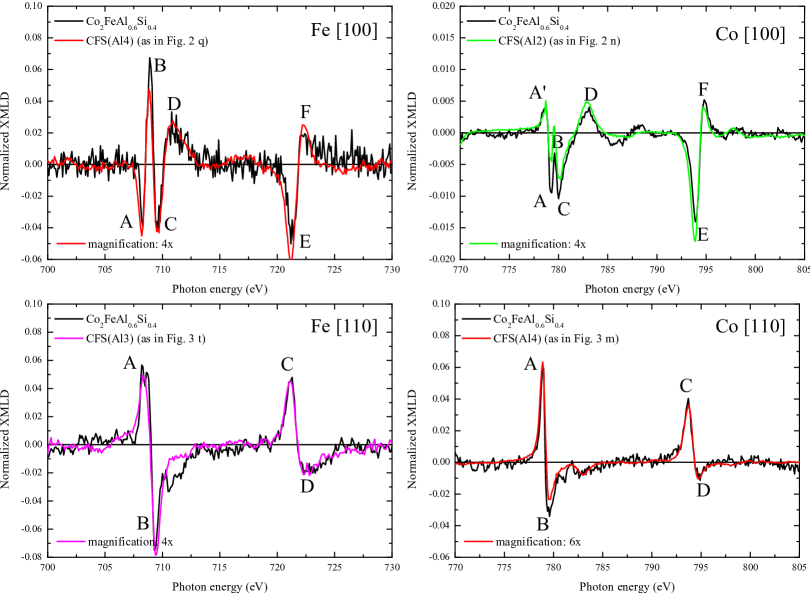
Especially at Co and for direction [100] we see that a maximum A′ is followed by a minimum A, like discussed before. Given the similarity of the XMLD spectra of the Co2FeSi0.6Al0.4 film and the \CFS(Al) series, we assume that during the deposition of the capping layer, Al atoms interdiffuse into the \CFS film. Even though we grew each capping layer at room temperature, our results suggest intermixing, also being partially due to resputtering of the \CFS atoms with the result of Al atoms being implanted into the first atomic layers. As a consequence, the subsurface of the prepared \CFS(Al) films is similar to Co2FeSi0.6Al0.4. Since the TEY method is surface sensitive, the measured XMLD on the \CFS(Al) films resemble the XMLD spectra of the Co2FeSi0.6Al0.4 film. The interdiffusion of the Al atoms manifests in each XMLD spectra differently with respect to the orientation (i.e. the excitation geometry which the sample was measured in). Additionally, the probed element (Co, Fe) plays a role, as the influence of the Al atoms in the upper layer can be clearly observed at the Co edge, whereas the capping has hardly any influence on the XLMD spectra of Fe edge. This is easily understood by taking into account the following argument: The Al capping atoms intermix with Si atoms. This interdiffusion changes the first nearest neighboring shell of Co atoms and only the second nearest neighbor shell of Fe. The non systematic variation can be explained by unknown temperatures of the sample during the deposition of the capping layer. This took place a temperatures between room temperature and 50∘C, where we did not expect any interdiffusion and therefore did not monitor exact temperatures and waiting times. Thus different degrees of intermixing of Al atoms with the film occur. In general it is possible to show interdiffusion via neutron reflectivity measurements of multilayer sample (see Ref. Zabel, 2006). However, to show interdiffusion on a single layer is much more demanding due to the small sample volume and the unknown partial oxidation of the capping layer.
As mentioned above, we encounter no large variations for the Cr-capped films. Hence, we conclude that Cr does not interdiffuse with the \CFS film. A non continuous capping layer would result in a partially oxidized film, which clearly would change the XMLD spectra. We can exclude this as we already showed XMCD spectra of samples without oxidation in Ref. Kallmayer et al., 2007 that were capped with the same material and procedure.
IV.1.3 XMLD versus Magnetization
The XMLD is expected to increase with the square of the magnetization of the sample. To investigate this dependence systematically, the intensity differences of the marked maxima and minima (A, B, C, D, E, and F) were taken as a scale for the XMLD strength. The respective XMLD values were plotted versus the corresponding saturation magnetization of the film (Fig. 2 i,j,k,l and Fig. 3 i,j,k,l). The Co[100]-plot (Fig. 2 i) of the Cr-capped series exhibits an increase of B-C and E-F. The value of A-B of the film with msat = 5.37 /f.u. does not match the general trend of an increase, even though the other samples depict an increase. C-D shows stronger XMLD values with rising saturation magnetization, except the last datapoint of C-D, which is slightly lower than the film with with msat = 5.37 /f.u.. However, a trend of increasing XMLD signal is visible, whereas at the Co[100]-plot for the Al-capped series (Fig. 2 j), no such dependence can be observed. For the Fe[100]-plot with the Cr-capped series (Fig. 2 k), the film with the lowest and the highest saturation magnetization have the smallest, respectively the highest XMLD values as expected. However, the film with 5.37 /f.u. shows smaller values than the film with 4.89 /f.u.. The same can be observed for Co [110] (Fig. 3 i). The Al-capped series of the Fe[100]-plot (Fig. 2 l) and Co[110]-plot (Fig. 3 j) do show very similar values for the XMLD and thus again show no dependence on the saturation magnetization. For the Cr-capped series at the Fe[110]-plot (Fig. 3 k), the value for A-B and C-D increases with the saturation magnetization. For the Al-capped series (Fig. 3 l), it is found that the film with the lowest saturation magnetization of 4.98 /f.u. has the strongest XMLD features. Even the film with 6.10 /f.u. does not exceed these values. Generally, comparing the XMLD spectra of the Cr- and Al-capped films, higher values for the Cr-capped film series were observed.
IV.1.4 NMR results
Nuclear magnetic resonance (NMR) probes all the 59Co nuclei in the film samples due to a rather large penetration depth of the radio frequency wave (typically on the order of m). The surface effects seen in XMLD, namely the formation of a few monolayers of Co2FeSi0.6Al0.4 at the \CFS/Al interface, are not observable by NMR due to a lack of sensitivity, as the signal was optimized to reveal the NMR signals stemming from the bulk of the films. Note that the NMR spectra of Co2FeSi0.6Al0.4 (at about 160 MHz) may be hidden in the broad signal. NMR allows to investigate the local environments of 59Co nuclei in the bulk of the film samples, and enables to determine the degree of order as well as possible existence of off-stoichiometry.Wurmehl and Kohlhepp (2008); Wurmehl et al. (2009)
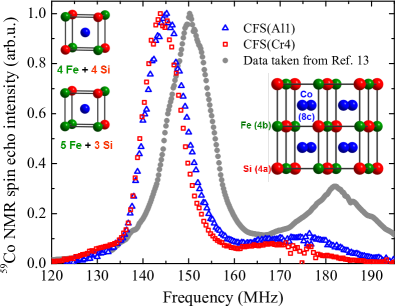
The 59Co NMR spectra measured on all samples (representatives are shown in Fig. 5) have a main line at around 145 MHz with one satellite on the high-frequency side. A similar 59Co NMR spectrum with high-frequency satellites was reported for off-stoichiometric Co2FeSi films (Ref. Wurmehl et al., 2009). In the present case, the average linewidths (7.99 MHz) are smaller than those reported in the previous data (11.8 MHz, Ref. Wurmehl et al., 2009), which already indicates a higher degree of order and smaller degree of off-stoichiometry in the present films. This interpretation is consistent with the overall shift of the main line (145 MHz) towards lower frequencies compared to previous NMR data on \CFS films (150 MHzWurmehl et al. (2009)), the main line of the Co2FeSi films now shifting towards the single NMR line observed for highly-ordered bulk Co2FeSi (139 MHz Blum et al. (2009)). The intensity of the high-frequency satellite lines is lower compared to the satellite lines presented in Ref. Wurmehl et al., 2009, indicating that the films investigated here are of much higher structural quality. The improved short range order of the L21 structure visible in the NMR parameters correlates with the improved long range order seen in the X-ray investigations, i.e. an increased intensity of the (111) ordering peak.
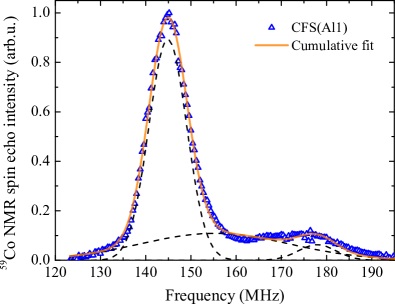
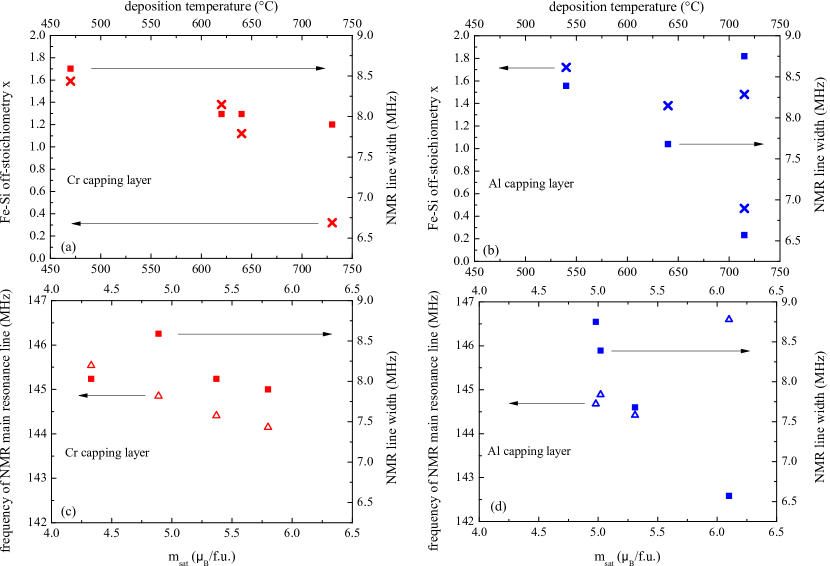
To quantitatively analyze the spectra we fitted them using a sum of Gaussian lines representing different numbers of Fe and Si next nearest neighbors in the first coordination shell of Co (compare Ref. Wurmehl et al., 2009). The representative fit of the \CFS(Al1) sample is shown in Fig. 6. However, the fit matches much better to the data if a third broad line is included. Interestingly, the resonance frequency of this broad line coincides with the one observed for the main line in Co2FeSi0.5Al0.5.Wurmehl et al. (2012) However, this line is observed for both types of capping layers, Al and Cr. This excludes the formation of Co2FeSi0.6Al0.4 as origin of the broad NMR line. We suggest the origin of the broad line to be strain within the film, induced by the substrate as explained in the following: The broad line has the same frequency and the same linewidth for all samples, the only difference is its relative contribution to the total spectrum, which slightly varies from sample to sample. The contribution of the broad line is stronger for thinner films, e.g. in the case of the 45 nm Cr-capped \CFS film the ratio between intensities of the broad line and the main line is , whereas in the case of the 75 nm thick Cr-capped \CFS film it is . This finding suggests that this broad contribution is probably from the so called “dead layer” near the substrate.Kallmayer et al. (2007) It is well known that there is a substantial difference between lattice parameters of the MgO substrate (4.21 Å = 5.95 Å) and \CFS (5.64 Å), which may yield a monotonous change in the structure of the Heusler film within a certain distance from the substrate. The factor is attributed to the rotation of the \CFS unit cell by 45∘ with respect to the MgO unit cell. The bulk of the film sample has an ideal structure with a slight amount of Fe-Si off-stoichiometry, represented by the parameter in Co2Fe1+xSi1-x. The values of in percent are listed in Table 1. All values were calculated by fitting a binomial distribution function to the relative areas of the NMR resonance lines, as discussed in detail in Ref. Wurmehl et al., 2009. Fig. 7 summarizes the relations between the different film characteristics (deposition temperature and saturation magnetization) and the results of the NMR analysis (linewidth, amount of off-stoichiometry and resonance frequency). For both types of capping layers, the amount of off-stoichiometry depends on the deposition temperature, specifically: the degree of off-stoichiometry decreases with increasing deposition temperature and hence with the degree of order (Fig. 7(a,b)). Generally, the NMR linewidth is also a good measure of the structural order of a system. Fig. 7 c,d demonstrate a clear correlation between the magnetic moment of a given film and the NMR linewidth. Samples prepared at higher deposition temperatures generally have a larger moment and smaller NMR linewidth, which is an indication of higher local order. In addition, there is a dependence of the resonance frequency of the main NMR line on the magnetic moment, samples with higher magnetic moment show a signal at lower frequencies, with the frequency closer to bulk \CFS (6 /f.u.). Such a trend is typically seen for NMR lines of Heusler compounds (compare Refs. Wurmehl et al., 2012 and Wójcik et al., 2012).
IV.1.5 XMCD of Si -edge
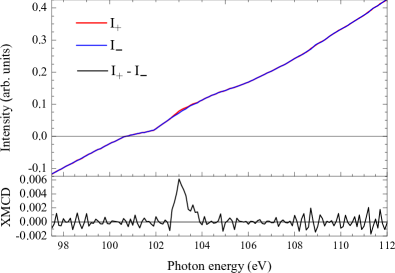
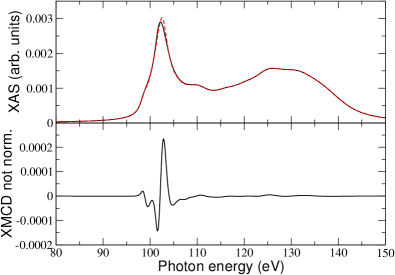
Although the total magnetization in \CFS is dominated by the large moments located at the Co and Fe atoms, it has been predicted Wurmehl et al. (2005) that a weak magnetic moment of ca. 0.13 (LSDA+U) is also induced at the Si atom with antiparallel orientation to the mean magnetization direction. The element-specific detection of this small magnetic moment remained a challenge because the Si - and -edges’ signals are extremely weak. Recently, Antoniak et al.Antoniak et al. (2012) showed the occurrence of an antiparallel Si moment of -0.01 in thin Fe3Si films using x-ray absorption at the Si -edge and at the Si edges. Here, we investigated \CFS by using a similar technique. Fig. 8 shows the XAS and XMCD data measured at the Si edges. We verified the result with field switching and polarization switching. In comparison to the data for Fe3Si the XAS is much less structured revealing only a smooth increase near 102 eV. The XMCD peak at 103 eV shows a maximum value. The strength of the signal is given by the ratio of the difference of the intensities , (0.006) and the value of the XAS spectra (0.1) at 103 eV (values are extracted from Fig. 8). With , we calculate an asymmetry of 6 %. Calculation was performed according to Ref. Antoniak et al., 2012. Notably, this value is about seven times larger than the value of 0.8 % obtained by Antoniak et al.Antoniak et al. (2012) As in the case of Fe3Si, we conclude from the positive asymmetry that the orientation of the Si moment is antiparallel to the mean magnetization, which is in agreement with the prediction in Ref. Wurmehl et al., 2005. Assuming that the size of the asymmetry scales with the magnetic moment we obtain an induced magnetic moment of -0.07 , which nicely agrees with our calculated value of Si total magnetic moment of -0.06 , (). As we probe Si p-states, the magnetization is induced to the hybridization of the magnetic 3d orbitals of the neighbors. Since we could not measure at the -edge we cannot conclude on the contribution from the orbital magnetic moment. Because the atomic structure in our case is cubic we may assume that the orbital moment contribution will be an order of magnitude smaller than the spin moment.
IV.2 Calculated results
IV.2.1 XMLD at the edges of Fe and Co
The calculation of adequate XMLD spectra at the Co and Fe edges of the full Heusler compound Co2FeSi is still a challenging task. Using different exchange-correlation functionals, or employing additional parameters such as the Hubbard , varying electronic structures can be obtained, leading to magnetic moments different from 6 as well as to different x-ray spectra. Recently, the so-called fixed-spin methodBlaha et al. (2001) has been employed to constrain the magnetic moment of Co2FeSi to the maximum measured value of 6 ; the electronic structure was then computed selfconsistently under this constraint.Meinert et al. (2012) However, it seems that the low lying bands exhibit a non-physical exchange splitting of 1 eV, see Fig. 6 of Ref. Meinert et al., 2012 (cf. Ref. Bombor et al., 2013). Another possibility to describe the high-spin electronic is to apply by the so-called Hubbard U technique with the self-interaction correctionAnisimov et al. (1993) and choose suitable parameters, i.e. (Co) = 4.8 eV and (Fe) = 4.5 eV (see Ref. Kallmayer et al., 2011).
Recent electronic structure investigations have shown that the observed fine structure at the edges is often not exactly reproduced by ab initio calculations, whereas the edges often show just a simple oscillation and here the agreement with the first-principles calculations is good.Nolting et al. (2010) The experimentally observed fine structure at at edge might stem from various, as yet unresolved origins. It might come from many-body effects or even be related to deficiencies of the sample.Nolting et al. (2010)
As the LSDA+ approach has given the best agreement between experimental and computed data, we employ here this approach. In Fig. 9 we show the computed normalized XMLD spectra for both Co and Fe atoms and for the magnetization directions parallel to [100] or to [110]. The positions of the calculated edges have been aligned to the experimental edge energy.
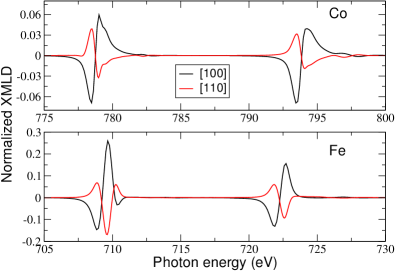
Certain differences between the experimental and calculated spectra can be noted. For magnetization parallel to [100] the calculated XMLD spectrum at the Co edge does not exhibit a fine structure in contrast to the measured spectra shown in Fig. 2. The calculations lack the drop (C) and the drop (D) on the high-energy side at the edge. For the edge the calculated XMLD spectrum exhibits a single oscillation with the same sign of the asymmetry of the two lobes as in the experiment, compare Fig. 9 and Fig. 2. For magnetization parallel to [110] the XMLD spectrum again exhibits a single oscillation at both the and edges as seen in the experiment having the correct asymmetry, i.e. the positive peak is higher in magnitude than the negative peak. Moreover, the sign of the Co XMLD is inverted under the change of the magnetization direction from [100] to [110], in agreement with the previous studyKallmayer et al. (2011) and with studies of the pure elements.Nolting et al. (2010); Legut (unpublished) This inversion of the XMLD spectrum appears as a consequence of the crystal-field splitting of the and states of the respective transition metal atom, with different states being sensitively probed for different magnetization directions.Kunes and Oppeneer (2003) We note that the XMLD spectra of Co in Fig. 4 of Ref. Meinert et al., 2012 obtained with the LSDA+U differ from ours by more fine structures at the and edges for both magnetization directions. However, it seems that we can reproduce such fine structures with calculations using the generalized gradient approximation with the Hubbard U technique (GGA+U) instead of LSDA+U, but for the very similar value of eV for the Co atom.
The calculated Fe XMLD spectrum has a three peak structure at the edge, whereas a single oscillation at the edge exists for both magnetization directions, which again are inverted when changing the magnetization orientation from [100] to [110]. The experimental spectra at the edge exhibit similar features for magnetization along [100], except for peak D (see Fig. 2 e). The main disagreement between calculations and experimental data is in the magnitude of the first negative peak. It seems that the best agreement between calculated and measured XMLD spectra is achieved for the spectrum shown in Fig. 2 f. However, still the D feature (positive shoulder on the high-energy side) is not reproduced in the calculation. This was observed also in Ref. Meinert et al., 2012, even when various approximations for the exchange-correlation term were used. The single oscillation in the XMLD spectrum at the edge for magnetization along [100] is well reproduced.
A poorer agreement between measured and calculated XMLD spectra is found for both the Fe edges for magnetization along [110]. Experimentally, a single oscillation is observed here, while in ours and other theoretical calculations,Meinert et al. (2012) a three peak structure is found. Also, our calculated results differ from those of Kallmayer et al.Kallmayer et al. (2011) For the edge again a single oscillation is computed, whereas experimentally predominantly a positive peak is detected, similar to Ref. Meinert et al., 2012; Kallmayer et al., 2011, and the negative peak is small. We ascribe this difference with Ref. Kallmayer et al., 2011 to recent improvement of our calculations of the dielectric tensor elements (complex linear response formula) and the present use of a more sophisticated multilayer model for describing the light-sample interaction (Fresnel theory using Višňovský’s formalismVišňovský (1991)) over the simpler approach used in Ref. Kallmayer et al., 2011.
The calculated XMLD spectra are about one order of magnitude larger than the experiment. This is understandable in the TEY experiment, as we do not account for any loss due to scattering within the sample. We have tested the effect of substrate (150 nm MgO) as well as 3 nm capping layer of Al or Cr, where in addition to the ab initio calculated Co2FeSi optical data, we adopted for the capping and substrate experimental data from the x-ray database.Henke et al. (1993) We found that none of those influence the spectra in the energy range of the Fe and Co -edges.
IV.2.2 XMCD at the edges of Si
Using the LSDA+U approach for the electronic structure of \CFS, we also calculated the XAS and XMCD at the edges of Si. The results are given in Fig. 10. The XMCD strength is calculated analog to section IV.1.5. From Fig. 10 at 103 eV we obtain . It means that XMCD is about 10 % of the XAS magnitude, which is in agreement with the experimental finding of 6 %. Note that experimental XMCD spectrum appears to exhibit a stronger broadening than the computed spectrum. The computed spectra only shows contribution from Si, whereas experimentally we see contribution from Co and Fe, which create a huge background signal due to the weak Si signal. We note that it is a general problem to subtract the background reliably. Consistent with the experiment, we find that an edge XMCD signal is not present. The calculated XMCD spectrum is overall similar in shape to that calculated for Si in Fe3Si by first-principles methods in Ref. Antoniak et al., 2012, except that here we do not obtain a negative peak at the high-energy side.
V Summary and Conclusion
In summary, magnetic properties of two series of \CFS films, one capped with Cr and the other with an Al layer, were investigated. Both series comprise four films, each exhibiting a different local order and varied saturation magnetization. A comparison of the recorded XMLD spectra revealed that the Al-capped films show large variations, whereas the Cr-capped series exhibit consistent features within the series. The XMLD spectra of a Co2FeSi0.6Al0.4 film showed similar features like Al-capped \CFS. Thus, an intermixing of Al atoms of the \CFS subsurface during deposition was assumed. This is a finding which needs to be considered carefully when making tunnel barriers for TMR devices, since it is important to have a stoichometric structure at the interface. For a systematic investigation, certain points were taken as a scale for the XMLD strength and the values were plotted versus the saturation magnetization of the films. An expected rise was noted for the Cr-capped \CFS series, whereas the Al-capped series showed no dependence. All samples show a clear dependence of the film quality on the deposition conditions, while the deposition temperature has the highest impact on the film quality. By increasing the deposition temperature the films are better ordered and furthermore the off-stoichiometry is reduced.
Comparison with ab initio calculated XMLD spectra showed an overall good agreement, however, certain differences remain. Whether these are due to the residual off-stoichiometry of the films or if further improvement of the calculation is needed is currently an open question. Experimentally, the feature-rich spectra of the Cr-capped samples change only qualitatively with disorder. This observation still needs to be reproduced in future calculations. The magnetic moment at the Si atom in \CFS could be detected with XMCD. A small magnetic contribution aligned antiparallel to the Co moments was observed, in agreement with ab initio calculations.
Acknowledgements.
We acknowledge support by DFG research group ASPIMATT DFG Ja821/5-1 and Graduate School of Excellence Materials Science in Mainz (MAINZ) - GSC266. We thank S. Cramm for support at BESSY. SW gratefully acknowledges funding by Deutsche Forschungsgemeinschaft DFG under the Emmy Noether programme in project WU595/3-1. DL acknowledges support within projects Reg. No. CZ.1.07/2.3.00/20.0074 and Reg. No. CZ.1.05/1.1.00/02.0070, both supported by Operational Programme ’Education for competitiveness’ funded by Structural Funds of the European Union and state budget of the Czech Republic. AK acknowledges DFG (Graduate School of Excellence Materials Science in Mainz (MAINZ) - GSC266).References
- Wolf et al. (2001) S. A. Wolf, D. D. Awschalom, R. A. Buhrman, J. M. Daughton, S. von Molnár, M. L. Roukes, A. Y. Chtchelkanova, and D. M. Treger, Science 294, 1488 (2001).
- de Groot et al. (1983) R. A. de Groot, F. M. Mueller, P. G. v. Engen, and K. H. J. Buschow, Phys. Rev. Lett. 50, 2024 (1983).
- Wurmehl et al. (2005) S. Wurmehl, G. H. Fecher, H. C. Kandpal, V. Ksenofontov, C. Felser, H.-J. Lin, and J. Morais, Phys. Rev. B 72, 1844341 (2005).
- Fecher et al. (2006) G. H. Fecher, H. C. Kandpal, S. Wurmehl, C. Felser, and G. Schönhense, J. Appl. Phys. 99, 08J106 (2006).
- Bombor et al. (2013) D. Bombor, C. G. F. Blum, O. Volkonskiy, S. Rodan, S. Wurmehl, C. Hess, and B. Büchner, Phys. Rev. Lett. 110, 066601 (2013).
- Kallmayer et al. (2011) M. Kallmayer, P. Klaer, H. Schneider, G. Jakob, H. J. Elmers, D. Legut, and P. M. Oppeneer, Phys. Rev. B 84, 054448 (2011).
- Kunes et al. (2004) J. Kunes, P. M. Oppeneer, S. Valencia, D. Abramsohn, H.-C. Mertins, W. Gudat, M. Hecker, and C. Schneider, J. Magn. Magn. Mater. 272-276, 2146 (2004).
- Meinert et al. (2012) M. Meinert, J.-M. Schmalhorst, M. Glas, G. Reiss, E. Arenholz, T. Böhnert, and K. Nielsch, Phys. Rev. B 86, 054420 (2012).
- Wurmehl and Kohlhepp (2008) S. Wurmehl and J. Kohlhepp, Topical review in J. Phys. D: Appl. Phys. 41, 173002 (2008).
- Panissod (1997) P. Panissod, in NATO ASI series High Tech, edited by V. G. Baryakhtar, P. E. Wigen, and N. A. Lesnik (Kluwer Academic, Dordrecht, 1997), vol. 48, p. 225.
- Blaha et al. (2001) P. Blaha, K. Schwarz, G. K. H. Madsen, D. Kvasnicka, and J. Luitz, An Augmented Plane Wave + Local Orbitals Program for Calculating Crystal Properties, Techn. Univ. Wien, Austria (2001).
- Perdew and Wang (1992) J. P. Perdew and Y. Wang, Phys. Rev. B 45, 13244 (1992).
- Perdew et al. (1996) J. P. Perdew, K. Burke, and M. Ernzerhof, Phys. Rev. Lett. 77, 3865 (1996).
- Anisimov et al. (1993) V. I. Anisimov, I. V. Solovyev, M. A. Korotin, M. Czyzyk, and G. A. Sawatzky, Phys. Rev. B 48, 16929 (1993).
- Kunes and Oppeneer (2003) J. Kunes and P. M. Oppeneer, Phys. Rev. B 67, 024431 (2003).
- Višňovský (1991) Š. Višňovský, Czech. J. Phys. 41, 663 (1991).
- Schneider et al. (2006) H. Schneider, G. Jakob, M. Kallmayer, H. J. Elmers, M. Cinchetti, B. Balke, S. Wurmehl, C. Felser, M. Aeschlimann, and H. Adrian, Phys. Rev. B 74, 174426 (2006).
- Telling et al. (2006) N. D. Telling, P. S. Keatley, G. van der Laan, R. J. Hicken, E. Arenholz, Y. Sakuraba, M. Oogane, Y. Ando, and T. Miyazaki, Phys. Rev. B 74, 224439 (2006).
- Klaer et al. (2009) P. Klaer, M. Kallmayer, C. G. F. Blum, T. Graf, J. Barth, B. Balke, G. H. Fecher, C. Felser, and H. J. Elmers, Phys. Rev. B 80, 144405 (2009).
- Elmers et al. (2003) H. J. Elmers, G. H. Fecher, D. Valdaitsev, S. A. Nepijko, A. Gloskovskii, G. Jakob, G. Schönhense, S. Wurmehl, T. Block, C. Felser, et al., Phys. Rev. B 67, 104412 (2003).
- Zabel (2006) H. Zabel, materialstoday 9, 42 (2006).
- Kallmayer et al. (2007) M. Kallmayer, H. Schneider, G. Jakob, H. J. Elmers, B. Balke, and S. Cramm, J. Phys. D: Appl. Phys 40, 1552 (2007).
- Wurmehl et al. (2009) S. Wurmehl, J. Kohlhepp, H. Swagten, B. Koopmans, C. Blum, V. Ksenofontov, H. Schneider, G. Jakob, D. Ebke, and G. Reiss, J. Phys. D: Appl. Phys. 42, 084017 (2009).
- Blum et al. (2009) C. G. F. Blum, K. Jenkins, J. Barth, C. Felser, S. Wurmehl, G. Friemel, C. Hess, G. Behr, B. Büchner, S. Riegg, et al., Appl. Phys. Lett. 95, 161903 (2009).
- Wurmehl et al. (2012) S. Wurmehl, J. Kohlhepp, H. Swagten, and B. Koopmans, J. Appl. Phys. 111, 043903 (2012).
- Wójcik et al. (2012) M. Wójcik, E. Jedryka, H. Sukegawa, T. Nakatani, and K. Inomata, Phys. Rev. B 85, 100401 (2012).
- Antoniak et al. (2012) C. Antoniak, H. C. Herper, Y. N. Zhang, A. Warland, T. Kachel, F. Stromberg, B. Krumme, K. Weis, C. Fauth, W. Keune, P. Entel, et al., Phys. Rev. B 85, 214432 (2012).
- Nolting et al. (2010) F. Nolting, D. Legut, J. Rusz, P. M. Oppeneer, G. Woltersdorf, and C. H. Back, Phys. Rev. B 82, 184415 (2010).
- Legut (unpublished) D. Legut (unpublished).
- Henke et al. (1993) B. L. Henke, E. M. Gullikson, and J. C. Davis, At. Data and Nucl. Data Tables 54, 181 (1993).