MOND and IMF variations in early-type galaxies from ATLAS3D
Abstract
MOdified Newtonian dynamics (MOND) represents a phenomenological alternative to dark matter (DM) for the missing mass problem in galaxies and clusters of galaxies. We analyze the central regions of a local sample of early-type galaxies from the ATLAS3D survey, to see if the data can be reproduced without recourse to DM. We estimate dynamical masses in the MOND context through Jeans analysis, and compare to ATLAS3D stellar masses from stellar population synthesis. We find that the observed stellar mass–velocity dispersion relation is steeper than expected assuming MOND with a fixed stellar initial mass function (IMF) and a standard value for the acceleration parameter . Turning from the space of observables to model space, a) fixing the IMF, a universal value for cannot be fitted, while, b) fixing and leaving the IMF free to vary, we find that it is “lighter” (Chabrier-like) for low-dispersion galaxies, and “heavier” (Salpeter-like) for high dispersions. This MOND-based trend matches inferences from Newtonian dynamics with DM, and from detailed analysis of spectral absorption lines, adding to the converging lines of evidence for a systematically-varying IMF.
keywords:
galaxies: evolution – galaxies: general – galaxies: elliptical and lenticular, cD.1 Introduction
Flat rotation curves in spiral galaxies (Rubin & Ford 1970), dynamics and gravitational lensing in early-type galaxies (ETGs; ellipticals and lenticulars), and in clusters of galaxies (Romanowsky et al. 2003; Bradač et al. 2008; Napolitano et al. 2009; Tortora et al. 2010; Napolitano et al. 2011) are usually modelled using the classical Newtonian theory of gravity. In this context, vast amounts of dark matter (DM) are inferred, in consonance with the standard cosmology (e.g., Hinshaw et al. 2012), and with the modern understanding of galaxy evolution as seeded by the collapse of DM haloes (e.g., De Lucia et al. 2006).
Unfortunately, the nature of DM is still not clear, with no direct experimental detection of DM particles. In this context, it should be recalled that Newtonian dynamics has never been experimentally tested in the extremely weak-field limit as in the outskirts of galaxies. An alternative phenomenological framework was proposed by Milgrom (1983a, b), in which Newton’s second law of dynamics becomes , where the acceleration is related to the Newtonian one by . Here, is an universal constant and is an arbitrary function with the limiting behaviours and .
This model, referred to as MOdified Newtonian Dynamics (MOND), reproduces the flat rotation curves of spiral galaxies without recourse to undetectable DM, and provides a natural explanation for the observed relation between galaxy rotation and luminosity (Tully & Fisher, 1977; Sanders & McGaugh, 2002) or baryonic mass (McGaugh 2012). Thirty years after its introduction, MOND remains remarkably successful on galaxy scales, but the conclusions to date have been largely based on late-type galaxies. Only a few analyses have been carried out on ETGs (e.g., Cardone et al. 2011; Ferreras et al. 2012; Milgrom 2012), and it is not clear if they can be integrated consistently into the MOND framework.
The difficulty with ETGs has been the lack of a large, homogeneous sample with high-quality dynamical analysis. These criteria are not yet met for the ideal case where kinematical data extend to large radii, but the advent of the ATLAS3D survey (Cappellari et al., 2011) entails a remarkable opportunity to test MOND in the centers of ETGs.
ATLAS3D provides a sample of 260 local ETGs with central masses estimated both by dynamics and by stellar population synthesis (SPS). The latter aspect is critical since the stars comprise the dominant component of the central mass, even in models with DM included. However, standard SPS modelling is hindered by the uncertain stellar initial mass function (IMF), and the ATLAS3D team have taken a purely dynamical approach, where the total mass is decomposed into stars and DM, assuming Newtonian gravity and standard DM halo models. The resulting stellar masses imply strong variations in the IMF, in agreement with many recent studies (Conroy & van Dokkum 2012; Cappellari et al. 2012, 2013a; Spiniello et al. 2012; Dutton et al. 2013; Ferreras et al. 2013; Goudfrooij & Kruijssen 2013; La Barbera et al. 2013; Tortora et al. 2013; Weidner et al. 2013).
Our aim in this paper is to revisit the ATLAS3D results in the context of MOND. Can the central dynamics of ETGs be reproduced with MOND and a standard, fixed IMF? Alternatively, is MOND consistent with current claims for a variable IMF? The dynamical approach we adopt provides an estimate for the IMF ”normalization”, which we cannot unambiguously relate to the slope of the bottom- or top-end of the IMF. Throughout the present paper and in agreement with other works we will interpret our results in terms of variations in the fraction of low-mass stars.
2 Methods
We perform our analysis on a sample of local ETGs from the ATLAS3D survey (Cappellari et al. 2013b, a). About 15% of the full sample have significant gradients of the stellar mass-to-light ratio () implied by their young stellar populations (H equivalent width greater than 2.3 Å), so we omit these cases and retain a sample of 224 galaxies.
The relevant data for each galaxy include a) the effective radius, , b) the projected stellar velocity dispersion, , within a circularized aperture of radius , the -band c) total luminosity and d) stellar () derived by SPS fitting of the spectra with Vazdekis et al. (2012) models and a Salpeter (1955) IMF. The Chabrier (2001) IMF yields stellar masses that are dex smaller.
It is important to note that the published and values are not self-consistent. The former correspond to detailed multi-gaussian expansion (MGE) fits that extend to typically 4 . The latter are the MGE-based values renormalized by a factor of 1.35 to correspond to more conventional estimates from the literature. Here we will use these values, but adjust each value such that the projected luminosity inside for our adopted de Vaucouleurs model is the same as in the original MGE model. This extrapolation means is typically increased by a factor of .
The basic assumptions of MOND are as follows.
-
1.
Standard dynamics is not valid in the limit of low accelerations, such that the gravitational acceleration differs from the Newtonian one , where is the total mass involved (DM + stars). The MONDian reduces to the Newtonian one at high accelerations.
-
2.
In the low-acceleration limit, the acceleration is given by , where is the MOND acceleration constant. Thanks to this limit the rotation curves are flat and it is possible to recover the Tully & Fisher (1977) relation.
- 3.
To connect the low- and high-acceleration regimes, a general formula is needed, which reduces to the low-acceleration limit as in (ii). The following expression is adopted:
| (1) |
where is an empirical “interploating” function, with the properties and . One recovers the Newtonian theory when and the deep MOND regime when . We adopt the following expressions: a) our reference choice (Famaey & Binney 2005; Angus 2008) and b) , which was the first one successfully tested (Sanders & McGaugh 2002).
Our dynamical approach is based on the spherical Jeans equations, relating the acceleration to the mass as follows:
| (2) |
where is the deprojected luminosity profile, is the radial velocity dispersion and is the velocity dispersion anisotropy (e.g., Sanders 2000; Cardone et al. 2011). We adopt isotropic models (i.e. ) as our default, but we will also examine the impact of anisotropy.
We assume no DM, thus (from SPS) and . We approximate the deprojected de Vaucouleurs profile with an analytic expression from Prugniel & Simien (1996). Assuming that is constant with radius, the mass density profile is and the mass profile is easily derived (see Cardone et al. 2011). Thus, in Eq. (2), , and and are given and can be derived by simple integration. Finally, to match the observed aperture averaged velocity dispersion , we project along the line of sight and within a circular aperture (see Mamon & Łokas 2005a, b; Tortora et al. 2009).
3 Results
3.1 Faber–Jackson relation
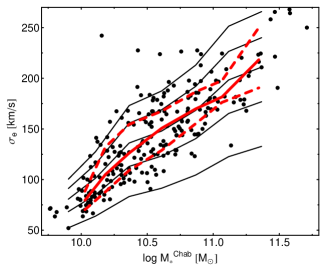
We begin with vanilla MOND-modelling assumptions of fixed and IMF, and investigate how well a critical observable is reproduced: the relation between stellar mass and velocity dispersion (Faber & Jackson 1976). We compare the ATLAS3D observations with predictions from Jeans equations, where we have adopted the median – relation from the observations, fixed to the standard value and assumed a varying IMF, parameterized in terms of the “IMF mismatch parameter” . The latter relates the dynamical to the values from SPS modelling with a fixed Milky-Way type IMF, , assumed as a Chabrier IMF (Tortora et al., 2013). We see in Fig. 1 that at low masses the data are less scattered and MOND with a Chabrier IMF ( line) predicts values that agree on average with the ATLAS3D observations. At higher masses, the are underpredicted by a factor of 1.5 on average, and require a bottom-heavier IMF for a good match.
Our initial impression from this simple check is that MOND is discordant with a universal IMF. However, there are additional correlations with to consider which would require a thorough analysis of the fundamental plane (cf. Dutton et al. 2013). We will instead turn from the space of observables to model space, where we adjust the input parameters in order to better fit the data. We also notice that the IMF variation is mild if considered in terms of stellar mass, while in the following we will discuss the variable IMF scenario in terms of (Tortora et al. 2013).
3.2 The acceleration scale
Our first exercise in model fitting is to consider an alternative value of the universal constant , thus allowing for relative systematics between late-type and early-type galaxy modelling. We treat as a free parameter for each of the ATLAS3D galaxies, where the goal is to see if the ensemble of estimates scatters around a single consensus value.
Fig. 2 shows the results, where the galaxies have been placed in some bins of . Assuming a Chabrier IMF (top panel), we find that on average, the galaxies are fitted with , larger than the standard value of . This is too large a difference to attribute to errors, and we conclude that MOND requires more mass in the central parts of ETGs. Smaller values are found if we assume a Kroupa (2001) IMF (middle panel). If we instead adopt a Salpeter IMF (bottom panel), we indeed find that, on average, is found. For a large fraction of galaxies the inferred values are very small, departing from the standard value by several orders of magnitudes and approaching Newtonian gravity. However, this is not the whole story, as there is a residual trend for to increase with (for both choices of ). Since again, is meant to be a universal constant, we conclude that MOND is incompatible with a universal IMF, and we next examine IMF variations.

3.3 The variable IMF scenario
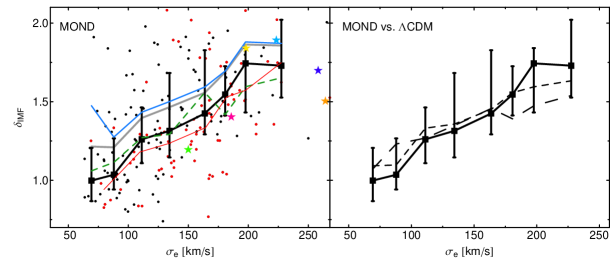
We now return to fixing to its standard value, and instead allow to vary on a galaxy-by-galaxy basis in order for MOND to fit the data. The results are discussed in terms of the IMF mismatch, , and plotted as a function of in Fig. 3. Assuming , there is a striking systematic variation from (Chabrier-like) for the lowest- galaxies, to (near-Salpeter) at the highest . With an alternative interpolating formula, , the MONDian effects are weaker and the implied values are slightly higher, but the trend with remains. The results are also unchanged if the high quality data are adopted (see red line in Fig. 3 for ).
Another piece of information is given by comparison with the results from a constant- model with no DM within a Newtonian scenario (see purple line in the left panel of Fig. 3). The only difference with the MOND models is the change of the gravity theory. This model gives values which are, on average, dex larger than the MOND results using , and quite similar to the ones using , suggesting that gives a very tiny modification of the gravity. We conclude that MOND requires a strong IMF variation in order to be consistent with the ATLAS3D data.
Our dynamical models are limited in their assumptions of sphericity and isotropy. We explore radially anisotropic models with values of , which produce elevated values but only enough to reduce by 10%. The general effect of galaxy flattening would be for a spherical model to over- and under-estimate the mass when a galaxy is edge-on and face-on, respectively. We have analyzed a relatively face-on subsample by selecting only the roundest galaxies (ellipticity at of ). The ensuing reduction in is very weak, and does not negate the trend with .
As a final check, we make use of the self-consistent “JAM” dynamical modelling results, , from Cappellari et al. (2013b), which assume that mass follows the light and include flattening, anisotropy and more detailed luminosity profiles. Although these models were constructed using Newtonian dynamics, we exploit the general insensitivity of the inferred circular velocities to the details of the mass profile shapes (e.g., Cappellari et al. 2013b), and use the results as a fair approximation for what MOND predictions would be in a fully self-consistent dynamical model. Given a stellar mass as estimated from SPS, and the associated Newtonian acceleration , the corresponding acceleration predicted by MOND for our default interpolating function is (Kroupa et al. 2010). After algebraic manipulation, we find
| (3) |
where is the apparent dynamical for an observer who interprets observations with Newtonian dynamics, and is the stellar for a fixed Milky-Way (Chabrier) IMF. Given the standard value for , setting , and calculating all the quantities at , we estimate on a galaxy-by-galaxy basis. As shown in the left panel of Fig. 3, the results are very similar to ours using direct, spherical isotropic MOND models. We conclude that the MONDian IMF variation is robust to the details of the dynamical models.
3.4 Comparison to CDM
It is now interesting to compare our MOND-based results with those we obtain within a standard Newtonian scenario. Following Tortora et al. (2013) we adopt an alternative model accounting for a DM halo. It is based on a Navarro et al. (1996) profile for the DM distribution plus a de Vaucouleurs (1948) profile for the stars. For the virial mass and concentration (, ), we adopt mean trends for a WMAP5 cosmology (Macciò et al., 2008), while for the – relation we used Moster et al. (2010). Interestingly, our result for is fully consistent with the NFW+stars model and thus with the CDM expectations (short-dashed line in the right panel of Fig. 3). This suggests that CDM and MOND are functionally equivalent.
Finally, to illustrate the level of systematic uncertainties for a method, we have also plotted in the right panel of Fig. 3 the medians for the DM case (almost similar to our NFW+stars model) from the results obtained by the Jeans anisotropic models in Cappellari et al. (2013a) (see their Table 1). The agreement is very good.
4 Conclusions
We have analyzed the dynamical properties of a sample of ETGs from the ATLAS3D survey within a MONDian framework. We have performed a Jeans analysis of the observed velocity dispersions and discussed the results in terms of the MOND recipe details and IMF.
As a preliminary analysis, we have discussed how the observed Faber & Jackson (1976) relation can be reproduced by MOND, for fixed and IMF (see Fig. 1). Although not conclusive, we find hints of non-universality of or IMF.
Thus, we determined for different choices of the IMF, finding a trend with (Fig. 2), but since is meant to be a universal constant of the theory, we conclude that MOND is incompatible with a universal IMF. To quantify this result we have fixed to its standard value and allowed to vary.
Following previous literature we focus on the mismatch relative to a Chabrier IMF, . Consistently with analysis involving spectral features (Conroy & van Dokkum 2012; Ferreras et al. 2013) or dynamical and lensing analysis within a Newtonian scenario (Auger et al. 2010; Treu et al. 2010; Cappellari et al. 2013a; Tortora et al. 2012, 2013) we demonstrate that within a MOND framework a strong IMF variation is required (Fig. 3). We find a bottom-lighter IMF at low- and bottom-heavier at large . Some differences are found in terms of the interpolating function: gives values which are fully consistent with CDM predictions, while assuming the gravity is only weakly modified, such that the values are consistent with what is found assuming a constant- profile with no DM.
Further investigations involving combined dynamical/lensing or extended kinematical data in ETGs are necessary to probe the galactic dynamics to their outskirts, where the stellar mass density is low and the dynamics modification is more important. Probing different regions of the gravitational potential, we can provide clearer constraints on the velocity dispersion anisotropy, the interpolating function and the IMF within a Newtonian scenario as well as in MOND or different modified gravity theories (Napolitano et al. 2012). Further analysis will investigate a more general interpolating function, , and test whether any combination of parameters can remove the IMF trends. Finally, to have a fully consistent MONDian picture, one can test whether the varying IMF scenario can ease MOND tensions in the centers of clusters (Angus et al. 2010) and in gravitational lenses (Ferreras et al. 2012) with the help of a bottom-heavier IMF, and in the very low mass dSph galaxies in the Local group (Kroupa et al. 2010), by the adoption of a top-heavier IMF.
Acknowledgments
We thank the referee for the fruitful comments. We also thank M. Cappellari and P. Kroupa for helpful discussions. CT was supported by the Swiss National Science Foundation and the Forschungskredit at the University of Zurich. CT has received funding from the European Union Seventh Framework Programme (FP7/2007-2013) under grant agreement n. 267251.
References
- Angus (2008) Angus G. W., 2008, MNRAS, 387, 1481
- Angus et al. (2010) Angus G. W., Famaey B., Diaferio A., 2010, MNRAS, 402, 395
- Auger et al. (2010) Auger M. W., Treu T., Gavazzi R., Bolton A. S., Koopmans L. V. E., Marshall P. J., 2010, ApJ, 721, L163
- Begeman et al. (1991) Begeman K. G., Broeils A. H., Sanders R. H., 1991, MNRAS, 249, 523
- Bradač et al. (2008) Bradač M., Allen S. W., Treu T., Ebeling H., Massey R., Morris R. G., von der Linden A., Applegate D., 2008, ApJ, 687, 959
- Cappellari et al. (2011) Cappellari M. et al., 2011, MNRAS, 413, 813
- Cappellari et al. (2012) Cappellari M. et al., 2012, Nature, 484, 485
- Cappellari et al. (2013a) Cappellari M. et al., 2013a, MNRAS, 432, 1862
- Cappellari et al. (2013b) Cappellari M. et al., 2013b, MNRAS, 432, 1709
- Cardone et al. (2011) Cardone V. F., Angus G., Diaferio A., Tortora C., Molinaro R., 2011, MNRAS, 412, 2617
- Chabrier (2001) Chabrier G., 2001, ApJ, 554, 1274
- Conroy & van Dokkum (2012) Conroy C., van Dokkum P. G., 2012, ApJ, 760, 71
- De Lucia et al. (2006) De Lucia G., Springel V., White S. D. M., Croton D., Kauffmann G., 2006, MNRAS, 366, 499
- de Vaucouleurs (1948) de Vaucouleurs G., 1948, Annales d’Astrophysique, 11, 247
- Dutton et al. (2013) Dutton A. A., Macciò A. V., Mendel J. T., Simard L., 2013, MNRAS, 432, 2496
- Faber & Jackson (1976) Faber S. M., Jackson R. E., 1976, ApJ, 204, 668
- Famaey & Binney (2005) Famaey B., Binney J., 2005, MNRAS, 363, 603
- Ferreras et al. (2013) Ferreras I., La Barbera F., de la Rosa I. G., Vazdekis A., de Carvalho R. R., Falcón-Barroso J., Ricciardelli E., 2013, MNRAS, 429, L15
- Ferreras et al. (2012) Ferreras I., Mavromatos N. E., Sakellariadou M., Yusaf M. F., 2012, Phys. Rev. D, 86, 083507
- Goudfrooij & Kruijssen (2013) Goudfrooij P., Kruijssen J. M. D., 2013, ApJ, 762, 107
- Hinshaw et al. (2012) Hinshaw G. et al., 2012, ArXiv e-prints
- Kroupa (2001) Kroupa P., 2001, MNRAS, 322, 231
- Kroupa et al. (2010) Kroupa P. et al., 2010, A&A, 523, A32
- La Barbera et al. (2013) La Barbera F., Ferreras I., Vazdekis A., de la Rosa I. G., de Carvalho R. R., Trevisan M., Falcón-Barroso J., Ricciardelli E., 2013, MNRAS, 433, 3017
- Macciò et al. (2008) Macciò A. V., Dutton A. A., van den Bosch F. C., 2008, MNRAS, 391, 1940
- Mamon & Łokas (2005a) Mamon G. A., Łokas E. L., 2005a, MNRAS, 362, 95
- Mamon & Łokas (2005b) Mamon G. A., Łokas E. L., 2005b, MNRAS, 363, 705
- McGaugh (2012) McGaugh S. S., 2012, AJ, 143, 40
- Milgrom (1983a) Milgrom M., 1983a, ApJ, 270, 371
- Milgrom (1983b) Milgrom M., 1983b, ApJ, 270, 365
- Milgrom (2012) Milgrom M., 2012, Physical Review Letters, 109, 131101
- Moster et al. (2010) Moster B. P., Somerville R. S., Maulbetsch C., van den Bosch F. C., Macciò A. V., Naab T., Oser L., 2010, ApJ, 710, 903
- Napolitano et al. (2012) Napolitano N. R., Capozziello S., Romanowsky A. J., Capaccioli M., Tortora C., 2012, ApJ, 748, 87
- Napolitano et al. (2011) Napolitano N. R. et al., 2011, MNRAS, 411, 2035
- Napolitano et al. (2009) Napolitano N. R. et al., 2009, MNRAS, 393, 329
- Navarro et al. (1996) Navarro J. F., Frenk C. S., White S. D. M., 1996, ApJ, 462, 563
- Prugniel & Simien (1996) Prugniel P., Simien F., 1996, A&A, 309, 749
- Romanowsky et al. (2003) Romanowsky A. J., Douglas N. G., Arnaboldi M., Kuijken K., Merrifield M. R., Napolitano N. R., Capaccioli M., Freeman K. C., 2003, Science, 301, 1696
- Rubin & Ford (1970) Rubin V. C., Ford, Jr. W. K., 1970, ApJ, 159, 379
- Salpeter (1955) Salpeter E. E., 1955, ApJ, 121, 161
- Sanders (2000) Sanders R. H., 2000, MNRAS, 313, 767
- Sanders & McGaugh (2002) Sanders R. H., McGaugh S. S., 2002, ARA&A, 40, 263
- Spiniello et al. (2012) Spiniello C., Trager S. C., Koopmans L. V. E., Chen Y. P., 2012, ApJ, 753, L32
- Tortora et al. (2012) Tortora C., La Barbera F., Napolitano N. R., de Carvalho R. R., Romanowsky A. J., 2012, MNRAS, 425, 577
- Tortora et al. (2009) Tortora C., Napolitano N. R., Romanowsky A. J., Capaccioli M., Covone G., 2009, MNRAS, 396, 1132
- Tortora et al. (2010) Tortora C., Napolitano N. R., Romanowsky A. J., Jetzer P., 2010, ApJ, 721, L1
- Tortora et al. (2013) Tortora C., Romanowsky A. J., Napolitano N. R., 2013, ApJ, 765, 8
- Treu et al. (2010) Treu T., Auger M. W., Koopmans L. V. E., Gavazzi R., Marshall P. J., Bolton A. S., 2010, ApJ, 709, 1195
- Tully & Fisher (1977) Tully R. B., Fisher J. R., 1977, A&A, 54, 661
- Vazdekis et al. (2012) Vazdekis A., Ricciardelli E., Cenarro A. J., Rivero-González J. G., Díaz-García L. A., Falcón-Barroso J., 2012, MNRAS, 3156
- Weidner et al. (2013) Weidner C., Ferreras I., Vazdekis A., La Barbera F., 2013, MNRAS, 435, 2274