Orbital magnetic moment and coercivity of SiO2-coated FePt nanoparticles studied by x-ray magnetic circular dichroism
Abstract
We have investigated the spin and orbital magnetic moments of Fe in FePt nanoparticles in the 10-ordered phase coated with SiO2 by x-ray absorption spectroscopy (XAS) and x-ray magnetic circular dichroism (XMCD) measurements at the Fe absorption edges. Using XMCD sum rules, we evaluated the ratio of the orbital magnetic moment () to the spin magnetic moment () of Fe to be = 0.08. This value is comparable to the value (0.09) obtained for FePt nanoparticles prepared by gas phase condensation, and is larger than the values (0.05) obtained for FePt thin films, indicating a high degree of 10 order. The hysteretic behavior of the FePt component of the magnetization was measured by XMCD. The magnetic coercivity () was found to be as large as 1.8 T at room temperature, 3 times larger than the thin film value and 50 times larger than that of the gas phase condensed nanoparticles. The hysteresis curve is well explained by the Stoner-Wohlfarth model for non-interacting single-domain nanoparticles with the distributed from 1 T to 5 T.
pacs:
78.20.Ls, 75.60.-d, 75.50.Bb, 75.75.FkThe 10-ordered alloy FePt has attracted great attention as
a material to be used in high-density storage memory devices because
FePt possesses a high magneto-crystalline anisotropy in bulk FePt and
thin films
Ivanov et al. (1973); Okamoto et al. (2002); Seki et al. (2006a, 2008). In
order to increase the storage density of memory devices, FePt
nanoparticles are promising materials. FePt nanoparticles prepared by
the gas phase preparation method Dmitrieva et al. (2006) and
the wet chemical preparation method Yamamoto et al. (2006),
however, have the fcc structure, in which magneto-crystalline anisotropy
disappears. By annealing the nanoparticles at high temperatures, one can
transform the structure from the fcc to 10, but then the
nanoparticles are easily oxidized and are covered by surface oxides. The plasma treatments of FePt nanoparticles followed by in situ flight
annealing have been performed to remove
the oxidized surfaces Boyen et al. (2005); Dmitrieva et al. (2007), however, it has simultaneously reduced the magnetic coercivity
() as small as 0.038 T Dmitrieva et al. (2007). In addition, high temperature annealing is difficult to implement in
existing manufacturing process because it may lead to the coalescence of
nanoparticles into larger particles
Yamamoto et al. (2005). Recently, in order to overcome such
difficulties, FePt nanoparticles coated with SiO2 were prepared and
dispersed before annealing to achieve a high degree of 10 order
Morimoto et al. (2006); Tamada et al. (2006, 2007a, 2007b); Yamamoto et al. (2005, 2006). FePt
nanoparticles prepared by this method have a as
large as 1.85 T at 300 K Yamamoto et al. (2005), of the same
order as the value of 3.0 T
observed for
10-FePt (001) particulate films Wang et al. (2009), and
much larger than the bulk value of 0.16 T Tanaka et al. (1997), the thin
film value of 0.55 T Seki et al. (2008), and the value of 0.75 T
for microfabricated FePt (001) dots Wang et al. (2008).
In order to understand the origin of the large and
to further improve the properties of the SiO2-coated FePt
nanoparticles, microscopic information about the magnetism such as the
orbital magnetic moment is important. The chemical state of Fe can be easily distinguished by soft x-ray absorption spectroscopy (XAS), and the orbital and spin magnetic moments of
transition-metal 3 orbitals can be measured by soft x-ray magnetic
circular dichroism (XMCD) measurements of the 2 core level of the
transition element Thole et al. (1992). Furthermore, in XMCD
measurements, one can eliminate extrinsic magnetic signals such as those
from oxidized Fe and those from the
diamagnetic SiO2 coating. In the present work, we have applied the
XAS and XMCD techniques to the SiO2-coated FePt nanoparticles to characterize
their magnetic properties from the microscopic level.
FePt nanoparticle samples were prepared by the wet chemical
method. Precursor fcc FePt nanoparticles were prepared according to the
method of Sun et al. Sun et al. (2000), and were
subsequently coated by SiO2 according to the method of Fan et
al. Fan et al. (2004). Thus during the heat treatment
thermal diffusion of Fe and Pt atoms was confined inside the SiO2
nanoreactor. For details of the fabrication process, we refer the reader
to Yamamoto et al. Yamamoto et al. (2005). For the
XMCD measurements, the nanoparticle samples were supported by silver
paste on a sample holder. After the preparation of the samples, they
were kept in an Ar atmosphere in order to prevent oxidation until the
XMCD measurements. XAS [=()/2] and
XMCD (=) spectra were obtained at the helical
undulator beam line BL23SU of SPring-8. Here, and
are XAS spectra taken with the light helicity parallel and antiparallel
to the incident photon direction, respectively. The highest applied
magnetic field was 9 T. The measurements were done under an ultra-high
vacuum of Pa. The polarity of the synchrotron
radiation was switched at each photon energy using a kicker magnet with
the frequency of 1 Hz Saitoh et al. (2012). The measurements were done at room
temperature (300 K) in the total electron yield (TEY) mode. The
magnetic field dependence of the XMCD intensity at the peak of the Fe
edge was measured in the range of .
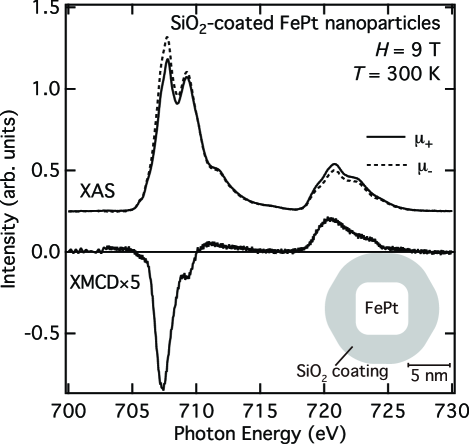
Figure 1 shows the XAS and XMCD spectra at the Fe edges of
the FePt nanoparticles. All the spectra have been normalized to the
XAS peak intensity. Unlike the Fe spectra of FePt by Boyen et al.
Boyen et al. (2005) and Dmitrieva et al. Dmitrieva et al. (2007), each of the and
edges exhibits a doublet structure: The doublet
peaks are located at 707.7 eV and 709.3 eV, and the ones at
720.8 eV and 722.7 eV. Furthermore, broad shoulder/tail structures are
observed on the high-energy side of the peak from 710 eV to
717 eV and on the high-energy side of the peak from 722 eV
to 730 eV. We consider that the origin of the doublets is overlapping
signals of FePt (at 707.7 and 720.8 eV) and Fe oxides (at 709.3 and
722.7 eV). The oxides are most likely extrinsic Fe3+ oxides formed at the surface
of bare FePt particles whose SiO2-coating was removed when grinding
the sample into fine powders, as one can see from the TEM picture [shown
in Fig. 2(b) of Yamamoto et al.
Yamamoto et al. (2005)]. We tentatively attribute the
shoulder/tail structures to the charge-transfer 2-
satellite of the Fe3+ oxide Crocombette et al. (1995) but the exact origin of the structure remains to be clarified. On the other hand, the lineshape of the experimental XMCD
spectrum in Fig. 1 is almost identical to that of FePt by Dmitrieva et al. Dmitrieva et al. (2007) except
for a small negative peak around 709 eV, indicating that contributions of the Fe
oxides to the XMCD spectrum are small.
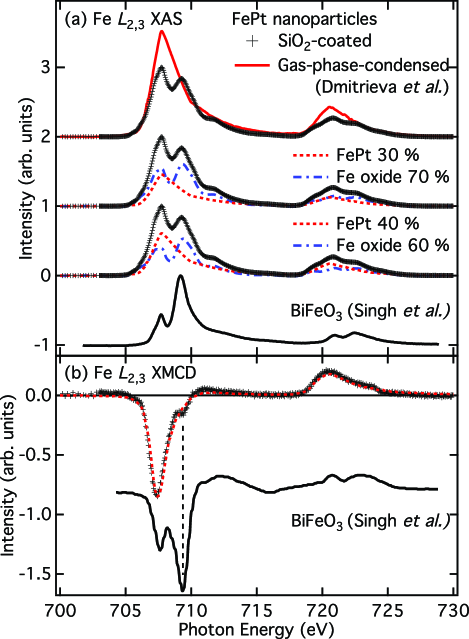
In order to estimate signals of the Fe oxides, we first subtracted the FePt XAS spectrum reported by Dmitrieva et
al. Dmitrieva et al. (2007), where Fe oxide was completely removed by plasma treatment, from the
experimental one. In Fig. 2(a), one can see that after having
subtracted the FePt XAS spectrum multiplied by 0.4, the spectral lineshape became similar to
that of BiFeO3, where the Fe3+ ion is located at the site Singh et al. (2013),
shown in the bottom of Fig. 2(a).
Thus the intrinsic signals from FePt are estimated to be 40 % of the
total Fe XAS intensity. The experimental XMCD spectrum at
the Fe edges of the FePt nanoparticles is shown in Fig. 2(b). The lineshape of the XMCD
spectrum of FePt nanoparticles prepared by the gas condensation method by Dmitrieva et al. Dmitrieva et al. (2007)
is also shown by a dotted curve. Unlike the XAS spectra, both XMCD data agree with each other except for the small negative
peak around 709 eV in the present sample. From comparison of the
present XMCD spectrum with the XMCD spectrum of BiFeO3 shown at the
bottom of Fig. 2(b), the small negative peak can be attributed to a peak of a Fe3+ oxide. After having removed the Fe-oxide contributions from the experimental
XAS and XMCD spectra, we applied
the XMCD sum rules Carra et al. (1993); Thole et al. (1992)
and obtained the spin moment = 1.4 , the orbital moment = 0.12 , and their ratio / = 0.08. These values are
summarized in Table 1, and are compared with those of different
kinds of FePt samples Dmitrieva et al. (2007); Imada et al. (2007). The obtained / ratio is comparable to the value (0.09) obtained for FePt
nanoparticles prepared by gas phase condensation Dmitrieva et al. (2007), and is larger than the
values (0.05) obtained for
FePt thin films Imada et al. (2007), indicating a high
degree of 10 order. The deduced is, however, small compared to the other FePt samples
(). The origin of this discrepancy is not clear at present,
but the outermost layers of the bare FePt particles might also be
oxidized to Fe2+ and become non-ferromagnetic because the XAS and
XMCD lineshapes of Fe2+ oxides and metallic Fe are hardly distinguishable.
| Nanoparticle (present work) | 1.4 | 0.12 | 0.08 | 1.8 |
|---|---|---|---|---|
| Nanoparticle (gas phase) Dmitrieva et al. (2007) | 2.21 | 0.19 | 0.09 | 0.038 |
| FePt thin films Imada et al. (2007) | 0.5 | 0.025 | 0.050.01 | 0.1 |
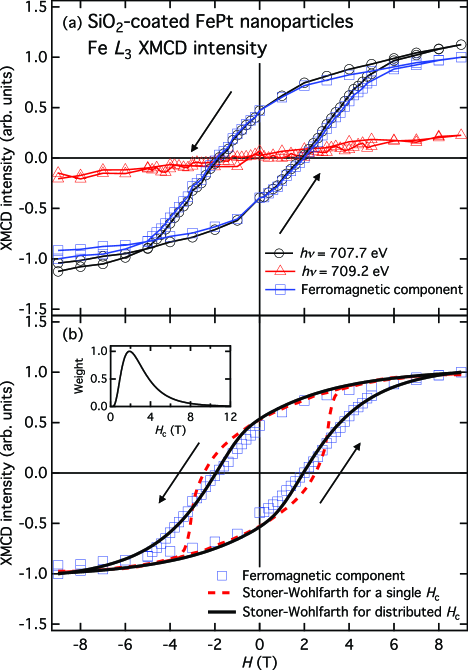
Figure 3(a) shows the Fe -edge XMCD
intensities of the FePt nanoparticles as functions of
magnetic field at two different photon energies. The curve at
= 709.2 eV, which reflects the XMCD signal of the Fe3+ oxide, is linear in and shows no hysteretic behavior. Since
the slope is given by the magnetic susceptibility of the Fe3+ ion of
the oxide, it is given by if the Fe3+ ion is
paramagnetic or by if it is antiferromagnetic. Here,
and are the Curie constant for the Fe3+ () ion
and the Neel temperature, respectively. From the slope , we estimated or K,
indicating that the Fe3+ at 300 K are paramagnetic or slightly below
, and cannot be ferro/ferrimagnetic.
In contrast, the XMCD intensity at
= 707.7 eV, which is dominated by FePt, shows a hysteretic
behavior with of 1.8 T. Because a - curve of the peak
of the Fe oxides overlaps with the curve at = 707.7 eV, we
obtained a - curve of a ferromagnetic component by subtracting the
curve at = 709.2 eV from the curve at = 707.7 eV. From the shape of the hysteresis
loop thus obtained as shown
in Fig. 3(a), one can see that the value of the remnant magnetization is half of
that of the saturation
magnetization and the shape itself is somewhat rounded compared to a
typical rectangular hysteresis loop for ferromagnetic materials. These
behaviors are
characteristic of the hysteresis of the Stoner-Wohlfarth model
Stoner and Wohlfarth (1948); Coey (2010), which explains based on the coherent
reversal in non-interacting single-domain particles and in good
agreement with some reports of nanoparticle magnetism
Chuev (2007); Lacroix et al. (2009). Therefore, we
first introduced the Stoner-Wohlfarth model with a fixed
(= 2.5 T) to reproduce the measured hysteresis
loop, however, could not obtain a good fit as shown by a dashed curve in Fig. 3(b), because
the experimental curve was broader in the high-field region. Then we
assumed a distribution of over a finite range (we assumed the log-normal
distribution) as shown in the inset of Fig. 3(b). The calculated
hysteresis loop shown in Fig. 3(b) reproduces almost all the characteristics of
the experimental curve, indicating that the SiO2-coated FePt
nanoparticles act as non-interacting single-domain
particles whose is distributed from 1 T to 5
T. The distribution of is possibly attributed to the
distribution of structural defects of the FePt
nanoparticles even though high degree of crystallinity is expected to be realized in the SiO2-coated FePt nanoparticles as discussed below. Furthermore, because
the Stoner-Wohlfarth model predicts , where
is the for the magnetic
field applied along the easy magnetization axis Stoner and Wohlfarth (1948), the of the present FePt nanoparticle sample is estimated as
large as 3.75 T. This value is comparable to that of 4 T for FePt particulate films
Shima et al. (2002) and larger than those of 2.2 T for FePt
(001) dot arrays Seki et al. (2006b) and 0.75 T for the microfabricated FePt
(001) dots Wang et al. (2008), indicating the
large magnetocrystalline anisotropy of the SiO2-coated FePt nanoparticles.
Finally, we discuss the origin of the observed large
value for the SiO2-coated FePt nanoparticles. The maximum single-domain
size is estimated as , where , , , , , and are the Boltzmann constant, Curie temperature, lattice constant, anisotropy constant, vacuum permeability, and saturation
magnetization, respectively Coey (2010). Using typical values for FePt nanoparticles of
and Dmitrieva et al. (2007), we estimate
the lower limit of as 100 nm, orders of magnitude
larger than the particle size. Therefore, the SiO2-coated FePt
nanoparticles can form in single domains and hence obtain the large
. If defects are present in the nanoparticles, they hinder
the single-domain formation because the defects act as nucleation
centers Wang et al. (2008). Thus, nucleation sites would lead to an enhancement of the . In
our fabrication method, the SiO2 coating protects the small enough FePt nanoparticle from extra dispersion, deterioration, and oxidization
during the sample preparation, leading to isolated single-domain FePt
particles, and eventually to the large value.
In conclusion, we have investigated the spin and orbital magnetic moments of Fe
in FePt nanoparticles coated with SiO2 using XMCD
measurements. The deduced ratio of the orbital to spin magnetic moments
= 0.08 is nearly equal to that of FePt
nanoparticles (0.09) condensed from gas phase for which oxidized layers were
removed by in situ plasmas treatment
Dmitrieva et al. (2007). The magnetization measured by Fe
-edge XMCD was saturated around 6 T and was as
large as 1.8 T, much larger than the (0.038 T) of the
gas phase condensed samples
Dmitrieva et al. (2007), and consistent with the result of
the SQUID measurement
Tamada et al. (2007a). The XMCD intensity versus
magnetic field curve was fitted to the Stoner-Wohlfarth model for
non-interacting single-domain nanoparticles whose is
distributed between 1 T to 5 T.
This work was supported by a Grant-in-Aid for Scientific
Research from the JSPS (S22224005) and the “Quantum Beam Technology
Development Program” of JST. The experiment was done under the approval
of the Photon Factory Program Advisory Committee (proposal
No. 2010G187), under the Shared Use Program of JAEA Facilities (Proposal
No. 2011A3840), and at JAEA beamline in SPring-8 (proposal No. 2011B3823
and 2012A3823/BL23-SU). SY acknowledges financial support from MEXT
KAKENHI (20104006). YT was supported by JSPS through the Program for
Leading Graduate Schools (MERIT).
References
- Ivanov et al. (1973) O. A. Ivanov, L. V. Solina, V. A. Demshina, and L. M. Magat, Phys. Met. Metallogr. 35, 81 (1973).
- Okamoto et al. (2002) S. Okamoto, N. Kikuchi, O. Kitakami, T. Miyazaki, Y. Shimada, and K. Fukamichi, Phys. Rev. B 66, 024413 (2002).
- Seki et al. (2006a) T. Seki, S. Mitani, K. Yakushiji, and K. Takanashi, Appl. Phys. Lett. 88, 172504 (2006a).
- Seki et al. (2008) T. Seki, S. Mitani, and K. Takanashi, Phys. Rev. B 77, 214414 (2008).
- Dmitrieva et al. (2006) O. Dmitrieva, M. Acet, G. Dumpich, J. Kästner, C. Antoniak, M. Farle, and K. Fauth, J. Phys. D: Appl. Phys. 39, 4741 (2006).
- Yamamoto et al. (2006) S. Yamamoto, Y. Morimoto, Y. Tamada, Y. K. Takahashi, K. Hono, T. Ono, and M. Takano, Chem. Mater. 18, 5385 (2006).
- Boyen et al. (2005) H.-G. Boyen, K. Fauth, B. Stahl, P. Ziemann, G. Kästle, F. Weigl, F. Banhart, M. Hessler, G. Schütz, N. Gajbhiye, J. Ellrich, H. Hahn, M. Büttner, M. Garnier, and P. Oelhafen, Adv. Mater. 17, 574 (2005).
- Dmitrieva et al. (2007) O. Dmitrieva, M. Spasova, C. Antoniak, M. Acet, G. Dumpich, J. Kästner, M. Farle, K. Fauth, U. Wiedwald, H.-G. Boyen, and P. Ziemann, Phys. Rev. B 76, 064414 (2007).
- Yamamoto et al. (2005) S. Yamamoto, Y. Morimoto, T. Ono, and M. Takano, Appl. Phys. Lett. 87, 032503 (2005).
- Morimoto et al. (2006) Y. Morimoto, T. Tamada, S. Yamamoto, T. Ono, and M. Takano, J. Magn. Soc. Jpn. 40, 464 (2006).
- Tamada et al. (2006) Y. Tamada, Y. Morimoto, S. Yamamoto, N. Hayashi, M. Takano, S. Nasu, and T. Ono, Jpn. J. Appl. Phys. 45, L1232 (2006).
- Tamada et al. (2007a) Y. Tamada, S. Yamamoto, M. Takano, S. Nasu, and T. Ono, Appl. Phys. Lett. 90, 162509 (2007a).
- Tamada et al. (2007b) Y. Tamada, Y. Morimoto, S. Yamamoto, M. Takano, S. Nasu, and T. Ono, J. Magn. Magn. Mater. 310, 2381 (2007b).
- Wang et al. (2009) D. Wang, T. Seki, K. Takanashi, T. Shima, G. Li, H. Saito, and S. Ishio, J. Appl. Phys. 105, 07A702 (2009).
- Tanaka et al. (1997) Y. Tanaka, N. Kimura, K. Hono, K. Yasuda, and T. Sakurai, J. Magn. Magn. Mater. 170, 289 (1997).
- Wang et al. (2008) D. Wang, T. Seki, K. Takanashi, and T. Shima, J. Phys. D: Appl. Phys. 41, 195008 (2008).
- Thole et al. (1992) B. T. Thole, P. Carra, F. Sette, and G. van der Laan, Phys. Rev. Lett. 68, 1943 (1992).
- Sun et al. (2000) S. Sun, C. B. Murray, D. Weller, L. Folks, and A. Moser, Science 287, 1989 (2000).
- Fan et al. (2004) H. Fan, K. Yang, D. M. Boye, T. Sigmon, K. J. Malloy, H. Xu, G. P. López, and C. J. Brinker, Science 304, 567 (2004).
- Saitoh et al. (2012) Y. Saitoh, Y. Fukuda, Y. Takeda, H. Yamagami, S. Takahashi, Y. Asano, T. Hara, K. Shirasawa, M. Takeuchi, T. Tanaka, and H. Kitamura, J. Sync. Rad. 19, 388 (2012).
- Crocombette et al. (1995) J. P. Crocombette, M. Pollak, F. Jollet, N. Thromat, and M. Gautier-Soyer, Phys. Rev. B 52, 3143 (1995).
- Singh et al. (2013) V. R. Singh, V. K. Verma, K. Ishigami, G. Shibata, Y. Yamazaki, A. Fujimori, Y. Takeda, T. Okane, Y. Saitoh, H. Yamagami, Y. Nakamura, M. Azuma, and Y. Shimakawa, J. Appl. Phys. 114, 103905 (2013).
- Carra et al. (1993) P. Carra, B. T. Thole, M. Altarelli, and X. Wang, Phys. Rev. Lett. 70, 694 (1993).
- Imada et al. (2007) S. Imada, A. Yamasaki, S. Suga, T. Shima, and K. Takanashi, Appl. Phys. Lett. 90, 132507 (2007).
- Coey (2010) J. M. D. Coey, Magnetism and Magnetic Materials (Cambridge University Press, 2010).
- Stoner and Wohlfarth (1948) E. C. Stoner and E. P. Wohlfarth, Phil. Trans. R. Soc. A 240, 599 (1948).
- Chuev (2007) M. Chuev, J. Exp. Theor. Phys. Lett. 85, 611 (2007).
- Lacroix et al. (2009) L.-M. Lacroix, R. B. Malaki, J. Carrey, S. Lachaize, M. Respaud, G. F. Goya, and B. Chaudret, J. Appl. Phys. 105, 023911 (2009).
- Shima et al. (2002) T. Shima, K. Takanashi, Y. K. Takahashi, and K. Hono, Appl. Phys. Lett. 81, 1050 (2002).
- Seki et al. (2006b) T. Seki, T. Shima, K. Yakushiji, K. Takanashi, G. Q. Li, and S. Ishio, J. Appl. Phys. 100, 043915 (2006b).
- Usov and Barandiaran (2012) N. A. Usov and J. M. Barandiaran, Appl. Phys. Lett. 101, 172402 (2012).
- Klemmer et al. (2002) T. J. Klemmer, N. Shukla, C. Liu, X. W. Wu, E. B. Svedberg, O. Mryasov, R. W. Chantrell, D. Weller, M. Tanase, and D. E. Laughlin, Appl. Phys. Lett. 81, 2220 (2002).