On the Source of the Dust Extinction in Type Ia Supernovae and the Discovery of Anomalously Strong Na I Absorption11affiliation: This paper includes data gathered with the 6.5 meter Magellan telescopes at Las Campanas Observatory, Chile.
Abstract
High-dispersion observations of the Na I D 5890, 5896 and K I 7665, 7699 interstellar lines, and the diffuse interstellar band at 5780 Å in the spectra of 32 Type Ia supernovae are used as an independent means of probing dust extinction. We show that the dust extinction of the objects where the diffuse interstellar band at 5780 Å is detected is consistent with the visual extinction derived from the supernova colors. This strongly suggests that the dust producing the extinction is predominantly located in the interstellar medium of the host galaxies and not in circumstellar material associated with the progenitor system. One quarter of the supernovae display anomalously large Na I column densities in comparison to the amount of dust extinction derived from their colors. Remarkably, all of the cases of unusually strong Na I D absorption correspond to “Blueshifted” profiles in the classification scheme of Sternberg et al. (2011). This coincidence suggests that outflowing circumstellar gas is responsible for at least some of the cases of anomalously large Na I column densities. Two supernovae with unusually strong Na I D absorption showed essentially normal K I column densities for the dust extinction implied by their colors, but this does not appear to be a universal characteristic. Overall, we find the most accurate predictor of individual supernova extinction to be the equivalent width of the diffuse interstellar band at 5780 Å, and provide an empirical relation for its use. Finally, we identify ways of producing significant enhancements of the Na abundance of circumstellar material in both the single-degenerate and double-degenerate scenarios for the progenitor system.
1 INTRODUCTION
Type Ia supernovae (SNe Ia) are one of the most effective observational tools for measuring the expansion history of the Universe. Their successful use in cosmology is due to the discovery of empirical relations that dramatically decrease the dispersion in peak luminosities at optical wavelengths. The first of these is the well-known correlation with light curve shape: intrinsically brighter SNe Ia have broader light curves that decline more slowly from maximum than do the light curves of less luminous SNe Ia (Phillips, 1993). The second is a strong dependence of peak luminosity on color that is in the same sense as dust reddening, but with an average value of the ratio of total-to-selective extinction, , that is significantly less than would be produced by normal interstellar dust in the Milky Way (Tripp, 1998). The latter result has variously been interpreted as possible evidence that the extinction arises in circumstellar dust (Wang, 2005; Goobar, 2008), as the consequence of intrinsic differences in color between SNe Ia with “normal” and “high” Si II expansion velocities (Foley & Kasen, 2011), or as a bias due to a misidentification of the dispersion in the luminosity/color-corrected Hubble diagram with an intrinsic scatter in luminosity rather than color (Scolnic et al., 2013).
Our understanding of the progenitors and explosion mechanism(s) that produce SNe Ia is still quite limited. Although there is widespread agreement that these objects correspond to the thermonuclear disruption of a white dwarf in a binary system, it is not yet clear if the companion to the white dwarf is a main sequence or giant star (“single-degenerate” or “SD” model) or another white dwarf (“double-degenerate” or “DD” model). In recent years, observational evidence favoring both scenarios has been put forward (e.g., see Howell, 2011; Maoz & Mannucci, 2012; Patat, 2013). In both the SD and DD scenarios, material ejected from the system prior to the explosion may remain as circumstellar material (CSM) (Moore & Bildsten, 2012; Raskin & Kasen, 2013; Shen et al., 2013). Sternberg et al. (2011) found a strong statistical preference for blueshifted structures in the narrow Na I D absorption observed in the line-of-sight to many SNe Ia, suggestive of gas outflows from the progenitor systems. In a few such cases, temporal variations of blueshifted components of the Na I D lines apparently due to changing ionization conditions in the CSM have also been observed (e.g., Patat et al., 2007; Simon et al., 2009; Dilday et al., 2012). On the other hand, radio and X-ray observations of the prototypical type Ia SN 2011fe place tight upper limits on the amount of CSM in the progenitor system before explosion (e.g., Horesh et al., 2012), and early-time photometry of this event apparently rules out either a red giant or main sequence companion (Bloom et al., 2012).
In the Milky Way, the strengths of certain interstellar absorption features such as the Na I D lines and the diffuse interstellar bands (DIBs) have been known for many years to correlate with dust extinction (e.g., Merrill & Wilson, 1938; Hobbs, 1974). In this paper, we employ high-dispersion spectroscopy to use these features as an independent probe of the dust affecting the colors of SNe Ia. As we will show, the data indicate that the dust extinction for the objects where DIBs are observed is generally consistent with the extinction derived from the SN colors, and therefore most likely arises in the interstellar medium of the host galaxy. However, one-fourth of the SNe Ia, all with blueshifted structures as per Sternberg et al. (2011), display anomalously large Na I column densities that, in the interstellar medium (ISM) of the Milky Way, would correspond to an order of magnitude or more greater dust extinction than that implied by the SN colors.
2 OBSERVATIONS AND ANALYSIS
2.1 Column Densities and Equivalent Widths
Our approach is to first examine the relationship between dust extinction and interstellar absorption lines in the Milky Way. These results will then be contrasted with a similar comparison between the dust extinction in the line-of-sight to the SN Ia as derived from their optical and near-infrared (NIR) light curves, and the narrow absorption lines produced by the host galaxy ISM and/or a pre-existing CSM (hereafter referred to collectively as “host absorption”).
In the first case, we employ a sample of 46 SNe and AGNs as external beacons to study the absorption lines produced by the ISM of the Milky Way. Echelle spectra of 22 of these objects are drawn from the observations of thermonuclear and core-collapse SNe published by Sternberg et al. (2011) and available through WISeREP (Yaron & Gal-Yam, 2012, http://www1.weizmann.ac.il/astrophysics/wiserep/). The remaining 24 spectra in our data set correspond to unpublished observations of SNe and AGNs obtained with the Magellan Inamori Kyocera Echelle (MIKE) (Bernstein et al., 2003) on the 6.5 m Clay telescope. Table 1 lists the objects in this sample. Henceforth, we refer to these objects as the “Milky Way” sample.
To study the relationship between the SN dust extinction and the narrow host absorption lines, we have put together a sample of 32 SNe Ia with both high-dispersion spectra and well-observed light curves. Spectra for 21 of these SNe Ia were drawn from the Sternberg et al. (2011) study (also available through WISeREP), and an additional 6 are taken from Foley et al. (2012b). Results for the remaining 5 SNe are taken from the literature. Table On the Source of the Dust Extinction in Type Ia Supernovae and the Discovery of Anomalously Strong Na I Absorption11affiliation: This paper includes data gathered with the 6.5 meter Magellan telescopes at Las Campanas Observatory, Chile. lists the full sample of 32 SNe Ia along with host galaxy names, morphologies, and references to the SN photometry. Table On the Source of the Dust Extinction in Type Ia Supernovae and the Discovery of Anomalously Strong Na I Absorption11affiliation: This paper includes data gathered with the 6.5 meter Magellan telescopes at Las Campanas Observatory, Chile. gives the sources and wavelength resolutions of the high-dispersion spectral observations. These SNe are referred to as the “host absorption” sample in the remainder of this paper.
Column densities of neutral sodium and potassium were measured for both the Milky Way and host absorption components of the Na I D 5890, 5896 and K I 7665, 7699 doublets using the Voigt profile fitting program, VPFIT222222http://www.ast.cam.ac.uk/~rfc/vpfit.html, developed by R. F. Carswell, J. K. Webb, and others, in combination with the VPGUESS232323http://www.eso.org/~jliske/vpguess/ interface of J. Liske. Upper limits for non-detections of both Na I and K I were calculated by first estimating an upper limit to the equivalent width, and then converting this to a column density using empirical relations between equivalent width and column density derived from weak, unsaturated lines in other objects. In cases where the Na I D lines were significantly saturated ( ), the much weaker K I lines were used to determine the velocity and Doppler parameter, , of each visible component, and this information was employed in fitting the saturated portion of the Na I D profiles. This procedure was possible for most of the objects observed from 2006 onward. Four of the SNe in the host absorption sample had extremely strong D lines ( ). For one of these — SN 2002bo —the spectral coverage did not include the K I lines, and so the uncertainty of our measurement of is large. A model with two absorption components provided a significantly better fit to the severely saturated profiles of the D lines in this SN than did one with a single component, and so we have adopted the results of the two-component model in this paper. However, without the additional information provided by the K I lines, the error associated with the measurement of is large.
Kemp et al. (2002) found that Na I column densities measured from fitting profiles to the D lines for values were systematically underestimated by 0.40–0.70 dex compared to column densities measured from the much weaker Na I UV 3302, 3303 doublet. The UV lines are not covered by our echelle spectra so we cannot confirm this, although as mentioned in §4.5, a comparison of the ratio derived for our Milky Way sample with the measurements of Kemp et al. (2002) suggests that our values may be similarly affected. Nevertheless, since our approach is to compare the SN host absorption measurements relative to our same measurements for the Milky Way, this problem should not affect our conclusions.
Although the Ca II H & K lines were also present in many of the SNe spectra, except for a few specific objects, they are not included in this study since the column density of Ca II is poorly correlated with dust extinction in the Milky Way, presumably due to variations in the large depletion factor of calcium (Hobbs, 1974).
Equivalent widths of the DIB at 5780 Å were calculated using the IRAF242424IRAF is distributed by the National Optical Astronomy Observatory, which is operated by the Association of Universities for Research in Astronomy (AURA) under cooperative agreement with the National Science Foundation. task fitprofs assuming a Gaussian profile of 2.1 Å FWHM, a typical value in the Milky Way (Tuairisg et al., 2000; Welty et al., 2006; Hobbs et al., 2008)252525Although very high dispersion spectroscopy has shown that the profile of the 5780 Å feature is not Gaussian (Galazutdinov, Lo Curto, & Krełowski, 2008), the wavelength resolution and signal-to-noise ratio of our observations do not warrant a more sophisticated method of determining the equivalent width.. This feature was selected since, among the DIBs, it offers an optimal combination of strength and narrow line width. Upper limits (3-) were calculated from signal-to-noise ratio measurements using an empirical relationship derived from the error estimates returned by fitprofs for those objects where the 5780 Å feature was detected. In the case of SN 2009ig, a high signal-to-noise ratio spectrum obtained with UVES on the ESO VLT was used to calculate a tighter upper limit on the equivalent width of the host 5780 Å absorption than allowed by our MIKE data.
Total column densities for the 46 objects in our Milky Way sample are given in Table 1. Total column density and equivalent width measurements for the 32 SNe Ia in the host absorption sample are found in Table On the Source of the Dust Extinction in Type Ia Supernovae and the Discovery of Anomalously Strong Na I Absorption11affiliation: This paper includes data gathered with the 6.5 meter Magellan telescopes at Las Campanas Observatory, Chile.. Figure 1 shows the VPFIT host absorption profile fits for the SNe where both the Na I D and K I lines were detected, while Figure 2 shows the fits of the host Na I D lines for those objects for which the K I lines were not observed or detected.
2.2 Dust Extinction
We adopt the Schlafly & Finkbeiner (2011) re-calibration of the Schlegel et al. (1998) extinction map to estimate the Milky Way component of the visual extinction, , for the objects in both our Milky Way and host absorption samples. Measuring the dust extinction produced in the SN host galaxy is a more complicated matter. In general, SNe Ia in low-reddening environments display intrinsic colors at maximum light that vary uniformly with the decline rate parameter, , and these relations can be used to derive color excesses such as . Fundamentally, however, it is that is proportional to the column density of the dust, and converting from to requires knowledge of the ratio of total-to-selective extinction, . In the Milky Way, the distribution of values is strongly peaked at 3 (e.g., see Fitzpatrick & Massa, 2007), whereas the situation is not so clear for SNe Ia in other galaxies. Cosmological studies solving for an average value of by minimizing the Hubble diagram dispersion inevitably yield values (e.g., Astier et al., 2006; Conley et al., 2007; Kessler et al., 2009), whereas ratios of color excesses at optical and NIR wavelengths for individual SNe Ia indicate that while most heavily-reddened events have , the color excesses of many SNe Ia with are consistent with the standard Galactic value of (Folatelli et al., 2010; Phillips, 2012; Burns et al., 2013).
In this study, we employ a Markov-Chain Monte Carlo (MCMC) code to simultaneously estimate most-likely values of and from optical and (when available) NIR light curves of the SNe Ia listed in Table On the Source of the Dust Extinction in Type Ia Supernovae and the Discovery of Anomalously Strong Na I Absorption11affiliation: This paper includes data gathered with the 6.5 meter Magellan telescopes at Las Campanas Observatory, Chile.. Sources for these data are given in columns 4 and 5 of the table. Briefly, the code models the observed pseudo-colors111The pseudo-colors at maximum are computed by taking the difference of the maxima of each filter’s light-curve. of each SN as a combination of an intrinsic color dependent on the decline rate parameter and a color excess due to dust extinction along the line-of-sight. The dust extinction, , in any band, , is modeled using the Cardelli et al. (1989) extinction law, which has two free parameters: and . Given these two parameters and the observed value of , the observed pseudo-color at maximum, , can be computed as:
| (1) |
where is a second-degree polynomial that describes the intrinsic color at maximum of SNe Ia (e.g., see Figure 2 of Phillips, 2012). Note that nowhere do we need to know the distance to the SN Ia as we are dealing with colors only. We determine the pseudo-colors at maximum for both the training sample and the objects in this paper using SNooPy (Burns et al., 2011) fits to the observed light-curves. For filters, there are only independent colors and we model the set , where . Any other color can be derived as the sum or difference of two of these colors. However, the errors in the colors for a single object are correlated as they all contain the same magnitude. These correlated errors are accounted for in the MCMC code.
For objects that are significantly reddened () and have full optical and NIR coverage, the value of can be constrained quite well. However, as the reddening decreases, the value of cannot be constrained so readily, and if we do not use a more restrictive prior, we cannot get an upper bound for (a lower bound of zero is implicitly assumed). This is also the situation when we do not have NIR coverage. We therefore adopt a flat prior for , while for a two-Gaussian prior is employed consisting of a sharp component centered at that carries most of the distribution, plus a smaller (%) contribution from a Gaussian centered at with very large spread. This prior is expressed mathematically as:
| (2) |
where , , , , and are fixed at the following values derived from a training set of 74 SNe Ia observed in the optical () by the CSP, 54 of which also had NIR () coverage (see Burns et al., 2013, for further details):
| (3) |
The two-Gaussian prior was motivated by the observed distribution of values of derived from the Carnegie Supernova Project (CSP) (Hamuy et al., 2006) sample of SNe Ia, which is strongly peaked at , but has long tails to larger and smaller values of . One additional constraint on is that it be strictly positive.
For each color , we assume is the same for all SNe Ia, but that each SN has its own and . Of course, and are highly covariant (indeed are completely degenerate for a single color). We therefore require several independent colors to properly constrain and . Having NIR colors is of great help because the relative extinction becomes quite insensitive to at longer wavelengths, allowing us to break the / degeneracy. In these cases, the two-Gaussian prior on has little effect on the derived value of . However, when there is no NIR photometry or is very small, the prior on limits the possible values of .
Using MCMC techniques, we simultaneously solve for and for each SN using all independent colors available. We construct histograms for and by binning the Markov chains. We then compute the mode and 1- errors by bracketing 34% of the area to each side. The final calculated values are given in columns 6 and 7 of Table On the Source of the Dust Extinction in Type Ia Supernovae and the Discovery of Anomalously Strong Na I Absorption11affiliation: This paper includes data gathered with the 6.5 meter Magellan telescopes at Las Campanas Observatory, Chile.. Where the posterior probability distribution is significantly non-symmetric, we report upper and lower bounds.
3 RESULTS
3.1 Na I and K I
The upper-left panel of Figure 3 displays total Galactic Na I column densities for the 46 objects in our Milky Way sample plotted versus the values inferred from the Schlafly & Finkbeiner (2011) Galactic reddenings. In calculating , a value of is assumed. The red shaded area in Figure 3 illustrates the uncertainty in these values introduced by the 1- dispersion of in values observed in the Milky Way (Fitzpatrick & Massa, 2007). Shown for comparison are column density measurements obtained from profile fits to the Na I D lines by Sembach et al. (1993) for a sample of 50 distant (d 1 kpc) late-O and early-B stars in low-density regions of the Milky Way disk and halo. A fit to the combined (Milky Way + Sembach et al. (1993)) sample of 96 measurements gives
| (4) |
where the uncertainties in the slope and intercept are given in parentheses. This fit is plotted in the upper-left panel of Figure 3, with the gray shading indicating the 1- dispersion in of 0.26 dex.
In the lower-left panel of Figure 3, a similar plot of K I column densities versus is shown for the objects in our Milky Way sample for which a Galactic component of the K I 7665, 7699 doublet was detected. The open circles are K I column densities derived from the K I 7699 line for 52 stars in the Milky Way by Welty & Hobbs (2001). The solid line is a fit to the combined data, with the gray shading indicating the 1- dispersion of 0.35 dex. Since an essentially linear relationship exists in the Milky Way between and (Welty & Hobbs, 2001), the slope of the fit was set equal to the slope of the vs. relation in the upper-left panel of Figure 3, yielding
| (5) |
As the left half of Figure 3 shows, the measurements of the Galactic and values derived from our Milky Way sample are consistent with the fits to the stellar data. Note that the dispersions in the stellar relations are large, and if one were to use the fits to estimate from a measurement of the Na I or K I column density, the error would be 54% or 72% of itself, respectively.
The right half of Figure 3 shows the same plots, but this time for the host absorption components of the Na I and K I lines. The fits and 1- dispersions corresponding to the Milky Way relations are reproduced from the left half of Figure 3 for comparison. The symbols used to plot the SNe Ia measurements follow the classification scheme based on the structure of the Na I D profile employed by Sternberg et al. (2011), with the three categories defined as follows:
-
•
Blueshifted: One prominent absorption feature with weaker features at shorter wavelengths with respect to it.
-
•
Redshifted: One prominent absorption feature with weaker features at longer wavelengths with respect to it.
-
•
Single/Symmetric: A single absorption feature, or several features with both blue and redshifted structures of similar magnitude.
Figure 3 shows that only 1 of 96 objects in the Milky Way + Sembach et al. (1993) sample has a Na I column density that lies - from the fit defined by equation 4, consistent with the statistical expectation. However, 8 of 27 (30%) of the SNe Ia host galaxy Na I column densities fall - above the Galactic fit. Even more striking is the fact that all eight of these deviant SNe Ia have “Blueshifted” host Na I D absorption profiles. Some of these (e.g., SNe 2007kk and 2009ig) are objects with significant Na I column densities, but for which the optical and NIR colors imply quite small amounts of dust extinction. Note that one of the “Blueshifted” SNe, 2006cm, was originally classified by Sternberg et al. (2011) as “Single/Symmetric”. The Na I D1 and K I 7665 profiles for this SN are displayed in Figure 4. The D1 line is highly saturated making it difficult to categorize, but the much weaker K I 7665 absorption reveals that SN 2006cm should actually be classified as “Blueshifted”.
In our sample, there are 14 “Blueshifted”, 7 “Redshifted”, and 6 “Single/Symmetric” SNe. The Sternberg et al. (2011) sample had very similar numbers — 15, 6, and 6 SNe, respectively, in these three categories — and so our sample should be representative of theirs. The probability in a random draw that all eight of the SNe Ia in Figure 3 lying more than 3- from the Milky Way relationship would belong to the “Blueshifted” class is 0.14% and, therefore, highly unlikely262626It might be argued that the “Single/Symmetric” SN 1994D and the “Redshifted” SN 2001cp, for which we are only able to place an upper limit on , should also be included in this calculation. Doing so increases the probability of a chance occurrence to 1.5%.
Five of the SNe Ia in our sample (2007hj, 2007on, 2008hv, 2008ia, and SNF20080514-002) did not show detectable host Na I D absorption in their spectra. The optical and NIR colors of these objects, all of which occurred in E or S0 host galaxies, identify them as having suffered little or no dust reddening, consistent with the absence of detectable Na I D lines. Upper limits (3-) on for these non-detections are given in Table On the Source of the Dust Extinction in Type Ia Supernovae and the Discovery of Anomalously Strong Na I Absorption11affiliation: This paper includes data gathered with the 6.5 meter Magellan telescopes at Las Campanas Observatory, Chile. and plotted in Figure 3.
Due to the weakness of the K I 7665, 7699 doublet, we were able to measure host K I column densities for only eight of the SNe Ia in our host absorption sample. Upper limits (3-) were measured for an additional three SNe with high signal-to-noise ratio spectra. These measurements, along with the host K I column density for SN 2001el published by Sollerman et al. (2005), are given in Table On the Source of the Dust Extinction in Type Ia Supernovae and the Discovery of Anomalously Strong Na I Absorption11affiliation: This paper includes data gathered with the 6.5 meter Magellan telescopes at Las Campanas Observatory, Chile. and plotted in the lower-right panel of Figure 3. Interestingly, of the three “Blueshifted” objects that lie more than 5- above the Galactic vs. relationship — SNe 2006cm, 2008fp and 2009ig — only SN 2009ig falls significantly above the corresponding vs. relationship.
3.2 DIB at 5780 Å
Although the carriers of DIBs remain unknown (Sarre, 2006), they are ubiquitously present in the ISM of the Milky Way and beyond — from the Magellanic Clouds, M31, and M33, to starburst galaxies, SNe host galaxies and even damped Ly systems (e.g., Cox et al., 2008; Heckman & Lehnert, 2000; Sollerman et al., 2005; York et al., 2006). The upper-left panel of Figure 5 displays the equivalent width of the DIB at 5780 Å plotted as a function of for 131 late-O and early-B stars in the Milky Way (Friedman et al., 2011) (open circles), and for the 12 objects in our Milky Way sample for which we were able to detect a Galactic component of the 5780 Å DIB absorption feature (solid circles). Previous studies (e.g., Herbig, 1993; Welty et al., 2006; Friedman et al., 2011; Vos et al., 2011; Yuan & Liu, 2012) have found that the strength of the 5780 Å feature is essentially linearly proportional to the amount of reddening, and so we assume this in deriving the following fit to these combined data:
| (6) |
The black line in the upper-left panel of Figure 5 shows this fit, which is in excellent agreement with that recently obtained by Yuan & Liu (2012) for a much larger sample of stars. The gray shading indicates the 1- dispersion of 0.22 dex that translates to a 50% error in if the 5780 Å feature is used to estimate the dust extinction for any single object.
As shown in the lower-left panel of Figure 5, the strength of the 5780 Å feature also correlates reasonably well with the column density of Na I in the Milky Way (Herbig, 1993; Welty et al., 2006). The open circles are DIB 5780 Å equivalent widths for 55 early-type stars from Friedman et al. (2011) combined with Na I column densities measured from the D lines for the same stars by Welsh et al. (2010); the solid circles in the figure correspond to the measurements of the Galactic 5780 Å feature in our Milky Way sample. Equations 4 and 6 yield
| (7) |
which provides a reasonable fit to the observations, albeit with a large dispersion of 0.44 dex.
The right half of Figure 5 shows the same plots for the host absorption component of the DIB at 5780 Å. This feature was detected in 34% (11 of 32) of the SNe Ia in our sample. Upper limits (3-) are plotted for an additional eight objects. Figure 6 illustrates three examples of detections (SNe 2006cm, 2008fp, and 2007sr), and one where only an upper limit could be measured (SN 2009ig). The upper-right panel of Figure 5 indicates that in all cases where the 5780 Å feature was detected, its strength is compatible with the dust extinction implied by the SN colors. In general, the upper limits are also consistent with the Milky Way relation, with the exception of SN 2006X for which Cox & Patat (2008) found the DIBs at 6196 Å and 6283 Å to be 2.5–3.5 times weaker than expected. Unfortunately, the echelle spectra obtained by these authors did not cover the 5780 Å feature, and the signal-to-noise ratio of our own observation does not allow a tight upper limit to be measured. Based on the relations given by Friedman et al. (2011), the Cox & Patat (2008) measurements of the equivalent widths of the 6196 Å and 6283 Å features imply 5780 Å 50–160 mÅ, consistent with our upper limit.
The lower-right panel in Figure 5 shows that the correlation between the strength of the 5780 Å feature and the Na I column density is particularly poor for the “Blueshifted” SNe Ia. As in Figure 3, SNe 2002bo, 2006cm, and 2008fp, and 2009ig have values of that are an order of magnitude or more greater than predicted by the Milky Way relationship. While the discrepancy of these four SNe Ia in Figure 3 could perhaps be attributed to large underestimates of from the SN colors, the fact that errors in have no effect on the points in the lower-right panel of Figure 5 argues against this explanation. We conclude, therefore, that the anomalously large Na I column densities in these SNe Ia is a real effect.
4 DISCUSSION
The observations presented in §3 can be summarized as follows:
-
•
One-fourth of the SNe Ia in our sample (8 of 32) exhibit host Na I D absorption that is more than 3- stronger than expected based on the amount of dust extinction implied by the SN colors and the Galactic relationship between and . Nearly all of these SNe Ia with anomalously large Na I column densities belong to the “Blueshifted” class of Sternberg et al. (2011).
-
•
The relationship between the host K I absorption column densities and for the SNe Ia appear to be more consistent with the Milky Way relationship. While the number of detections is small and this result therefore requires verification, it is interesting to note that two of the “Blueshifted” objects with highly-discrepant Na I column densities, SNe 2006cm and 2008fp, showed essentially normal K I absorption for the dust extinction implied by their colors.
-
•
When detected in SNe Ia, the strength of the host absorption DIB 5780 Å feature is consistent with the amount of dust extinction implied by the SN colors. Notably, this statement applies to the “Blueshifted” SNe 2002bo, 2006cm, 2008fp, and 2009ig, all of which displayed anomalously large Na I column densities.
Figure 7 illustrates just how unusually strong the Na I D absorption is for two SNe with “Blueshifted” host absorption profiles. In the upper-left panel, the Milky Way component of the Na I D lines in the spectrum of SN 2009le is plotted. The Galactic extinction for this object is mag. In the upper-right panel, the host absorption component of the D lines in the spectrum of the “Blueshifted” SN 2009ig is shown for comparison. Analysis of the light curves of SN 2009ig yields an upper limit for the host extinction of mag, yet the D lines are clearly much stronger than the Milky Way absorption in SN 2009le. The lower half of Figure 7 shows a similar comparison of the Milky Way component of the Na I absorption in the spectrum of SN 2011ek [ mag], which is contrasted with the host absorption component of the D lines in the spectrum of the “Blueshifted” SN 2008fp [ mag]. Note the strongly saturated line profiles in the spectrum of the latter object, whereas the Na I lines produced by the interstellar medium of the Milky Way in SN 2011ek are considerably weaker despite the extinction being nominally somewhat greater. These two comparisons demonstrate visually that the anomalous strength of the host Na I D absorption in these two SNe is very real, and not due to inaccuracies in measuring column densities of saturated lines.
4.1 Na I, K I, and DIBs in the Local Group and Beyond
In order to understand if systematic differences in the sodium and potassium abundances might occur due to potential metallicity effects in supernova host galaxies, we can examine similar trends for the Large and Small Magellanic Clouds (LMC and SMC) — two nearby galaxies which have significantly lower metallicities, by factors of 2 and 5, respectively, compared to the Milky Way (Dufour, 1984; Rolleston, Trundle, & Dufton, 2002; Peimbert & Torres-Peimbert, 1976; Bouret et al., 2003). The observed Na I and K I column densities of the diffuse ISM in both the LMC and SMC (Cox et al., 2006, 2007; Welty et al., 2006) are plotted as a function of in the left half of Figure 8. When only color excesses are provided by these authors, visual extinctions were computed using the average values given by Gordon et al. (2003). The measurements clearly reproduce the Galactic trends shown in Figure 3. Despite marked environmental differences such as the higher gas-to-dust ratio and stronger UV radiation field of the LMC, both and follow the Galactic trend although the scatter in is somewhat larger. The Na I and K I column densities are also highly correlated in the Magellanic Clouds, with the ratio being similar to that found in the ISM of the Milky Way (see §4.5).
In this comparison it is important to understand that, due to the lower metallicity and stronger radiation fields, both and are lower with respect to in the Magellanic Clouds. However, the gas-to-dust ratio , which scales approximately with metallicity, is also higher by a similar factor in the Magellanic Clouds (Welty et al., 2006). Both effects essentially cancel, resulting in similar correlations between , , and for both the Magellanic Clouds and the Milky Way. We conclude that it is unlikely that the enhanced Na I absorption observed for some SNe Ia is due to global host galaxy metallicity differences.
The panels on the right in Figure 8 display the observed 5780 Å DIB equivalent width versus (top) and the Na I column density (bottom), respectively. In both cases, the equivalent width measurements of the 5780 Å feature fall, on average, below the Galactic relation by a factor of 2, consistent with the findings of Welty et al. (2006). As discussed by these authors, this is likely a consequence of lower metallicity, lower dust-to-gas ratios and molecular fractions, and the generally stronger radiation fields in the Magellanic Clouds. The similar behaviour of the 5780 Å DIB strength with respect to both and is consistent with the good correlation between the latter two quantities (see the upper left panel of Figure 8). This is notably dissimilar to the situation for the SNe Ia, where the 5780 Å DIB strengths follow the Galactic EW(5780) vs relation, but do not follow the Galactic EW(5780) vs relation.
Unfortunately, recent determinations of Na I column densities for extra-Galactic sight-lines towards M31 and M33 suffer from saturation due to lower spectral resolution observations (Cordiner et al., 2011); accurate comparisons for these galaxies will require more sensitive high-resolution spectroscopic data. The measured 5780 Å DIB strengths versus in M31 are slightly above the Milky Way trend, but the sample is limited and prone to observational bias in preferentially detecting the strongest bands.
Beyond the Local Group, moderate-resolution observations of the Na I D lines and several DIBs, including the 5780 Å feature, in starburst galaxies indicate that the equivalent widths follow the same dependence as Galactic DIBs on and the Na I column density (Heckman & Lehnert, 2000). The 5780 Å feature was detected by York et al. (2006) in the damped Ly system of the QSO AO 0235+164 and also found to be consistent with the Milky Way EW(5780) vs. relation. These authors also detected the Na I D2 line in this same system at an equivalent width of 0.8 Å . As discussed in the next section, equivalent widths are not as reliable as column densities for inferring dust extinction, but this value is not inconsistent with the reddening of derived for the QSO (Junkkarinen et al., 2004) assuming the correlation observed in the Milky Way.
Sparks, Carollo, & Macchetto (1997) detected extended interstellar Na I D absorption lines from gas associated with the compact emission filament system and dust lane in the central 20 arcsec of the dominant elliptical galaxy in the Centaurus cluster, NGC 4696. Due to the low resolution of their spectral observations, only total equivalent widths of the Na I absorption could be measured. Interestingly, the correlation between equivalent width and was found to be significantly steeper than the standard Milky Way relation, suggesting a low dust-to-gas ratio. This is one of the few cases we are aware of in the literature where enhanced Na I absorption is observed in the ISM of a galaxy, although it should be emphasized that the environment is quite different from the disks of the spiral galaxy hosts of the majority of the SNe Ia in our sample.
4.2 Equivalent Width of Na I D as an Indicator of Extinction
The equivalent width of the Na I D lines, EW(Na I D) is commonly measured in low-dispersion spectra to estimate the dust reddening for SNe Ia with poor photometric coverage, or peculiar SNe whose intrinsic colors are unknown (see Turatto et al., 2003, and references therein). It is interesting to compare the results for the Na I D host absorption column densities presented in §3 with what equivalent widths give. This is shown in Figure 9 where the equivalent widths of the D lines measured from our echelle spectra are plotted versus . Values for the Milky Way sample, augmented by high dispersion measurements of 82 stars (Sembach et al., 1993; Munari & Zwitter, 1997) and 30 QSOs (Poznanski et al., 2012), are plotted as asterisks. The dashed line corresponds to the relation derived by Poznanski et al. (2012) based on 117 moderate-to-high-resolution observations of QSOs and nearly a million low-resolution Sloan Digital Sky Survey spectra of galaxies and QSOs. This line provides a reasonably adequate representation of the Milky Way EW(Na I D) measurements, but the rms dispersion of 0.08 dex in quoted by these authors and shown in gray in Figure 9 is clearly underestimated. Presumably this is because the points used by Poznanski et al. to derive the final relations and dispersion (see Figure 9 of their paper) were obtained by averaging individual measurements of very large numbers of objects. Also plotted in Figure 9 is the curve given by Munari & Zwitter (1997) for single-absorption components of the D1 line. As noted by Poznanski et al. (2012), this relation provides an equally good fit when scaled to match the observations. The dispersion in with respect to this latter relation is 0.30 dex, corresponding to a 68% error in for any single object rather than the 20% error implied by Poznanski et al. (2012). It is also clear from Figure 9 that the equivalent width of the Na I D lines becomes insensitive to estimating the dust extinction for EW(Na I D) Å (see also Munari & Zwitter, 1997).
Turning to the host absorption EW(Na I D) measurements, Figure 9 reveals an effect similar to that seen in the column densities plotted in Figure 3, with a significant number of the points lying more than 3- above the Milky Way relationship and the majority of these belonging to the “Blueshifted” class. As more SNe Ia with good photometric and spectroscopic coverage have been observed, it has become clear that the EW(Na I D) is not a reliable indicator of the host dust extinction of SNe Ia (Blondin et al., 2009; Folatelli et al., 2010; Poznanski et al., 2011). Figure 3 shows that the reason for this poor correlation is the relatively large fraction of SNe Ia with strong Na I D absorption that is an order of magnitude greater in column density than expected from the SN Ia colors and the Milky Way relation. Indeed, based on our high-dispersion observations, it would seem that the only reliable deduction that can be made using either column densities or equivalent widths is that the absence of detectable Na I absorption in a high signal-to-noise ratio spectrum is consistent with low dust extinction.
Note that in some cases equivalent widths and column densities give quite different answers. An example is the case of SN 1986G and SN 2006cm. While both of these events suffered a similar amount of dust extinction, the host absorption Na I column density for SN 1986G was fully consistent with the Milky Way vs. relation, whereas for SN 2006cm it was greater by 1.2 dex (see Figure 3). Nevertheless, Figure 9 shows that the EW(Na I D) for SN 2006cm was significantly smaller than that of SN 1986G. The explanation for this apparent inconsistency is found in Figure 10, where the Na I column density is plotted versus the equivalent width of the D lines for both the Milky Way and host absorption samples. Curves of growth for three different values of the Doppler parameter, , are also displayed in this figure. These are shown for both single and multiple absorption components with the same Doppler parameter, with the single-component cases corresponding to the left-most curve for each value of . Note that the curve for a single component with is nearly identical to the curves for two components with or four components with . This ambiguity is inherent to equivalent widths, and explains why column densities are to be preferred whenever possible.
Returning to SN 1986G, the profile of the host absorption D lines consisted of five major components covering a wide swath (200 ) of the spectrum (D’Odorico et al., 1989). The two strongest components had Doppler parameters of 10 and column densities of 13.4 and 13.1, respectively. The third-strongest component also had , but with and the two weakest both had , with column densities of 12.6 and 11.7. Reading off the equivalent widths corresponding to these individual components from Figure 10 and summing them yields a total equivalent width EW(Na I D) very close to the observed value of 3.8 Å. In the case of SN 2006cm, the Na I D profile was dominated by three major components, but concentrated into a considerably narrower (60 ) portion of the spectrum. The two strongest components had and of 15.0 and 14.5, respectively, while the third component was slightly narrower ( ) with a column density of 13.7. Summing the corresponding equivalent widths using Figure 10 gives a total equivalent width close to, but slightly larger than, the observed value, with the discrepancy accounted for by the significant overlapping in velocity space of the absorption components.
4.3 Relation to Previous Studies of Na I D in SNe Ia
The fact that nearly all of the SNe Ia showing anomalously large Na I column densities belong to the Sternberg et al. (2011) “Blueshifted” class suggests an association with CSM. Sternberg et al. (2011) estimated that a quarter to a third of local SNe Ia with detectable Na I D absorption show evidence of outflowing CSM, which is remarkably similar to the percentage of objects with anomalously large Na I column densities that we find in this study. It should be kept in mind, however, that the Sternberg et al. (2011) classifications are valid in a statistical sense only. When considering single objects, it is impossible to ascertain the systemic velocity of the progenitor and thus ascribe any particular absorption component to either inflow or outflow. Rather, it is the unexplained surplus of SNe with blueshifted absorption features that implies an association with some kind of outflow. Note that the strong preference observed for blueshifted features compared to non-blueshifted ones does not depend on whether the velocity zero point is taken to be that of the strongest absorption component or if, alternatively, it is defined with respect to emission or absorption lines in the SN spectrum due to the host galaxy or using the radial velocity of the host (Sternberg et al., 2011; Maguire et al., 2013).
Foley et al. (2012b) found that SNe Ia of the “Blueshifted” class have systematically higher ejecta velocities at maximum brightness relative to the rest of the SN Ia population, suggesting a link between the SN progenitor system and the explosion properties. Wang et al. (2013) recently presented evidence that high-velocity SNe Ia, defined as having at maximum, are more concentrated in the inner and brighter regions of their host galaxies, and that they tend to occur in more-luminous hosts than do normal-velocity events. They suggest that high-velocity SNe represent a subtype of the Type Ia class originating from younger, more metal-rich progenitor systems. The left half of Figure 11 shows plots of vs. for the SNe Ia in our host absorption sample split into the high-velocity and normal-velocity subsamples. Taken as a group, the high-velocity events deviate significantly from the Milky Way relation, and 70% of them belong to the “Blueshifted” class. The median of the absolute deviations of the high-velocity SNe Ia with respect to the Milky Way relation is 0.88 dex in column density, whereas it is 0.29 dex for the normal-velocity subsample. Nevertheless, the correlation is imperfect, with four of the most deviant “Blueshifted” SNe (2002ha, 2006cm, 2007fb, and 2008fp) belonging to the normal-velocity subsample.
Our observations are also relevant to a recent paper by Förster et al. (2012) who found an apparent correlation between the late-phase nebular velocity shift, , and the equivalent width of the narrow host Na I D absorption as measured in low-dispersion spectra. The sense of this dependence was that SNe with have generally stronger Na I D lines than those with . Maeda et al. (2010, 2011) had previously found a correlation of both ejection velocity and peak color with , which they interpreted as a viewing angle effect of off-center explosions. Förster et al. (2012) argued that the color effect might alternatively be due to dust mixed with previously-existing CSM, thus accounting for not only the stronger Na I D lines in SNe with , but also the redder colors of these objects. Nevertheless, our discovery that SNe with “Blueshifted” Na I D profiles often show anomalously large Na I column densities taken together with the Foley et al. (2012b) finding that “Blueshifted” SNe Ia have systematically higher ejecta velocities and redder colors at maximum provides an alternative explanation to the EW(Na I D) vs. correlation that does not require a dusty CSM.
Recently, Maguire et al. (2013) presented single-epoch, intermediate-resolution () spectral observations for a sample of 17 SNe Ia, which they then combined with the sample of high-resolution spectra published by Sternberg et al. (2011). These authors confirmed the Sternberg et al. (2011) finding that an excess of events showed blueshifted structure in the Na I D lines, and also pointed out that the strength of the Na I D absorption was stronger in SNe Ia displaying blueshifted profiles than in those without such structure, in accordance with our own findings. In addition, Maguire et al. (2013) found that the strength of the blueshifted subcomponent of the D lines for those objects with blueshifted profiles was correlated with the colors of the SNe at maximum light. These findings were interpreted as being strongly suggestive of absorbing material (CSM) near the SN. Maguire et al. (2013) went on to speculate that SNe Ia with strong, blueshifted absorption may represent a distinct population of events produced preferentially in late-type galaxies.
In the upper right half of Figure 11, the column densities of the most prominent (deepest) component of the host Na I D absorption for each “Blueshifted” SN in our sample are plotted versus the values of inferred from the SN colors. The column densities were derived from the VPFIT results shown in Figures 1 and 2, and correspond to the zero velocity components. Following Maguire et al. (2013), we also plot in the lower right half of Figure 11 the sum of the column densities of the absorption components lying blueward of the most prominent component, again for the “Blueshifted” SNe in our sample.272727Note that rather than using the most prominent absorption component to define zero velocity, Maguire et al. (2013) employed galaxy emission or absorption lines observed in the SN Ia spectrum or, lacking this, the recessional velocity of the host galaxy. While both approaches have their merits, they do not result in significant differences in defining the blueshifted absorption components. In both cases, a general correlation is observed, but with considerable scatter. To quantify the goodness of fit to the Galactic vs. relationship (equation 4), we calculate the chi-squared per degree of freedom, , for several different samples in Table 4. In the case of the SNe, the calculation is done both including the objects with upper limits for , and excluding them. Note that all of the values are large — even for the Sembach et al. (1993) + Milky Way sample that was used to derive equation 4 — reflecting the large intrinsic dispersion in the vs. relation, which is considerably greater than the individual errors in the column densities. Interestingly, the value for the combined sample of “Redshifted” and “Single/Symmetric” SNe is similar to that of the Sembach et al. (1993) + Milky Way sample, implying that their column densities and dust extinctions are fully consistent with the Galactic relation. On the other hand, is very large for “Blueshifted” SNe, consistent with the significant number of objects with anomalously large values of . Table 4 shows that using either the column density of the most prominent (zero velocity) absorption component or the sum of the column densities of the absorption components blueward of zero velocity for the “Blueshifted” SNe gives values that, while lower than that obtained for the total column densities, are still relatively large. Our conclusion is that splitting the “Blueshifted” SNe into these two subsamples of the absorption components does not provide any particular insight into the location of the absorbing gas and dust.
If the strong Na I absorption is an indication of outflowing CSM, it is somewhat puzzling that the three “Blueshifted” SNe Ia in our sample that almost certainly had CSM — SNe 2006X, 2007le, and 2012cg — did not show unusually large Na I column densities for the host extinction implied by their colors (see Figure 3). Echelle spectroscopy of these three SNe revealed variations in the strengths of certain components of the Na I D lines (Patat et al., 2007; Simon et al., 2009; Raskutti et al., 2013). The evidence strongly suggests that the variations were due to changing ionization conditions in CSM, particularly since similar variations were not observed for the Ca II H & K lines. Multiple echelle spectra were not obtained for the majority of the SNe Ia in our sample, and so we do not know if more objects might have shown variable Na I absorption. An exception is SN 2008fp, one of the SNe with the strongest Na I lines. Cox & Patat (2013) did not find evidence for variability of any of the absorption components in this SN from echelle spectra obtained at +6, +11, +17, and +39 days after maximum light. Of course, whether or not variability is observed in any particular object will be a function of the density, distribution, and geometry of the CSM, and also the timing of the observations. Perhaps in the case of SN 2008fp, the variations were too small to detect or occurred before the first spectrum was obtained. High signal-to-noise ratio observations beginning at the earliest epochs will be necessary to make more progress on this question.
The rare class of 2002ic-like events that display a strong CSM interaction, for which a white dwarf with a massive AGB star companion (Hamuy et al., 2003) or a symbiotic nova (Dilday et al., 2012) have been proposed as progenitor systems, may be key objects for unraveling the CSM-progenitor connection. Echelle spectroscopy of the best-observed member of this class, PTF11kx (Dilday et al., 2012), obtained on four epochs ranging from to days with respect to optical maximum revealed strong variations in the strength of the most blueshifted component of the Na I D lines. Our analysis of these spectra gives a total column density of and a 3- upper limit of EW(5780) mÅ. Dilday et al. (2012) estimated a dust extinction of mag from the SN colors before the strong CSM interaction set in. These numbers place PTF11kx squarely on the Galactic vs. trend, and only slightly below the EW(5780) vs. relation.
4.4 SNe 2006cm, 2008fp, 2009ig, and 2009le
Three of the best-observed examples of “Blueshifted” SNe Ia in our sample with anomalously large Na I column densities are 2006cm, 2008fp, and 2009ig, In this section, we examine some of their properties in more detail along with those of the “Redshifted” SN 2009le.
SNe 2006cm and 2008fp were quite similar in their spectral and photometric characteristics. Both were substantially reddened by dust — and 0.58, respectively — and both showed strong, saturated Na I D host absorption. Figure 4 shows the Na I D1 and K I 7665 line profiles of these two SNe. Cox & Patat (2013) recently presented an in-depth study of the host interstellar absorption features in SN 2008fp. They found a rich spectrum of narrow atomic and molecular lines characteristic of a cold, translucent cloud, and argued that the host dust extinction for this SN is produced in this cloud. This system is responsible for the K I absorption at zero velocity in Figure 4 as well as the blue half of the strongly saturated component of the Na I D lines observed observed between and . In modeling the latter absorption “trough” with VPFIT, we have used not only the information provided by the K I lines, but also the results of Cox & Patat (2013) — in particular, the velocity and column density of the Na I UV 3302, 3303 doublet and the velocities of the two components of the Fe I absorption observed by these authors. The fits yield and for the “trough”. Measurement with VPFIT of the host Ca II H & K absorption over this same velocity range yields , typical of cold gas in the disk of the Milky Way (Siluk & Silk, 1974; Vallerga et al., 1993).
The evidence thus points to the ISM of the host galaxy of SN 2008fp as having produced at least a significant fraction of the strongly saturated Na I D lines. The origin of the blueshifted host absorption component at is less clear. We measure , , and . The latter value suggests that this absorption is not produced in a high velocity cloud since, in the Milky Way, these typically have (Siluk & Silk, 1974; Vallerga et al., 1993).
Cox & Patat (2013) also studied the host DIB lines in the spectrum of SN 2008fp, which they found to be slightly redshifted by 20 with respect to the strong atomic and molecular lines. This is consistent with our own measurement of the velocity of the host 5780 Å DIB in SN 2008fp which is very similar to the velocity of the most redshifted component that we infer for the Na I D lines (see Figure 4). However, the 5780 Å feature is broad (see Figure 6) and radial velocity measurements are likely to be sensitive to the exact profile used to determine the observed wavelength, which is not a simple Gaussian as we assume in this paper (Galazutdinov, Lo Curto, & Krełowski, 2008). The rest wavelength of the 5780 Å DIB is also not very accurately known, with the uncertainty corresponding to 10–15 in radial velocity (e.g., Galazutdinov et al., 2000; Tuairisg et al., 2000; Hobbs et al., 2008, 2009). Finally, the measured velocity of the DIB absorption will depend on the contributions of the various clouds in the line-of-sight, but this is impossible to decipher due to the significant width of the DIBs. Hence, the fact that the velocity of the 5780 Å DIB in SN 2008fp does not not coincide in redshift with the cloud responsible for the strongest component of the K I lines should probably not be given too much weight.
In the case of SN 2006cm, three absorption systems are observed for the K I 7665 line (see Figure 4). Using the velocities and values of these as a guide to fitting the Na I D lines, we find and for the strong absorption between and . As shown in Figure 4, the velocity measured for the host 5780 Å DIB falls near the center of the D line absorption. SN 2006cm was located only 2 arcsec from the center of its host, the edge-on Sb galaxy UGC 11723, and our spectrum contains weak, tilted emission lines of H and [N II] 6548,6584 along the slit, presumably due to diffuse ionized gas in the host. The FWHM velocity of this emission in the extracted spectrum of the SN is indicated in Figure 4, and closely coincides with the “trough” of Na I absorption.
SN 2009ig is especially interesting since its colors are consistent with little or no host reddening, yet its spectrum displays strong Na I D host absorption (see Figure 7). Three other SNe in our sample — 2002ha, 2007fb, and 2007kk — share this characteristic, and low-dispersion spectra have identified similar cases — e.g., SNe 2006dd and 2006mr in NGC 1316 (Stritzinger et al., 2010). The observed column density of Na I for SN 2009ig implies a dust extinction in the range 0.5–1.2 mag using the Milky Way relation given in §3, yet both the SN colors and the upper limit on the strength of the host absorption DIB at 5780 Å argue for mag. Host Ca II H & K absorption is also present in our spectrum at a ratio , typical of cold gas in the disk of the Milky Way (Siluk & Silk, 1974). Whatever the source (CSM or ISM) of the gas producing the strong Na I and Ca II absorption in this SN, the dust-to-gas ratio must be exceptionally low.
SN 2009le is a “Redshifted” SN Ia with a total host Na I column density more than 2- above the Galactic vs. relation. The lower-right plot in Figure 5 shows that it is similar to SN 2009ig in having a large host Na I column density, but relatively weak 5780 Å DIB feature. At , the ratio is somewhat high, although not extraordinarily so (see §4.5). Figure 12 shows the observed Na I D1 and K I 7665 profiles of SN 2009le, along with the VPFIT model. The host Na I absorption is quite unusual in covering in velocity space, more than any other SN in our sample. Weak emission lines of H, H, [N II] 6548,6584, and [S II] 6717,6731 are observed along the slit in the spectrum of the SN. The [N II] and [S II] flux ratios are both 0.7 and the [O III] 5007 line is not detected, suggesting that the ionized gas is reasonably metal-rich (Pettini & Pagel, 2004). The FWHM velocity range of the H and [N II] emission in the extracted spectrum of the SN is indicated in Figure 12, as is the heliocentric systemic velocity of 5,334 of the host galaxy ESO 478-G006 (Springob et al., 2005).
The Na I absorption extending from to in SN 2009le may be due to high velocity clouds in the host galaxy since for most of these components (Siluk & Silk, 1974; Vallerga et al., 1993), whereas the stronger absorption between and has , typical of cool dense gas in the disk of the Milky Way. We find for the zero velocity component, consistent with the Milky Way ratio. If we remove the high-velocity components from consideration, the host Na I column density decreases by only 0.1 dex, and so the strength of the D-line absorption in this SN remains strong, although not exceptionally so, for the amount of dust extinction implied by both the colors and the equivalent width of the 5780 Å DIB.
4.5 The Ratio
In the Milky Way ISM, the Na I and K I column densities are tightly correlated as would be expected based on ionization potentials and condensation temperatures (Welty & Hobbs, 2001). This is illustrated in the left half of Figure 13 which shows the measurements of Welty & Hobbs (2001) and Kemp et al. (2002). A fit to these data gives , with an rms dispersion of 0.3 dex. Kemp et al. (2002) argued from their observations that the value of the ratio actually increases slightly with column density as indicated by the thick black line in Figure 13. This is a small effect that is also clearly consistent with the data.
Included in Figure 13 are Na I and K I column density measurements in the LMC (Cox et al., 2006; Welty et al., 2006) and SMC (Welty et al., 2006), which give a slightly lower value of . This difference may be due to saturation effects as mentioned in §2.1 since the LMC and SMC values of were measured using the D lines, whereas the Galactic measurements of Welty & Hobbs (2001) and Kemp et al. (2002) were derived from the UV 3302, 3303 doublet for .
Our observations of the Milky Way sample in Table 1 are plotted in the right half of Figure 13, and give a weighted mean of with an rms of 0.3. This lower value is also likely due to saturation effects in the D lines. The weighted mean for the SN Ia host absorption sample is with an rms of 0.6. Excluding the three SNe with anomalously large Na I column densities — 2006cm, 2008fp, and 2009ig — lowers this to 1.6 with an rms of 0.3. The values for SNe 2006cm and 2008fp of 2.9 and 2.4, respectively, are significantly greater than the mean our spectra give for the Milky Way. Interestingly, however, the measurements for SNe 2009ig and 2009le are fully consistent with the Galactic ratio.
Kemp et al. (2002) argue on theoretical grounds that, for a cosmic abundance ratio of , standard values of the photoionization rate and recombination coefficients, and electron densities between 0.001–1 , the ratio should be in the range of 60–80. Although at low column densities a harder radiation field could lower the ratio close to the cosmic abundance value of 15, at the highest column densities (i.e., as the electron density approaches zero), the ratio should asymptotically approach a value of , or . Observations in the Milky Way show exactly this effect (see Figure 5 of Kemp et al. (2002)), although a few sight-lines reach values as large as .
Thus, the much higher values of –2.9 observed for the host absorption in SNe 2006cm and 2008fp imply either an enhancement of Na I or a depletion of K I. The fact that both the DIBs and K I column densities for these two objects are more consistent with the value of derived from the SN colors than are the Na I column densities would seem to suggest that an enhanced abundance of Na I is the more likely explanation. More observations of the K I doublet in SNe Ia are needed to determine if the large ratios observed for SNe 2006cm and 2008fp are a common characteristic of SNe Ia with anomalously strong Na I D lines, or whether most, like SNe 2009ig and 2009le, show normal ratios.
4.6 Possible Origins of the Strong Na I D Absorption
Although one-fourth of the SNe Ia in our sample displayed anomalously large host Na I column densities in comparison with dust reddening deduced from their colors, the observations provide conflicting clues as to the origin of this phenomenon. The fact that all such SNe have “Blueshifted” D-line profiles as classified by Sternberg et al. (2011) is highly suggestive that an outflowing CSM is responsible for the strong Na I absorption. The existence of events such as SN 2009ig that were essentially unreddened, as indicated by both their colors and the weakness of the DIB 5780 Å absorption, yet showed strong host Na I D lines is also difficult to understand in the ISM scenario. Nevertheless, as discussed in § 4.4, the evidence seems to clearly favor an ISM origin for most, if not all, of the strong D-line absorption observed in SN 2008fp, and, as detailed in § 4.3, unusually strong Na I D lines have not been observed in the few SNe Ia studied to date for which there is independent evidence for the existence of CSM.
If all SNe Ia have the same progenitor systems, and if the anomalously large host Na I column densities are due to CSM, then we would expect to see strong D-line absorption in at least some of the SNe Ia that occur in elliptical galaxies (i.e., where there is no significant ISM). Unfortunately, only one of the SNe in our sample (2007on) occurred in a host galaxy that is classified as an elliptical. Sternberg et al. (2011) obtained high-dispersion spectra of an additional two SNe Ia (2006ct and 2006eu) in elliptical galaxies. In none of these three cases was Na I absorption detected. It is important to continue to obtain echelle spectra of more SNe Ia in nearby ellipticals to build up a statistically-significant sample. If it is found that SNe Ia in elliptical hosts never show strong Na I D lines, that would in turn imply that either the large Na I column densities seen in some SNe Ia are not due to CSM, or the progenitors of SNe Ia in elliptical galaxies are fundamentally different from (or, are a subset of) those in later-type galaxies. Some support for the latter hypothesis is found in the observation that early-type galaxies tend to produce a factor of 20 less SNe Ia (normalized to stellar mass) than do late-type galaxies (Mannucci et al., 2005), and that these SNe are, on average, faster-declining and less-luminous than those observed in spirals (Hamuy et al., 1995, 1996).
Novae have long been considered to be possible progenitors of some SNe Ia, and there is evidence, both observational and theoretical, that highly enhanced Na is produced in the thermonuclear runaway that powers novae outbursts. In a review of abundance determinations for novae, Gehrz et al. (1998) identified several novae whose Na abundances were derived from emission-line analysis to be more than an order of magnitude enhanced over solar values. It is therefore possible in the SD scenario that very high Na abundances in SNe Ia might be understood in terms of their having been produced in prior nova outbursts in progenitors whose eventual collapse formed the supernovae.
Giant stars in globular clusters show large Na abundance enhancements that are not observed in field giants (e.g., see Sneden et al., 2004, and references therein). The Na and O abundances are anti-correlated, consistent with proton-capture fusion processes during CNO burning. These abundance variations most likely result from pollution by an earlier generation of more massive stars. Similar star-to-star abundance variations in C, N, O and Na have been observed in stars at or near the main-sequence turn-off (Gratton et al., 2001; Ramírez & Cohen, 2003; James et al., 2004; Cohen & Meléndez, 2005; Cohen et al., 2005), in support of the self-pollution scenario as first proposed by Cottrell & Da Costa (1981). Perhaps, then, the “Blueshifted” profiles and anomalously large Na I column densities (with respect to K I) observed in SNe Ia such as 2006cm and 2008fp point to a SD progenitor system with a massive asymptotic giant branch (AGB) star as the donor star.
The stellar yields of Na from intermediate-mass AGB stars of solar metallicity show only relatively minor enhancements of 0.2–0.4 dex (Karakas, 2010; Karakas et al., 2012). This is down from the results published in Karakas & Lattanzio (2007), which predict yields of Na that are up to a factor of higher (for a 6, model). The cause of the variation is the use of revised experimental reaction rates for the 23Na reactions (see discussion in Karakas, 2010). Karakas et al. (2012) varied the mass-loss rate and reaction rates, key uncertainties in AGB nucleosynthesis calculations of intermediate-mass stars. They find that the only way to obtain Na enrichments of dex is to use the old rates for the 23Na reactions combined with a lower mass-loss rate in stars of mass 5–7 at . In summary, fine-tuning of model parameters is required in order to produce substantial Na enrichment ( dex) in the wind.
There is another way to obtain substantial enrichments in Na. Most of the Na produced during the AGB phase remains in the core of the star. Sodium is produced by H-shell burning but it is not destroyed by -captures during helium burning. For this reason, a reservoir of Na builds up in the outer layers of the H-exhausted core and only a small fraction of this is mixed to the surface where it can be lost by stellar winds. By the beginning of the AGB phase, the amount of Na is times the initial value in the outer layers of the core. This is a robust prediction that does not depend on reaction rates or initial stellar mass, and is found for a range of masses from 1.9-7 at . By the end of the AGB phase, this increases to 8 to 30 times the initial Na, depending on the details of AGB evolution. Higher values are in fact found in the lowest mass AGB star cores of . This is because of the formation of a 13C pocket, a necessary ingredient for the production of -process elements (see e.g., Mowlavi, 1999; Cristallo et al., 2009; Karakas, 2010). The Na produced in this manner will remain in the white dwarf (WD) after the AGB phase ends. This means that less fine tuning is required to produce substantial Na enrichment in SNe Ia with DD progenitors, assuming some of the material from the outer layers of the disrupted WD can form CSM (Raskin & Kasen, 2013; Shen et al., 2013). If the WD merger involves a He WD plus a C-O WD, then stellar models also predict Na enhancements of a factor of 7 spread over a larger of the helium core282828From a 1.9 stellar model of which produces a 0.45 helium core at the tip of the RGB..
4.7 Location of the Dust and the Nature of the Low Values of
Our finding that the strength of the DIB at 5780 Å correlates well with the dust extinction derived from the SN Ia colors provides an important clue to the location of the dust. DIBs are weak or absent in the CSM of nearly all mass-losing stars, including post-AGB stars (Le Bertre & Lequeux, 1993; Luna et al., 2008). Most likely this means that either the molecular carriers responsible for the DIBs are not present in the CSM, or that the excitation conditions are not what is required to produce observable absorption. If the latter were true, it is conceivable that a SN Ia exploding within a dusty CSM might produce the conditions to make DIBs visible. However, with the exception of SN 1986G which may have been located behind the dust lane of NGC 5128, all of the significantly reddened SNe Ia in our sample exploded in the dusty disks of their host galaxies. Thus, the simplest and most obvious interpretation of the correlation of EW(5780) Å with is that most of the dust extinction is interstellar in origin, and is not produced in CSM associated with the SN progenitor system.
The very low values of that seem to characterize the dust reddening in many SNe Ia are unusual in the Milky Way, but not completely without precedent. A well-studied example is the B3 V star, HD 210121 for which photometry and spectropolarimetry give (Larson, Whittet, & Hough, 1996; Fitzpatrick & Massa, 2007). The dust reddening of this star is produced by a translucent molecular cloud at high Galactic latitude characterized by an enhanced relative abundance of small grains and a dust-to-gas ratio 30% smaller than the standard Galactic value (Larson et al., 2000). Similarly low values of have been observed in a few other high Galactic latitude clouds (Larson & Whittet, 2005) and toward the Galactic bulge (Udalski, 2003; Nataf et al., 2013). In their study of anomalous extinction sight-lines, Mazzei & Barbaro (2011) list two stars with (HD 1337) and (HD 137569). Nevertheless, such extreme values are rare in the solar neighborhood. In their study of 328 Galactic extinction curves of O and B stars at a median distance of kpc, Fitzpatrick & Massa (2007) found that less than 3% had .
For comparison, four of the five SNe Ia in our sample with had . The average value of for these four SNe is 1.4. Such unusually low values led Wang (2005) and Goobar (2008) to suggest that for these reddened SNe Ia is modified by multiple scattering of photons in a dusty CSM which effectively steepens the extinction law. However, this idea appears to be at odds with our finding that the dust extinction is largely produced in the ISM. A possible exception is the heavily-reddened SN 2006X, for which our measurement of the upper limit on the strength of the 5780 Å DIB lies significantly below the EW(5780) vs. relation in the Milky Way (see Figure 5). As mentioned in §4.3, SN 2006X showed variable Na I D absorption, and thus almost surely had CSM. Evidence in favor of the dust reddening being produced in the CSM of this SN was reported by Folatelli et al. (2010), who found that the reddening was better matched by a Goobar (2008) model than a normal reddening law.
Alternatively, the weak DIB absorption in SN 2006X may be a consequence of conditions in the ISM. A recent survey of sight-lines in the Scorpius OB2 association by Vos et al. (2011) showed that the correlation of the 5780 Å DIB with reddening is different for a diffuse environment exposed to a strong ultraviolet (UV) radiation field with low molecular content, as opposed to a denser cloud protected from the impinging interstellar UV radiation. The relations plotted in Figure 5 correspond more to the “UV exposed” trend, whereas the observations indicate that SN 2006X exploded behind a dense molecular cloud (Cox & Patat, 2008) which may have probed a “UV protected” environment characterized by a shallower dependence of EW(5780) on (Vos et al., 2011). This may explain why SN 2006X falls below the general trend seen in Figure 5.
An independent test of the values of derived from the SN colors is provided by spectropolarimetric measurements, since the wavelength of maximum polarization is well-correlated with (Sarkowsky et al., 1975; Whittet & van Breda, 1978; Clayton & Mathis, 1988). Using this technique, Hough et al. (1987) found for SN 1986G, which compares quite well with our value of derived from the optical and NIR light curves. Spectropolarimetry of SN 2001el by Wang et al. (2003) gave , which is in fair agreement with our value of . More recently, Patat et al. (2009) obtained spectropolarimetry of SN 2006X, for which the SN colors imply . A strongly-polarized continuum was observed, peaking at Å, consistent with . Moreover, the angle of the interstellar polarization was found to be tangential to the dust lane associated with the spiral arm close to the explosion site, in keeping with observations that dust grains in the ISM of disk galaxies are aligned along the spiral arm pattern (e.g., Scarrot et al., 1987). These results imply that the majority of the dust reddening of SN 2006X was produced in the ISM.
We conclude, therefore, that the low values of observed for these reddened SNe Ia reflect the dust properties of the ISM in the neighborhood of the SN progenitor. The fact that we find for such a large fraction of reddened events is clearly telling us something important about both the environment and nature of the SN progenitors, many of which exploded in the dusty, inner regions of spiral galaxies. In turn, SN observations appear to provide a powerful new means of studying the extreme dust properties found in at least some spirals.
5 CONCLUSIONS
The observations in this paper lead us to two important conclusions about SNe Ia. The first of these is that the dust responsible for the observed reddening of SNe Ia appears to be predominantly located in the ISM of the host galaxies and not in CSM associated with the progenitor system. This conclusion is based on both the correlation found between the strength of the DIB at 5780 Å and the visual extinction, , derived from the SN colors, and the fact that DIBs are a characteristic of the ISM in our Galaxy, and not the CSM of mass losing stars. A direct implication of this finding is that the peculiarly-low values of derived for the most reddened SNe Ia are not generally due to multiple scattering of photons in a dusty CSM as suggested by Wang (2005) and Goobar (2008), but rather are characteristic of the properties of the dust in the ISM where the SNe exploded. Of course, we cannot rule out the presence of some dust in the CSM, but the evidence is consistent with the majority of reddening being produced in the host galaxy ISM.
The second major conclusion of this paper is that approximately one quarter of all SNe Ia show anomalously large host Na I column densities in comparison with the amount of dust that reddens their spectra. This result is based on comparison with the correlation between the Na I column density and observed in the Milky Way, but similar correlations are also observed for the Magellanic Clouds where the ISM is of significantly lower metallicity. Remarkably, all of the SNe with unusually strong D lines have “Blueshifted” profiles in the classification scheme of Sternberg et al. (2011). It is tempting, therefore, to ascribe the anomalous strength of the Na I to outflowing CSM, especially since strong D lines are observed in several SNe Ia that did not suffer significant dust reddening. We have identified ways of producing enhanced Na abundances in the CSM in both the SD and DD progenitor models. Nevertheless, unusually strong Na I D lines have not been observed in the few SNe Ia studied to date for which there is independent evidence for the existence of CSM, casting some doubt on the CSM interpretation.
Our observations show that the column density and/or equivalent width of the Na I D lines are, in general, unreliable indicators of the dust extinction suffered by SNe Ia. The exception to this statement is that weak or undetectable Na I absorption appears to be consistent with little or no extinction. We find that a better predictor of individual SN Ia extinction is the equivalent width of the DIB at 5780 Å, although this method requires moderate resolution (), high signal-to-noise ratio spectra, and yields host values with a precision of only 50%.
Obviously there are many details of the CSM versus ISM puzzle left to resolve. Nevertheless, high-dispersion spectroscopy has revealed a number of critical clues to the nature of SN Ia progenitors, including the discovery of variable Na I absorption, the excess of blueshifted absorbers, the connection between blueshifted absorption and ejecta velocities, and now the correlation of blueshifted absorption with Na-rich gas and the finding that the extinction affecting the SN light curves arises in the host galaxy ISM. Larger samples of such observations combined with optical and near-infrared light curves seem likely to shed further light on the physical mechanism responsible for these apparently related phenomena.
References
- Astier et al. (2006) Astier, P., Guy, J., Regnault, N., et al. 2006, A&A, 447, 31
- Bernstein et al. (2003) Bernstein, R., et al. 2003, Proc. SPIE, 4841, 1694
- Blondin et al. (2009) Blondin, S., Prieto, J. L., Patat, F., et al. 2009, ApJ, 693, 207
- Bloom et al. (2012) Bloom, J. S., Kasen, D., Shen, K. J. et al. 2012, ApJ, 744, L17
- Bouret et al. (2003) Bouret, J.-C., Lanz, T., Hillier, D. J., et al. 2003, ApJ, 595, 1182
- Burns et al. (2011) Burns, C., et al. 2011, AJ, 141, 19
- Burns et al. (2013) Burns, C., et al. 2013, in preparation
- Cardelli et al. (1989) Cardelli, J. A., Clayton, G. C., & Mathis, J. S. 1989, ApJ, 345, 245
- Clayton & Mathis (1988) Clayton, G. C., & Mathis, J. S. 1988, ApJ, 327, 911
- Cohen et al. (2005) Cohen, J. G., Briley, M. M., & Stetson, P. B. 2005, AJ, 130, 1177
- Cohen & Kirby (2012) Cohen, J. G., & Kirby, E. N. 2012, ApJ, 760, 86
- Cohen & Meléndez (2005) Cohen, J. G. & Meléndez, J. 2005, AJ, 129, 303
- Conley et al. (2007) Conley, A., Carlberg, R. G., Guy, J., et al. 2007, ApJ, 664, L13
- Contreras et al. (2010) Contreras, C., Hamuy, M., Phillips, M. M., et al. 2010, AJ, 139, 519
- Cordiner et al. (2011) Cordiner, M. A., Cox, N. L. J., Evans, C. J., et al. 2011, ApJ, 726, 39
- Cottrell & Da Costa (1981) Cottrell, P. L. & Da Costa, G. S. 1981, ApJ, 245, L79
- Cox et al. (2008) Cox, N. L. J., & Cordiner, M. A. 2008, in IAU Symp. 251, Organic Matter in Space, ed. S. Kwok (Cambridge: Cambridge Univ. Press), 237
- Cox et al. (2006) Cox, N. L. J., Cordiner, M. A., Cami, J., et al. 2006, A&A, 447, 991
- Cox et al. (2007) Cox, N. L. J., Cordiner, M. A., Ehrenfreund, P., et al. 2007, A&A, 470, 941
- Cox & Patat (2008) Cox, N. L. J., & Patat, F. 2008, A&A, 485, L9
- Cox & Patat (2013) Cox, N. L. J., & Patat, F. 2013, A&A, submitted
- Cristallo et al. (2009) Cristallo, S., Straniero, O., Gallino, R., et al. 2009, ApJ, 696, 797
- Dilday et al. (2012) Dilday, B., Howell, D. A., Cenko, S. B., et al. 2012, Science, 337, 942
- D’Odorico et al. (1989) D’Odorico, S., di Serego Alighieri, S., Pettini, M., et al. 1989, A&A, 215, 21
- Dufour (1984) Dufour, R. J. 1984, IAU Symp. 108, 353
- Fitzpatrick & Massa (2007) Fitzpatrick, E. L., & Massa, D. 2007, ApJ, 663, 320
- Folatelli et al. (2010) Folatelli, G., Phillips, M. M., Burns, C. R., et al. 2010, AJ, 139, 120
- Foley et al. (2012a) Foley, R., Challis, P. J., Filippenko, A. V., et al. 2012a, ApJ, 744, 28
- Foley & Kasen (2011) Foley, R. J., & Kasen, D. 2011, ApJ, 729, 55
- Foley et al. (2012b) Foley, R., Simon, J. D., Burns, C. R., et al. 2012b, ApJ, 752, 101
- Förster et al. (2012) Förster, F., Gonz lez-Gait n, S., Anderson, J., et al. 2012, ApJ, 754, L21
- Frogel et al. (1987) Frogel, J. A., Gregory, B., Kawara, K., et al. 1987, ApJ, 315, L129
- Friedman et al. (2011) Friedman, S. D., York, D. G., McCall, B. J., et al. 2011, ApJ, 727, 33
- Galazutdinov, Lo Curto, & Krełowski (2008) Galazutdinov, G. A., Lo Curto, G., & Krełowski, J. 2008, MNRAS, 386, 2003
- Galazutdinov et al. (2000) Galazutdinov, G. A., Musaev, F. A., Krełowski, J., Walker, G. A. 2000, PASP, 112, 648
- Ganeshalingam et al. (2010) Ganeshalingam, M., Li, W., Filippenko, A. V., et al. 2010, ApJS, 190, 418
- Gehrz et al. (1998) Gehrz, R. D., Truran, J. W., Williams, R. E., & Starrfield, S. 1998, PASP, 110, 3
- Goobar (2008) Goobar, A. 2008, ApJ, 686, L103
- Gordon et al. (2003) Gordon, K. D., Clayton, G. C., Misselt, K. A., et al. 2003, ApJ, 594, 279
- Gratton et al. (2001) Gratton, R. G., Bonifacio, P., Bragaglia, A., et al. 2001, A&A, 369, 87
- Gutiérrez et al. (2011) Gutiérrez, C., Folatelli, G., Pignata, G., et al. 2011, Buletín Asociación Argentina de Astronomía, 54, 109
- Hamuy et al. (1995) Hamuy, M., Phillips, M. M., Maza, J., et al. 1995, AJ, 109, 1
- Hamuy et al. (1996) Hamuy, M., Phillips, M. M., Suntzeff, N. B., et al. 1996, AJ, 112, 2391
- Hamuy et al. (2006) Hamuy, M., Folatelli, G., Morrell, N. I., et al. 2006, PASP, 118, 2
- Hamuy et al. (2003) Hamuy, M., Phillips, M. M., Suntzeff, N. B., et al. 2003, Nature, 424, 651
- Heckman & Lehnert (2000) Heckman, T. M., & Lehnert, M. D. 2000, ApJ, 537, 690
- Herbig (1993) Herbig, G. H. 1993, ApJ, 407, 142
- Hicken et al. (2009a) Hicken, M., Challis, P.; Jha, S., et al. 2009a, ApJ, 700, 331
- Hicken et al. (2012) Hicken, M., Challis, P., Kirshner, R. P., et al. 2012, ApJS, 200, 12
- Ho & Filippenko (1995) Ho, L. C., & Filippenko, A. V. 1995, ApJ, 444, 165 [Erratum: 1996, ApJ, 463, 818]
- Hobbs (1974) Hobbs, L. M. 1974, ApJ, 191, 381
- Hobbs et al. (2008) Hobbs, L. M., York, D. G., Snow, T. P., et al. 2008, ApJ, 680, 1256
- Hobbs et al. (2009) Hobbs, L. M., York, D. G., Thorburn, J. A., et al. 2009, ApJ, 705, 32
- Horesh et al. (2012) Horesh, A., Kulkarni, S. R., Fox, D. B., et al. 2012, ApJ, 746, 21
- Hough et al. (1987) Hough, J. H., Bailey, J. A., Rouse, M. F., & Whittet, D. C. B. 1987, MNRAS, 227, P1
- Howell (2011) Howell, D. A. 2011, NatCo, 2, 350
- James et al. (2004) James, G., François, P., Bonifacio, P., et al. 2004, A&A, 414, 1071
- Junkkarinen et al. (2004) Junkkarinen, V. T., Cohen, R. D., Beaver, E. A., et al. 2004, ApJ, 614, 658
- Karakas (2010) Karakas, A. I. 2010, MNRAS, 403, 1413
- Karakas et al. (2012) Karakas, A. I., García-Hernández, D. A., & Lugaro, M. 2012, ApJ, 751, 8
- Karakas & Lattanzio (2007) Karakas, A. I. & Lattanzio, J. C. 2007, PASA, 24, 103
- Kemp et al. (2002) Kemp, S. N., Bates, B., Beckman, J. E., et al. 2002, MNRAS, 333, 561
- Kessler et al. (2009) Kessler, R., Becker, A. C., Cinabro, D., et al. 2009, ApJ, 185, 32
- Krisciunas et al. (2003) Krisciunas, K., Suntzeff, N. B., Candia, P., et al. 2003, AJ, 125, 166
- Krisciunas et al. (2004) Krisciunas, K., Suntzeff, N. B., Phillips, M. M., et al. 2004, AJ, 128, 3034 [Erratum: 2005, AJ, 130, 350]
- Larson & Whittet (2005) Larson, K. A., & Whittet, D. C. B. 2005, ApJ, 623, 897
- Larson, Whittet, & Hough (1996) Larson, K. A., Whittet, D. C. B., & Hough, J. H. 1996, ApJ, 472, 755
- Larson et al. (2000) Larson, K. A., Wolff, M. J., Roberge, W. G., et al. 2000, ApJ, 532, 1021
- Le Bertre & Lequeux (1993) Le Bertre, T., & Lequeux, J. 1993, A&A, 274, 909
- Luna et al. (2008) Luna, R., Cox, N. L. J., Satorre, M. A., et al. 2008, A&A, 480, 133
- Maeda et al. (2010) Maeda K., Benetti, S., Stritzinger, M., et al., 2010, Nature, 466, 82
- Maeda et al. (2011) Maeda K., Leloudas, G., Taubenberger, S., et al., 2011, MNRAS, 413, 3075
- Maguire et al. (2013) Maguire, K., Sullivan, M., Patat, F., et al. 2013, arXiv:1308.3899
- Mannucci et al. (2005) Mannucci, F., Della Valle, M., Panagia, N., et al. 2005, A&A, 433, 807
- Maoz & Mannucci (2012) Maoz, D., & Mannucci, F. 2012, PASA, 29, 447
- Matheson et al. (2012) Matheson, T., Joyce, R. R., Allen, L. E., et al. 2012, ApJ, 754, 19
- Mazzei & Barbaro (2011) Mazzei, P., & Barbaro, G. 2011, A&A, 527, 34
- Merrill & Wilson (1938) Merrill, P. W., & Wilson, O. C. 1938, ApJ, 87, 9
- Moore & Bildsten (2012) Moore, K., & Bildsten, L. 2012, ApJ, 761, 182
- Mowlavi (1999) Mowlavi, N. 1999, A&A, 350, 73
- Munari & Zwitter (1997) Munari, U., & Zwitter, T. 1997, A&A, 318, 269
- Nataf et al. (2013) Nataf, D. M., Gould, A., Fouqué, P., et al. 2013, ApJ, 769, 88
- Patat (2005) Patat, F. 2005, MNRAS, 357, 1161
- Patat (2013) Patat, F. 2013, in Binary Paths to Type Ia Supernovae Explosions, Proceedings of the International Astronomical Union, IAU Symposium, Vol. 281, 291
- Patat et al. (2009) Patat, F., Baade, D., Höflich, P., et al. 2009, A&A, 508, 229
- Patat et al. (2007) Patat, F., Chandra, P., Chevalier, R., et al. 2007, Science, 317, 924
- Patat et al. (2013) Patat, F., Cordiner, M. A., Cox, N. L. J., et al. 2013, A&A, 549, 62
- Peimbert & Torres-Peimbert (1976) Peimbert, M., & Torres-Peimbert, S. ApJ, 203, 581
- Pettini & Pagel (2004) Pettini, M., & Pagel, B. E. J. 2004, MNRAS, 348, L59
- Phillips (1993) Phillips, M. M. 1993, ApJ, 413, L105
- Phillips (2012) Phillips, M. M. 2012, PASA, 29, 434
- Phillips et al. (1987) Phillips, M. M., Phillips, A. C., Heathcote, S. R., et al. 1987, PASP, 99, 592
- Poznanski et al. (2011) Poznanski, D., Ganeshalingam M., Silverman J. M., & Filippenko, A. V. 2011, MNRAS, 415, L81
- Poznanski et al. (2012) Poznanski, D., Prochaska, J. X., & Bloom, J. S. 2012, MNRAS, 426, 1465
- Ramírez & Cohen (2003) Ramírez, S. V. & Cohen, J. G. 2003, AJ, 125, 224
- Raskin & Kasen (2013) Raskin, C., & Kasen, D. 2013, arXiv:1304.4957
- Raskutti et al. (2013) Raskutti, S., et al. 2013, in preparation
- Richmond et al. (1995) Richmond, M. W., Treffers, R. R., Filippenko, A. V., et al. 1995, AJ, 109, 2121
- Richmond & Smith (2012) Richmond, M. W., & Smith, H. A. 2012, arXiv:1203.4013
- Rolleston, Trundle, & Dufton (2002) Rolleston, W. R. J., Trundle, C., & Dufton, P. L. 2002, A&A, 396, 53
- Sarkowsky et al. (1975) Sarkowsky, K., Mathewson, D. S., & Ford, V. L. 1975, ApJ, 196, 261
- Sarre (2006) Sarre, P. J. 2006, JMoSp, 238, 1
- Scarrot et al. (1987) Scarrot, S. M., Ward-Thompson, D., & Warren-Smith, R. F. 1987, MNRAS, 224, 299
- Schlafly & Finkbeiner (2011) Schlafly, E. F., & Finkbeiner, D. P. 2011, ApJ, 737, 103
- Schlegel et al. (1998) Schlegel, D. J., Finkbeiner, D. P., & Davis, M. 1998, ApJ, 500, 525
- Schweizer et al. (2008) Schweizer, F., Burns, C. R., Madore, B. F., et al. 2008, AJ, 136, 1482
- Scolnic et al. (2013) Scolnic, D. M., Riess, A. G., Foley, R. J., et al. 2013, arXiv:1306.4050
- Sembach et al. (1993) Sembach, K. R., Danks, A. C., & Savage, B. D. 1993, A&AS, 100, 107
- Shen et al. (2013) Shen, K. J., Guillochon, J., & Foley, R. J. 2013, arXiv:1302.2916
- Silverman et al. (2012) Silverman, J. A., Ganeshalingam, M., Cenko, S. B., et al. 2012, ApJ, 756, L7
- Siluk & Silk (1974) Siluk, R. S., & Silk, J. 1974, ApJ, 192, 51
- Simon et al. (2009) Simon, J. D., Gal-Yam, A., Gnat, O., et al. 2009, ApJ, 702, 1157
- Sneden et al. (2004) Sneden, C., Ivans, I. I., & Fulbright, J. P. 2004, in Carnegie Observatories Astrophysics Series, Vol. 4: Origin and Evolution of the Elements, ed. A. McWilliam and M. Rauch (Cambridge: Cambridge Univ. Press), 170
- Sollerman et al. (2005) Sollerman, J., Cox, N., Mattila, S., et al. 2005, A&A, 429, 559
- Sparks, Carollo, & Macchetto (1997) Sparks, W. B., Carollo, C. M., & Macchetto, F. 1997, ApJ, 486, 253
- Springob et al. (2005) Springob, C. M., Haynes, M. P.,, Giovanelli, R., & Kent, B. R. 2005, ApJS, 160, 149
- Starrfield et al. (1993) Starrfield, S., Truran, J. W., Politano, M., et al. 1993, Phys. Rept., 227, 223
- Sternberg et al. (2011) Sternberg, A., Gal-Yam, A., Simon, J. D., et al. 2011, Science, 333, 856
- Stritzinger et al. (2010) Stritzinger, M., Burns, C. R., Phillips, M. M., et al. 2010, AJ, 140, 2036
- Stritzinger et al. (2011) Stritzinger, M., Phillips, M. M., Boldt, L. N., et al. 2011, AJ, 142, 156
- Tripp (1998) Tripp, R. 1998, A&A, 331, 815
- Tuairisg et al. (2000) Tuairisg, S. Ó., Cami, J., Foing, B. H., Sonnentrucker, P., Ehrenfreund, P. 2000, A&AS, 142, 225
- Turatto et al. (2003) Turatto, M., Benetti, S., & Capellaro, E. 2003, in From Twilight to Highlight: The Physics of Supernovae, ed. W. Hillebrandt and B. Leibundgut (Berlin: Springer-Verlag), 200
- Udalski (2003) Udalski, A. 2003, ApJ, 590, 284
- Vallerga et al. (1993) Vallerga, J. V., Vedder, P. W., Craig, N., & Welsh, B. Y. 1993, ApJ, 411, 729
- Ventura & D’Antona (2008) Ventura, P., & D Antona, F. 2008, A&A, 479, 805
- Vos et al. (2011) Vos, D. A. I., Cox, N. L. J., Kaper, L., Spaans, M., & Ehrenfreund, P. 2011, A&A, 533, 129
- Wang et al. (2003) Wang, L., Baade, D., Höflich, P., et al. 2003, ApJ, 591, 1110
- Wang (2005) Wang, L. 2005, ApJ, 635, L33
- Wang et al. (2013) Wang, X., Wang, L., Filippenko, A. V., Zhang, T., & Zhao, X. 2013, Science, 340, 170
- Welsh et al. (2010) Welsh, B. Y., Lallement, R., Vergely, J.-L., & Raimond, S. 2010, A&A, 510, 54
- Welty & Hobbs (2001) Welty, D. E., & Hobbs, L. M. 2001, ApJS, 133, 345
- Welty et al. (2006) Welty, D. E., Federman, S. R., Gredel, R., Thorburn, J. A., & Lambert, D. L. 2006, ApJS, 165, 138
- Whittet & van Breda (1978) Whittet, D. C. B., & van Breda, I. G. 1987, A&A, 66, 57
- Yaron & Gal-Yam (2012) Yaron, O., & Gal-Yam, A. 2012, PASP, 124, 668
- York et al. (2006) York, B. A., Ellison, S. L., Lawton, B., et al. 2006, ApJ, 647 L29
- Yuan & Liu (2012) Yuan, H. B., & Liu, X. W. 2012, MNRAS, 425, 1763
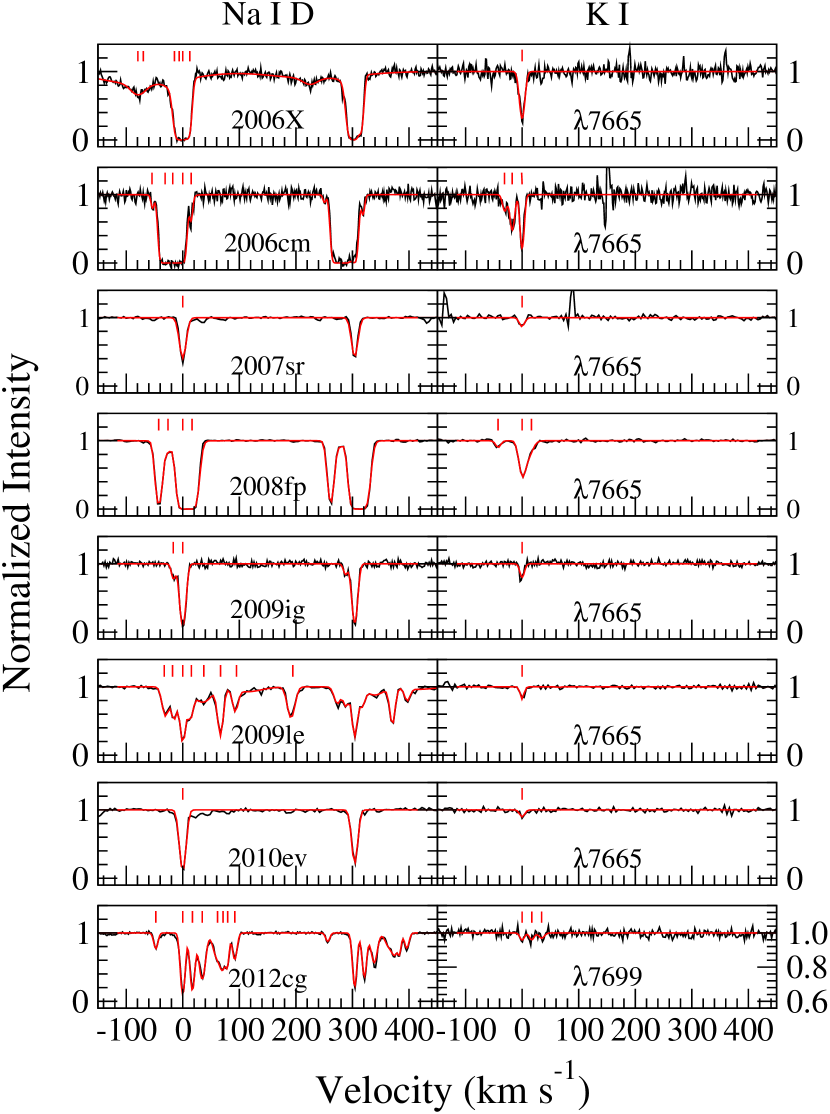
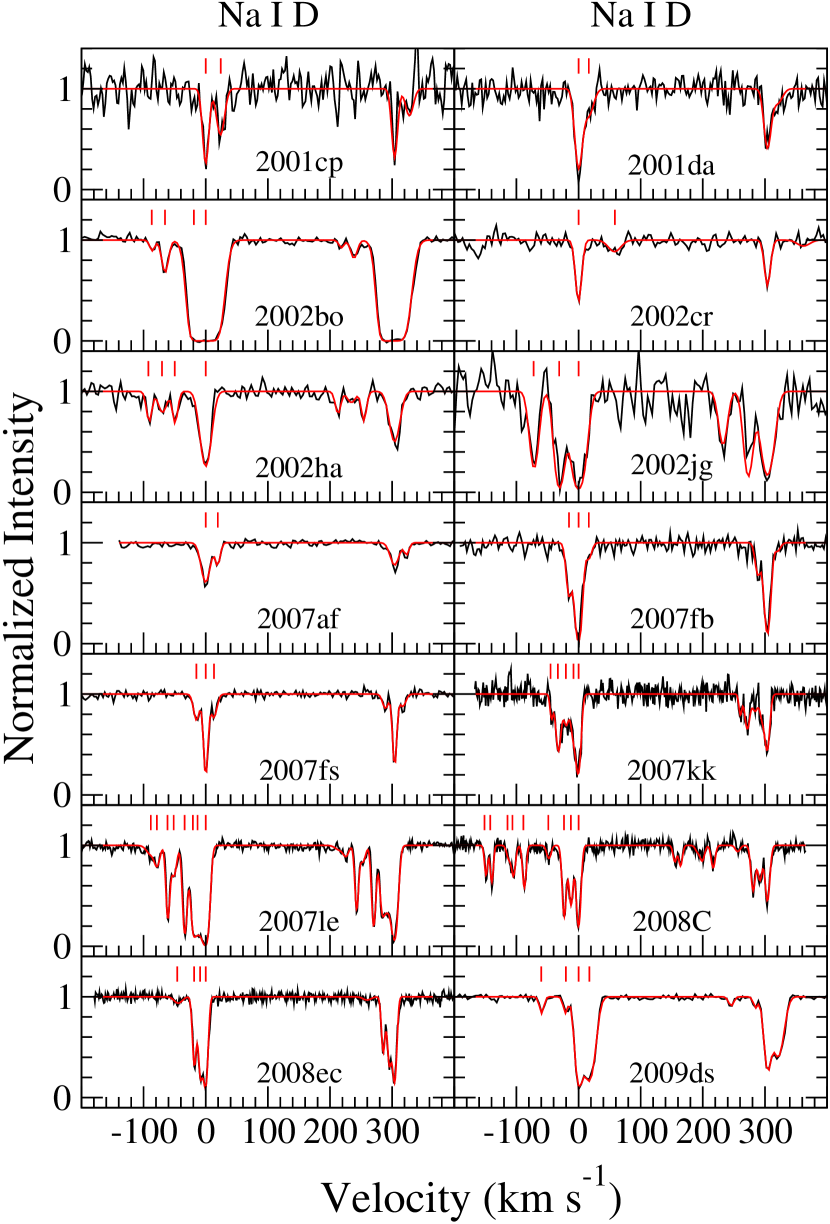
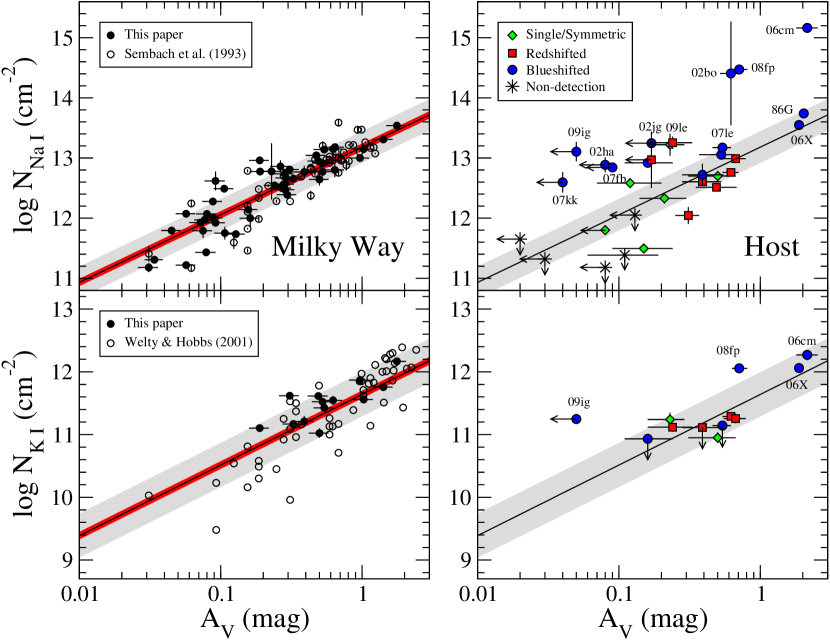
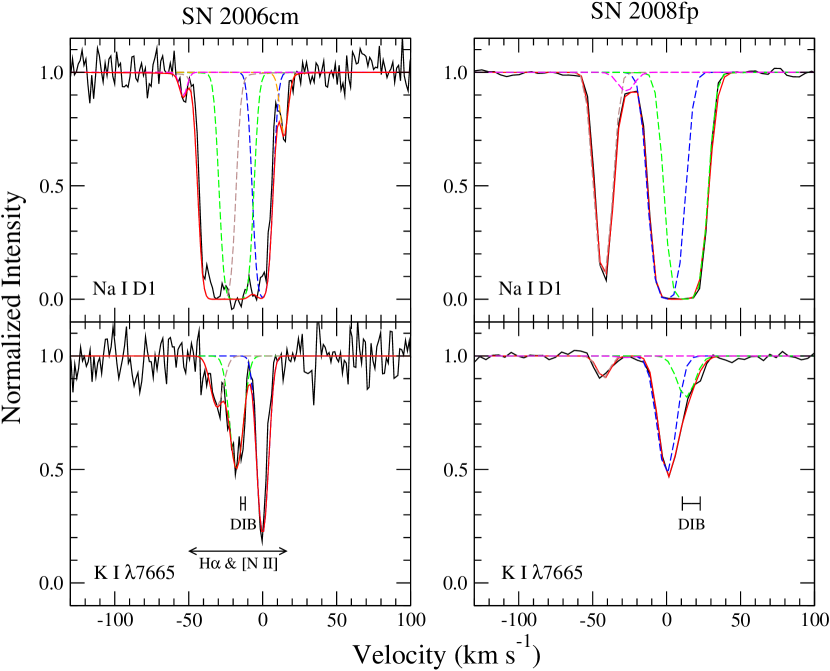
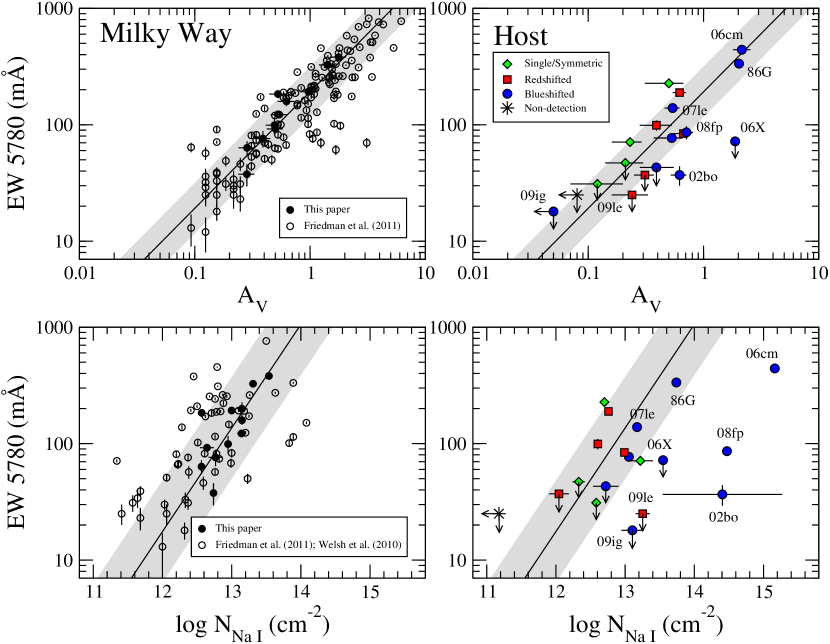
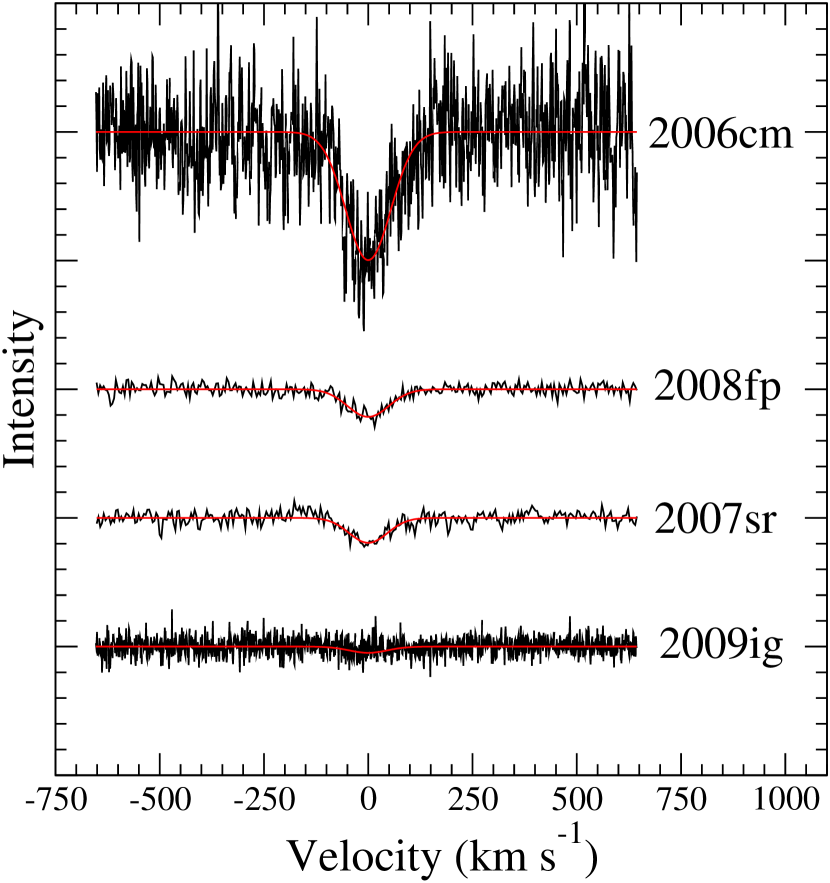
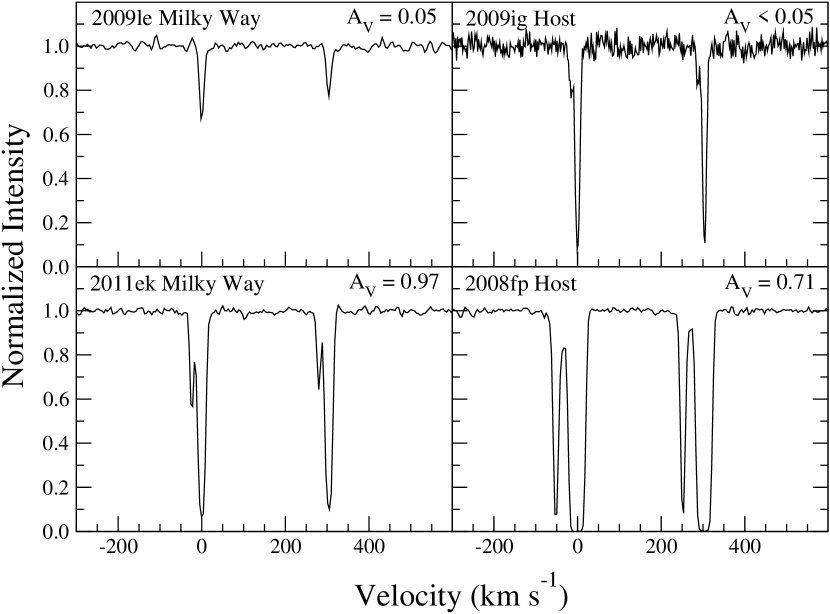
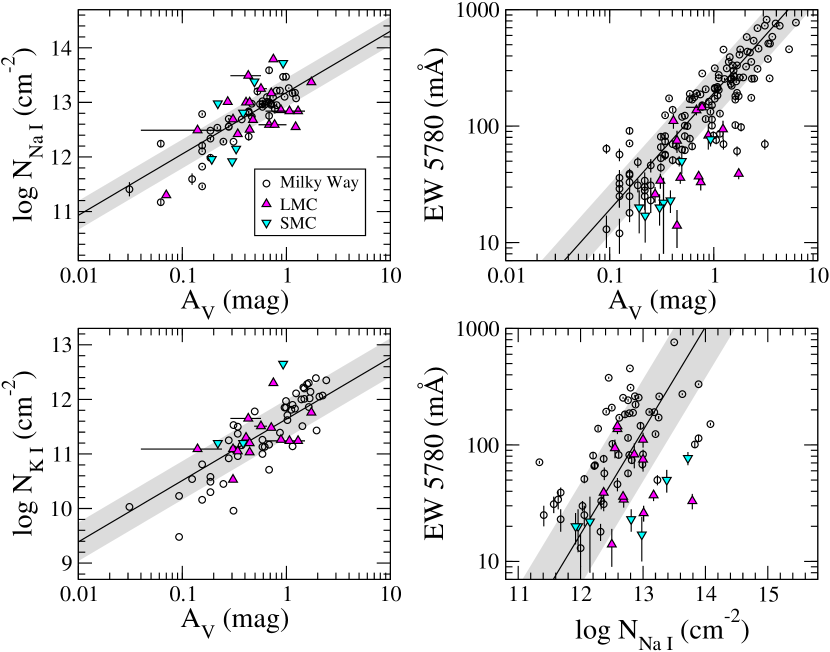
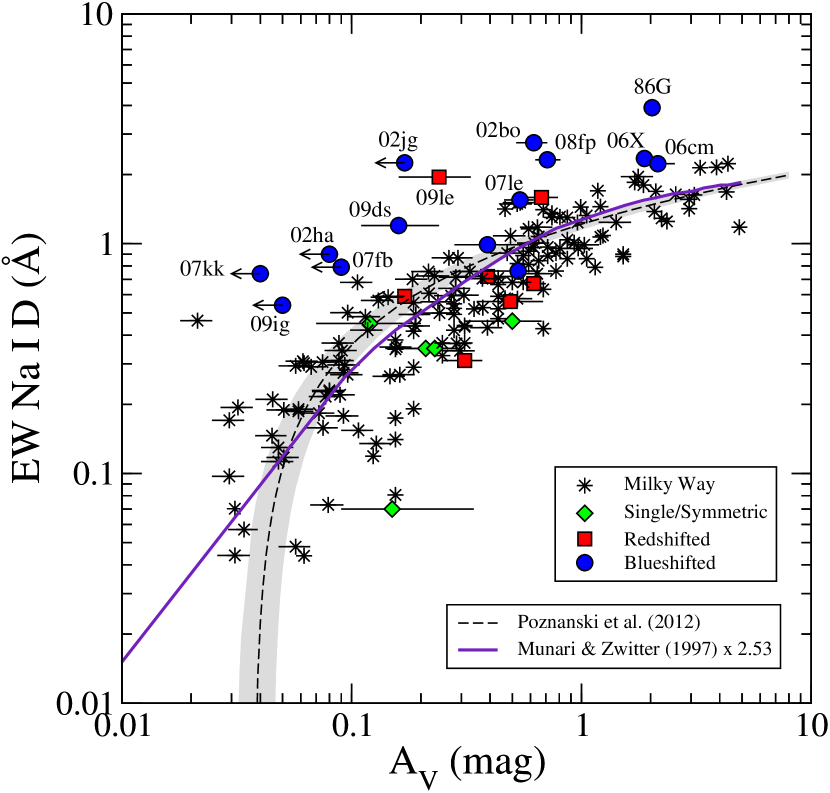
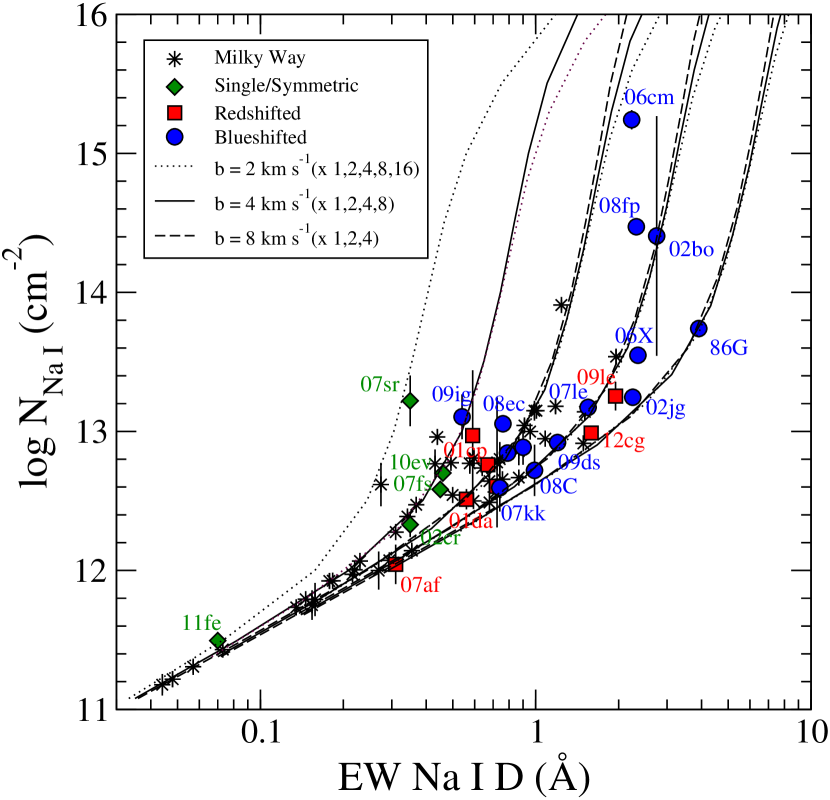
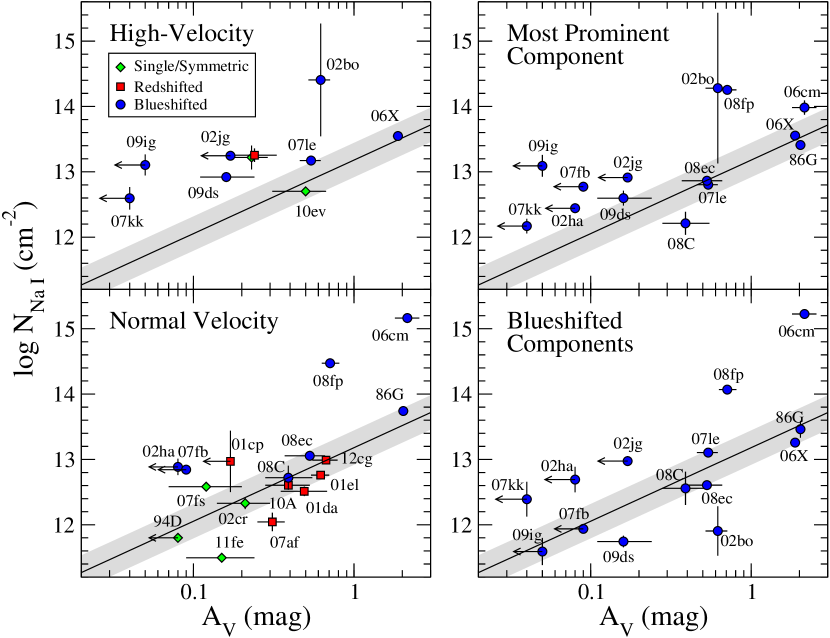
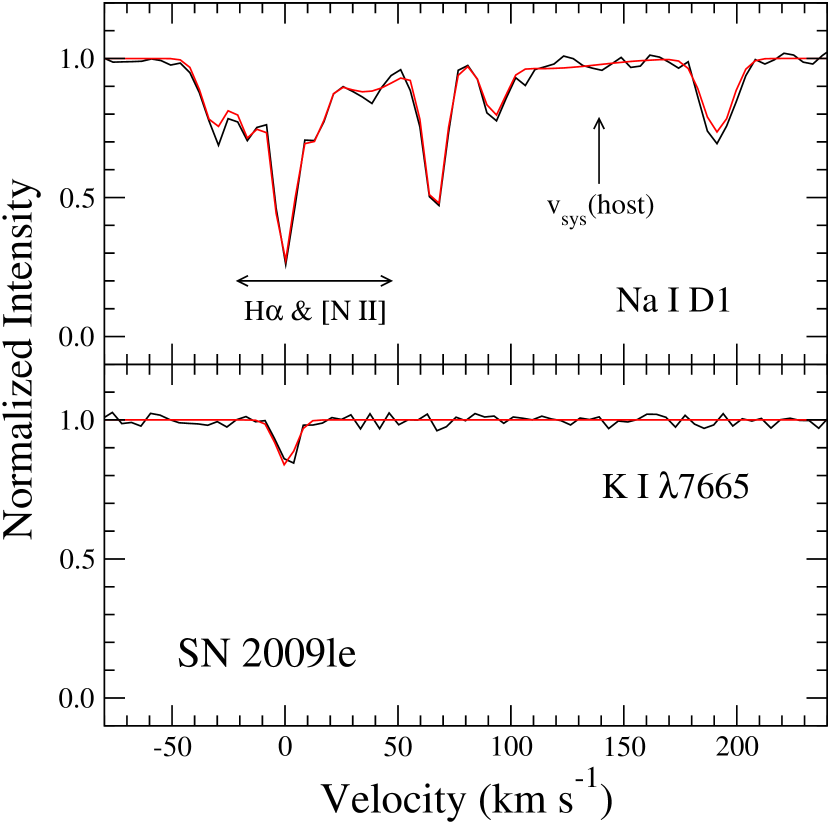
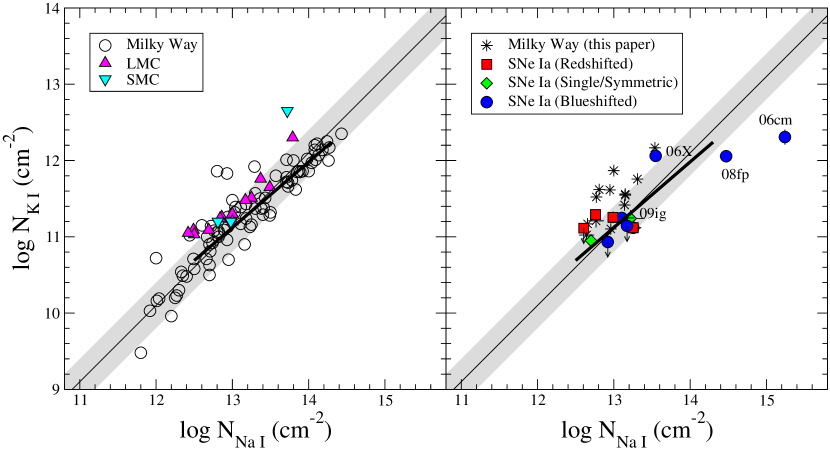
| ) | ||||
|---|---|---|---|---|
| Object | mag | cm-2 | cm-2 | Reference |
| (1) | (2) | (3) | (4) | (5) |
| 2003gd | 1 | |||
| 2006be | 2 | |||
| 2006ca | 2 | |||
| 2006eu | 2 | |||
| 2007af | 2 | |||
| 2007hj | 2 | |||
| 2007kk | 2 | |||
| 2007le | 2 | |||
| 2007on | 2 | |||
| 2007sr | 2 | |||
| 2008C | 2 | |||
| 2008fp | 2 | |||
| 2008ge | 2 | |||
| 2008hv | 2 | |||
| 2008ia | 2 | |||
| 2009ds | 2 | |||
| 2009ev | 2 | |||
| 2009iw | 2 | |||
| 2009le | 2 | |||
| 2009mz | 2 | |||
| 2009nr | 2 | |||
| 2010A | 2 | |||
| 2010ev | 2 | |||
| 2010jl | 1 | |||
| 2010ko | 1 | |||
| 2011K | 1 | |||
| 2011di | 1 | |||
| 2011dn | 1 | |||
| 2011dq | 1 | |||
| 2011dy | 1 | |||
| 2011ek | 1 | |||
| 2011fj | 1 | |||
| 2012cg | 1 | |||
| PTF11iqb | 1 | |||
| 3C273 | 1 | |||
| IC4329A | 1 | |||
| Mk509 | 1 | |||
| NGC1068 | 1 | |||
| NGC2110 | 1 | |||
| NGC3783 | 1 | |||
| PDS456 | 1 | |||
| Fairall51 | 1 | |||
| IRAS06213+0020 | 1 | |||
| IRAS08311-2459 | 1 | |||
| IRAS09149-6206 | 1 | |||
| IRAS11353-4854 | 1 |
Note. — Columns: (1) Object name; (2) Milky Way dust extinction (Schlafly & Finkbeiner, 2011); (3) Logarithm of the total neutral sodium column density; (4) Logarithm of the total neutral potassium column density; (5) High-dispersion spectroscopy reference [1 = unpublished MIKE spectrum; 2 = Sternberg et al. (2011)].
| Photometry References | ||||||
|---|---|---|---|---|---|---|
| SN | Host Galaxy | Morphology | Optical | Near-IR | mag | |
| (1) | (2) | (3) | (4) | (5) | (6) | (7) |
| 1986G | NGC 5128 | S0 pec | 1 | 16 | ||
| 1994D | NGC 4526 | SAB(s)0^0?(s) | 2 | 17 | ||
| 2001cp | UGC 10738 | Sbc | 3 | |||
| 2001da | NGC 7780 | Sab | 3 | |||
| 2001el | NGC 1448 | SAcd? edge-on | 4 | 4 | ||
| 2002bo | NGC 3190 | SA(s)a pec edge-on | 5 | 5 | ||
| 2002cr | NGC 5468 | SAB(rs)cd | 6 | |||
| 2002ha | NGC 6962 | SAB(r)ab | 6 | |||
| 2002jg | NGC 7253B | S? | 3 | |||
| 2006X | NGC 4321 | SAB(s)bc | 7 | 7 | ||
| 2006cm | UGC 11723 | Sb edge-on | 4 | |||
| 2007af | NGC 5584 | SAB(rs)cd | 8 | 8 | ||
| 2007fb | UGC 12859 | Sbc | 9 | |||
| 2007fs | ESO 601-G005 | Sb? | 9 | |||
| 2007hj | NGC 7461 | SB0 | 10 | 10 | ||
| 2007kk | UGC 2828 | SB(rs)bc | 9 | |||
| 2007le | NGC 7721 | SA(s)c | 8 | 8 | ||
| 2007on | NGC 1404 | E1 | 8 | 8 | ||
| 2007sr | NGC 4038 | SB(s)m pec | 11 | 11 | ||
| 2008C | UGC 3611 | S0/a | 8 | 8 | ||
| 2008ec | NGC 7469 | (R’)SAB(rs)a | 10 | |||
| 2008fp | ESO 428-G014 | SAB0^0(r) pec | 8 | 8 | ||
| 2008hv | NGC 2765 | S0 | 8 | 8 | ||
| 2008ia | ESO 125-G006 | S0 | 8 | 8 | ||
| SNF20080514-002 | UGC 8472 | S0 | 3 | |||
| 2009ds | NGC 3905 | SB(rs)c | 10 | 10 | ||
| 2009ig | NGC 1015 | SB(r)a? | 12 | |||
| 2009le | ESO 478-G006 | Sbc | 10 | 10 | ||
| 2010A | UGC 2019 | S? | 9 | |||
| 2010ev | NGC 3244 | SA(rs)cd | 13 | |||
| 2011fe | NGC 5457 | SAB(rs)cd | 14 | 18 | ||
| 2012cg | NGC 4424 | SB(s)a? | 15 | 15 | ||
Note. — Columns: (1) SN name; (2) Host galaxy name; (3) Host galaxy morphology from the NASA/IPAC Extragalactic Database (NED); (4) Optical photometry reference; (5) Near-infrared photometry reference; (6) Host dust extinction value; (7) Host dust extinction value.
References. — (1) Phillips et al. (1987); (2) CTIO 0.9 m unpublished; (3) Ganeshalingam et al. (2010); (4) Hicken et al. (2009a); (5) Krisciunas et al. (2004); (6) Krisciunas et al. (2003); (7) Contreras et al. (2010); (8) Stritzinger et al. (2011); (9) Hicken et al. (2012); (10) CSP, unpublished; (11) Schweizer et al. (2008); (12) Foley et al. (2012a); (13) Gutiérrez et al. (2011); (14) Richmond & Smith (2012); (15) CfA Supernova Group, unpublished (http://www.cfa.harvard.edu/supernova/sn12cg.html); (16) Frogel et al. (1987); (17) Richmond et al. (1995); (18) Matheson et al. (2012).
| Sternberg | EW(5780) | |||||
|---|---|---|---|---|---|---|
| SN | Type | Reference | cm-2 | cm-2 | mÅ | |
| (1) | (2) | (3) | (4) | (5) | (6) | (7) |
| 1986G | B | 1 | 20,000 | 13.740 | 335 | |
| 1994D | S | 2 | 38,000 | 11.800 | ||
| 2001cp | R | 3 | 30,000 | 12.970 | ||
| 2001da | R | 3 | 30,000 | 12.512 | ||
| 2001el | R | 4 | 50,000 | 12.76 | 11.29 | 189 |
| 2002bo | B | 3 | 30,000 | 14.406 | 37 | |
| 2002cr | S | 3 | 30,000 | 12.329 | ||
| 2002ha | B | 3 | 30,000 | 12.886 | ||
| 2002jg | B | 3 | 30,000 | 13.246 | ||
| 2006X | B | 5 | 48,000 | 13.779 | 11.995 | |
| 2006cm | B | 5 | 48,000 | 15.242 | 12.307 | 441 |
| 2007af | R | 5 | 48,000 | 12.044 | ||
| 2007fb | B | 5 | 48,000 | 12.844 | ||
| 2007fs | S | 5 | 48,000 | 12.583 | ||
| 2007hj | 5 | 52,000 | ||||
| 2007kk | B | 5 | 52,000 | 12.595 | ||
| 2007le | B | 5 | 52,000 | 13.281 | 139 | |
| 2007on | 5 | 48,000 | ||||
| 2007sr | S | 5 | 25,000 | 13.220 | 11.241 | 71 |
| 2008C | B | 5 | 48,000 | 12.720 | ||
| 2008ec | B | 5 | 54,000 | 13.055 | 77 | |
| 2008fp | B | 5 | 35,000 | 14.472 | 12.056 | 86 |
| 2008hv | 5 | 35,000 | ||||
| 2008ia | 5 | 35,500 | ||||
| SNF20080514-002 | 5 | 52,000 | ||||
| 2009ds | B | 5 | 35,500 | 12.920 | ||
| 2009ig | B | 5 | 34,500 | 13.105 | 11.247 | |
| 2009le | R | 5 | 35,500 | 13.254 | 11.118 | |
| 2010A | R | 5 | 35,500 | 12.605 | 99 | |
| 2010ev | S | 5 | 35,500 | 12.701 | 10.949 | 227 |
| 2011fe | S | 6 | 82,000 | 11.495 | ||
| 2012cg | R | 7 | 47,000 | 12.989 | 11.255 | 84 |
Note. — Columns: (1) SN name; (2) Classification of Na I D profile as per Sternberg et al. (2011) (B = Blueshifted, R = Redshifted, S = Single/Symmetric); (3) High-dispersion spectroscopy reference; (4) Spectral resolution; (5) Logarithm of the total neutral sodium column density; (6) Logarithm of the total neutral potassium column density; (7) Equivalent width of DIB feature at 5780 Å.