Coagulation Calculations of Icy Planet Formation Around 0.1–0.5 Stars: Super-Earths From Large Planetestimals
Abstract
We investigate formation mechanisms for icy super-Earth mass planets orbiting at 2–20 AU around 0.1–0.5 stars. A large ensemble of coagulation calculations demonstrates a new formation channel: disks composed of large planetesimals with radii of 30–300 km form super-Earths on time scales of 1 Gyr. In other gas-poor disks, a collisional cascade grinds planetesimals to dust before the largest planets reach super-Earth masses. Once icy Earth-mass planets form, they migrate through the leftover swarm of planetesimals at rates of 0.01–1 AU Myr-1. On time scales of 10 Myr to 1 Gyr, many of these planets migrate through the disk of leftover planetesimals from semimajor axes of 5–10 AU to 1–2 AU. A few per cent of super-Earths might migrate to semimajor axes of 0.1–0.2 AU. When the disk has an initial mass comparable with the minimum mass solar nebula scaled to the mass of the central star, the predicted frequency of super-Earths matches the observed frequency.
1 INTRODUCTION
Super-Earths are among the most common planets known in the galaxy. With typical masses 1–10 (e.g., Haghighipour, 2011, 2013), super-Earths have been identified far from (microlensing, direct imaging) and close to (radial velocities, transits) their host stars (e.g., Rivera et al., 2005; Beaulieu et al., 2006; Forveille et al., 2009; Gould et al., 2010; Currie et al., 2012; Bonfils et al., 2013). At any orbital separation, super-Earths are much more common than ice giants ( 10–50 ) or gas giants ( 50–6000 ), but they are probably less common than Mars-mass or Earth-mass planets (e.g., Gould et al., 2010; Youdin, 2011; Dressing & Charbonneau, 2013; Fressin et al., 2013; Kopparapu, 2013; Petigura et al., 2013).
Super-Earths orbiting stars with masses 0.1–0.5 are an interesting challenge for planet formation theory. At birth, most – if not all – low mass stars are surrounded by large circumstellar disks of gas and dust (e.g., Kenyon & Hartmann, 1995; Scholz et al., 2006; Luhman, 2012). Disk masses derived from mm observations are typically 0.1% to 10% of the stellar mass (e.g., Williams & Cieza, 2011; Andrews et al., 2013). In a solar metallicity disk surrounding a 0.1 star, the maximum mass in solid material is roughly 30 . Thus, super-Earths orbiting low mass stars contain a large fraction of the solid material originally in the disk.
Here, we consider super-Earth formation in the context of the planetesimal theory. In this picture, dust grains in the circumstellar disk settle out of the gas and grow into roughly km-sized or larger planetesimals (e.g., Chiang & Youdin, 2010). Mergers among colliding planetesimals produce larger and larger objects, concentrating solid material into a smaller and smaller number of massive protoplanets (e.g., Safronov, 1969; Wetherill & Stewart, 1989; Goldreich et al., 2004). Eventually, collisions and gravitational interactions among a few remaining protoplanets produce a set of planets on stable orbits (e.g., Chambers & Wetherill, 1998; Raymond et al., 2004; Kenyon & Bromley, 2006; Raymond et al., 2011).
To maximize the probability of super-Earth formation, we examine numerical coagulation calculations of the growth of icy planetesimals at large distances from the parent star. We consider systems where the -folding time for the gas surface density is 1 Myr. In massive disks composed of very large planetesimals with 30 km, we identify a new formation path: super-Earths from collisions of sub-Earth-mass objects at late times, 1–10 Gyr. This time scale is much longer than typical times, 1–10 Myr, inferred from previous studies of formation within longer-lived gaseous disks (e.g., Laughlin et al., 2004; Kobayashi et al., 2010, 2011; Rogers et al., 2011). Because the accretion process and formation times for these two paths are so different, observations can test whether either path leads to super-Earths.
We describe the physics included in the coagulation calculations in §2, the outcomes of the calculations in §3, and the ability of super-Earths to migrate through the disk in §4. In §5, we compare our results to previous investigations and evaluate observational tests of model predictions. We conclude in §6 with a brief summary.
2 PLANET FORMATION CALCULATIONS
To calculate the formation and evolution of planets around low mass stars, we use Orchestra, an ensemble of computer codes for the formation and evolution of planetary systems. Currently, Orchestra consists of a radial diffusion code which computes the time evolution of a gaseous or a particulate disk (Bromley & Kenyon, 2011a), a multiannulus coagulation code which computes the time evolution of a swarm of planetesimals (Kenyon & Bromley, 2004a, 2008, 2012), and an -body code which computes the orbits of gravitationally interacting protoplanets (Bromley & Kenyon, 2006, 2011b, 2013). Within the coagulation code, Orchestra includes algorithms for treating interactions between small particles and the gaseous disk (e.g., Adachi et al., 1976; Weidenschilling, 1977a) and between coagulation mass bins and -bodies (Bromley & Kenyon, 2006). To treat interactions between small particles and the -bodies more rigorously, the -body calculations include tracer particles. Massless tracer particles allow us to calculate the evolution of the orbits of small particles in response to the motions of massive protoplanets. Massless and massive tracer particles enable calculations of the response of -bodies to the changing gravitational potential of small particles (Bromley & Kenyon, 2011a, b, 2013).
We perform coagulation calculations on a cylindrical grid with inner radius and outer radius surrounding a star with = 0.1, 0.3, or 0.5 . The model grid contains concentric annuli with widths centered at semimajor axes . To connect this study with previous analyses of dust production at = 30–150 AU around 1–3 stars (e.g., Kenyon & Bromley, 2008, 2010), we set the equilibrium blackbody temperature of a dust grain at the inner edge of the grid at 60–70 K for stellar ages of roughly 10 Myr (Backman & Paresce, 1993; Baraffe et al., 1998). Thus, the inner edge of the grid is at = 7 AU (0.5 ), 4 AU (0.3 ), and 2.5 AU (0.1 ). Although not ideal for predicting the frequency of debris disks at short wavelengths, grains with temperatures of 30–60 K are detectable with Spitzer (e.g., Rieke et al., 2005; Trilling et al., 2008) and Herschel (e.g., Matthews et al., 2010; Lestrade et al., 2012; Eiroa et al., 2013). We plan to discuss predictions for debris disks around 0.1–0.5 stars in a separate paper.
To complete calculations in a reasonable amount of cpu time, we set = 64 which yields 5. With fixed, choosing larger allows disks with larger masses. However, results for 1–3 stars from Kenyon & Bromley (2008, 2010) suggest very long formation times at 40 AU (15 AU) for 0.5 (0.1 ) stars. Adopting 3 AU (1 AU) for 0.5 (0.1 ) stars yields formation times of 1 Myr, enabling better tests of theories for gas giant planet formation (e.g., Kennedy & Kenyon, 2008; Kobayashi et al., 2010, 2011). However, smaller disks have smaller total masses. With our focus on super-Earth formation, a larger disk allows us to explore new regions of parameter space compared to previous calculations.
Within every annulus , there are mass batches with characteristic mass and radius (Wetherill & Stewart, 1993; Kenyon & Luu, 1998). Batches are logarithmically spaced in mass, with mass ratio . In these calculations for 1 km; for 1 km. For a handful of mass batches with 1 km, makes a smooth transition from 2.0 to 1.4. Each mass batch contains particles with total mass . Thus, the average mass in a batch is . Throughout the calculation, this average mass is used to calculate the collision cross-section, collision energy, and other necessary physical variables. As mass is added and removed from each batch, the average mass changes (Wetherill & Stewart, 1993).
For any , numerical calculations lag the result of an ideal calculation with infinite mass resolution. We quantify this delay with (i) a suite of calculations using a cross-section with an analytic solution and (ii) a small set of calculations with our standard cross-sections (e.g., Wetherill, 1990). When the cross-section is the product of planetesimal masses, the largest protoplanet becomes a runaway object when it begins to grow by accreting the next largest protoplanet (Wetherill, 1990). This runaway begins at a dimensionless time = 1.0. Calculations with = 1.25 yield a runaway object at , lagging the ideal calculation by 1.2% (see also Kenyon & Luu, 1998). Other simulations have lags of 0.5% (), 2.7% (), and 8.7% ().
To derive lags for the cross-sections used in our main calculations (see below), we consider simulations of 1 m to 1 km planetesimals in a single annulus at 7 AU around a 0.5 star. These simulations do not include fragmentation. To establish a baseline result for = 1.08, we derive the average time and its dispersion for the formation of the first object with a mass of g in a suite of twenty simulations. We repeat this exercise for larger and derive the typical lag . For simulations with constant for all mass bins, we infer lags of 0.5% ( = 1.25), 1.9% ( = 1.4), and 5.1% ( = 2.0). The typical dispersion in the lag ranges from 0.9% for = 1.08 to 6.3% for . Because standard cross-sections have a weaker scaling with mass, these lags are slightly smaller than the analytic case. When varies smoothly from 2.0 to 1.4 as in our main calculations, the lag is similar to calculations with constant = 1.4, 2.0% instead of 1.9%. With cpu time scaling as , adopting our variable saves cpu time with little loss of accuracy.
To estimate the impact of on the collisional cascade, we examine a suite of simulations with fragmentation. We consider two measures – the slope of the cumulative size distribution from 1 m to 30 m and the total mass loss – at the time when the first g object forms. For both quantities, the dispersion in the average quantity grows with . The differences in the average quantities are comparable to the dispersion. Thus, we see no obvious impact of on the collisional cascade.
For these suites of simulations, the gas damps the velocities of small particles with radii 1–100 m (Wetherill & Stewart, 1993; Kenyon & Luu, 1999). Although our ability to resolve the transition from high velocities ( 10–30 M) to low velocities ( 1–10 m) depends on , the general behavior of the calculations is independent of . When g protoplanets form on time scales of 1 Myr or shorter, the surface density of the gas is comparable to the initial surface density. As in Kobayashi et al. (2012, and references therein), velocity damping by the gas reduces velocities of particles with sizes of 1–10 m to less than a few m s-1 (). At these low velocities, collisions produce mergers instead of disruptions. Halting the collisional cascade leads to an excess of particles at these sizes. When g protoplanets form on time scales of 1–2 Myr or longer, the surface density of the gas declines as the collisional cascade begins. In these cases, gas is less effective at damping the velocities of small particles and halting the collisional cascade. Thus, there is little or no excess of particles at these sizes.
The calculations described in §3 begin with a cumulative size distribution of planetesimals with mass density = 1.5 g cm-3 and maximum initial size . For comparison with investigators that quote differential mass distributions with , = - 1. Here, we adopt an initial = 0.5 (most of the mass in large objects) or 3.0 (equal mass per logarithmic bin).
Planetesimals have horizontal and vertical velocities and relative to a circular orbit. The horizontal velocity is related to the orbital eccentricity, = 1.6 , where is the circular orbital velocity in annulus . The orbital inclination depends on the vertical velocity, = .
The mass and velocity distributions of the planetesimals evolve in time due to inelastic collisions, drag forces, and gravitational encounters. As summarized in Kenyon & Bromley (2004a, 2008), we solve a coupled set of coagulation equations which treats the outcomes of mutual collisions between all particles with mass in annuli . We adopt the particle-in-a-box algorithm, where the physical collision rate is , is the number density of objects, is the geometric cross-section, is the relative velocity, and is the gravitational focusing factor (Wetherill & Stewart, 1993; Kenyon & Luu, 1998). Depending on physical conditions in the disk, we derive in the dispersion or the shear regime (Kenyon & Luu, 1998; Kenyon & Bromley, 2012). For a specific mass bin, the solutions include terms for (i) loss of mass from mergers with other objects and (ii) gain of mass from collisional debris and mergers of smaller objects.
Once protoplanets reach radii of 2000 km, they acquire gaseous atmospheres. Gas drag within the atmosphere slows down nearby small particles, enhancing the accretion rate (e.g., Podolak et al., 1988; Kary et al., 1993). To derived this enhanced rate, we follow Inaba & Ikoma (2003) and solve for the hydrostatic structure of an atmosphere with an outer radius equal to the smaller of the Bondi radius and the Hill radius. With this solution, we calculate the cross-section as a function of the planetesimal mass (see also Chambers, 2008; Kobayashi et al., 2011; Bromley & Kenyon, 2011a).
Collision outcomes depend on the ratio , where is the collision energy needed to eject half the mass of a pair of colliding planetesimals to infinity and is the center of mass collision energy (see also Wetherill & Stewart, 1993; Williams & Wetherill, 1994; Tanaka et al., 1996; Stern & Colwell, 1997; Kenyon & Luu, 1999; O’Brien & Greenberg, 2003; Kobayashi & Tanaka, 2010). Consistent with N-body simulations of collision outcomes (e.g., Benz & Asphaug, 1999; Leinhardt et al., 2008; Leinhardt & Stewart, 2009), we set
| (1) |
where is the bulk component of the binding energy, is the gravity component of the binding energy, and is the radius of a planetesimal.
To explore the sensitivity of our results to the fragmentation algorithm, we consider two sets of parameters . As in Kenyon & Bromley (2008, 2010), we set = 1.5 g cm-3 and adopt parameters for ‘strong’ () and ‘weak’ () planetesimals, where () () for 10 m (see Fig. 1 in Kenyon & Bromley, 2012). Strong planetesimals have = = erg g-1, = 0, = 1.5 erg g-2 cm1.75, = 1.25. Weak planetesimals have = = erg g-1 cm0.4, , = 0.22 erg g-2 cm1.7, = 1.30 .
These parameters are broadly consistent with published analytic and numerical simulations (e.g., Davis et al., 1985; Holsapple, 1994; Love & Ahrens, 1996; Housen & Holsapple, 1999). At small sizes, they agree with results from laboratory experiments of impacts with icy targets and projectiles (see also Ryan et al., 1999; Arakawa et al., 2002; Giblin et al., 2004; Burchell et al., 2005). In the gravity regime, our parameters agree with simulations from Benz & Asphaug (1999) for strong objects and Leinhardt & Stewart (2009) for weak objects. In the strength regime, our choice for weak planetesimals follows Leinhardt & Stewart (2009); our choice for strong planetesimals allows us to test whether outcomes depend on (see also Kenyon & Bromley, 2008, 2010).
For two colliding planetesimals with masses and , the mass of the merged planetesimal is
| (2) |
where the mass of debris ejected in a collision is
| (3) |
In recent calculations of Kobayashi & Tanaka (2010) and Kobayashi et al. (2010, 2011, 2012), the exponent in an equivalent expression for the amount of ejected mass is 1 instead of our adopted 9/8. Compared to Kobayashi & Tanaka (2010), our calculations produce somewhat more debris in high velocity collisions () and somewhat less debris in low velocity collisions (). For the calculations in this paper, the two approaches lead to roughly a factor of two difference in the amount of mass lost to high and low velocity collisions. Given the factor of 2–3 (10 or more) differences in plausible coefficients for (), this uncertainty is within the margin of error for these types of calculations.
To place the debris in our grid of mass bins, we set the mass of the largest collision fragment as and adopt a cumulative mass distribution with = 0.833, roughly the value expected for a system in collisional equilibrium (Dohnanyi, 1969; Williams & Wetherill, 1994; Tanaka et al., 1996; O’Brien & Greenberg, 2003; Kobayashi & Tanaka, 2010). This approach allows us to derive ejected masses for catastrophic collisions with and for cratering collisions with (see also Wetherill & Stewart, 1993; Williams & Wetherill, 1994; Tanaka et al., 1996; Stern & Colwell, 1997; Kenyon & Luu, 1999; O’Brien & Greenberg, 2003; Kobayashi & Tanaka, 2010).
When fragmentation begins, the important physical quantity in the calculations is the ratio of two rates: the rate leftover planetesimals collide and fragment into smaller objects and the rate protoplanets accrete the leftovers and their fragments. When planetesimals and their fragments collide more often with other planetesimals, the collisional cascade removes fragments from the system more rapidly than protoplanets accrete them. The growth of protoplanets stalls (Inaba et al., 2003; Kenyon & Bromley, 2004a).
Although variations in the fragmentation parameters have a large impact on the mass and visibility of the smallest particles (e.g., Belyaev & Rafikov, 2011), plausible variations in the parameters adopted for the size distribution of fragments have little impact on these two collision rates. The rate protoplanets accrete leftover small planetesimals and fragments depends primarily on the total mass in small objects. Throughout the evolution, most of the mass in the leftovers is in large objects with 1 km. This mass is independent of and . Thus protoplanet accretion rates do not depend on and . Fragment production depends on the collision velocities and the relative collision rates between (i) pairs of leftover planetesimals and (ii) a leftover planetesimal and another much smaller object (e.g., Kobayashi & Tanaka, 2010; Belyaev & Rafikov, 2011, and references therein). With most of the mass in large objects and a collision rate , the production rate of fragments (i) is independent of and for collisions of pairs of planetesimals and (ii) depends weakly on and for collisions between a large object and a much smaller object (Kobayashi & Tanaka, 2010). Thus, the adopted size distribution for the fragments has little impact on the growth of protoplanets.
To compute the evolution of the velocity distribution, we include collisional damping from inelastic collisions, gravitational interactions, and gas drag. For inelastic and elastic collisions, we follow the statistical, Fokker-Planck approaches of Ohtsuki (1992) and Ohtsuki et al. (2002), which treat pairwise interactions (e.g., dynamical friction and viscous stirring) between all objects in all annuli. As in Kenyon & Bromley (2001), we add terms to treat the probability that objects in annulus interact with objects in annulus (Kenyon & Bromley, 2004b, 2008). We also compute long-range stirring from distant oligarchs (Weidenschilling, 1989).
To derive damping and radial transport from gas drag, we include approaches developed in Weidenschilling (1977a) and Rafikov (2004). Following Weidenschilling (1977a), we solve the equations of motion for particles in the Epstein, Stokes, intermediate, and quadratic regimes. The resulting drift velocity as a function of particle size allows us to calculate the rate particles are lost through each annulus in the grid. The surface density of particles well-coupled to the gas diminishes exponentially with the gas depletion time defined below. We use the scale-height of the gas to set their relative velocities (Bromley & Kenyon, 2011a). For poorly-coupled particles, the surface density declines with the drift rate. To set particle velocities, we adopt the results of Adachi et al. (1976), who derive stirring rates for and in each regime.
Solving the equations of motion for all particles in each time step is computationally intensive. For time step and gas depletion time defined below, we solve the equations of motion on a time scale , with . In between these evaluations, we follow the analytic approach of Rafikov (2004) scaled to yield similar solutions to the equations of motion as in the Weidenschilling (1977a) approach. Once the gas surface density declines to 0.01% of its initial velue, we discontinue gas drag calculations. Tests using only one approach result in nearly identical long-term evolution of the system.
The initial conditions for these calculations are appropriate for a disk with an age of 1–2 Myr (e.g., Currie et al., 2007; Williams & Cieza, 2011, and references therein). We consider systems of annuli in disks where the initial surface density of solid material follows a power law in semimajor axis,
| (4) |
where is the central radius of the annulus in AU, = 1 or 3/2, and is a scaling factor. For a standard gas to dust ratio of 100:1, . To explore a range of disk masses similar to the observed range among the youngest stars, we consider = 30 () g cm-2 and = 0.01–3. Disks with 0.1 have masses similar to the median disk masses observed around young stars in nearby dark clouds (Andrews & Williams, 2005; Williams & Cieza, 2011; Andrews et al., 2013). Somewhat larger scale factors, 1, correspond to models of the minimum mass solar nebula (MMSN) models of Weidenschilling (1977b) and Hayashi (1981) for solar-type stars.
To evolve the gas in time, we consider a simple nebular model for the gas density. We adopt a scale height (Kenyon & Hartmann, 1987) and assume the gas surface density declines exponentially with time
| (5) |
where and are scaling factors and = 1 Myr is the gas depletion time. Calculations of viscous protostellar disks with a viscosity parameter yield typical depletion times of 0.5–5 Myr (e.g., Chambers, 2009; Bromley & Kenyon, 2011a). Observations of the lifetimes of accretion disks in pre-main sequence stars suggest depletion times ranging from 1 Myr to 10 Myr (Kenyon & Hartmann, 1995; Currie et al., 2009; Kennedy & Kenyon, 2009; Mamajek, 2009; Williams & Cieza, 2011).
This short depletion time has a direct impact on the final masses of protoplanets (e.g., Goldreich et al., 2004; Kobayashi et al., 2010, 2011). Gas drag damps the velocities of small objects and removes them from the grid (e.g., Adachi et al., 1976; Weidenschilling, 1977a). Damping small particle velocities speeds up runaway growth; removing small particles slows down runaway growth. Our short gas depletion time slows down runaway growth but allows more mass for planet formation. Thus, our calculations are more likely to produce super-Earth mass planets and less likely to produce gas giants than calculations with a longer gas depletion time (e.g., Kobayashi et al., 2011, 2012).
Table 1 summarizes the model grids. For each set of , we choose the extent of the disk; the initial radius of the largest planetesimal, = 1–1000 km; the initial eccentricity and inclination ; the power law exponent of the initial size distribution, = (equal mass per log interval in mass) or (most of the mass in the largest objects); the fragmentation parameters, or ; and the evolution time . To understand the possible range of outcomes, we repeat calculations 10–15 times with different random number seeds for each combination of initial conditions.
Our calculations follow the time evolution of the mass and velocity distributions of objects with a range of radii, to . The upper limit is always larger than the largest object in each annulus. Erosive collisions produce objects with , which are ‘lost’ to the model grid. Until a calculation produces objects with 1000 km, lost objects comprise a small fraction, 1%, of the total mass in the grid.
Once large objects form, the fate of lost objects depends on the surface density of the gas. When is small, small particles with are more likely to be ground down into smaller and smaller objects than to collide with larger objects in the grid (see Kenyon & Bromley, 2002a, 2002b, 2004a). Thus, lost objects have little impact on the growth of the largest objects.
When is large, small particles with are well-coupled to the gas (e.g., Rafikov, 2004). Velocity damping by the gas then prevents erosive collisions of small particles. If protoplanets can accrete small fragments more rapidly than gas drag removes them, protoplanets can reach masses of 1–10 on short time scales (Rafikov, 2004; Kenyon & Bromley, 2009; Ormel & Klahr, 2010; Ormel et al., 2010b; Bromley & Kenyon, 2011a; Lambrechts & Johansen, 2012). However, several recent calculations suggest gas drag effectively damps the random velocities of 1–10 m particles, halting the collisional cascade and producing an excess of particles at these sizes (e.g., Kobayashi et al., 2010). Gas drag removes particles with 1 m before larger objects can accrete them. Although gas drag cannot rapidly remove larger particles, these objects do not contain much mass. Thus, damping by gas drag limits the formation of super-Earth and gas giant planets from fragments produced in a collisional cascade (Kobayashi et al., 2010, 2011, 2012).
To consider a broad set of initial collisions with a limited amount of computer time, we set = 100 cm in all of our calculations. For simulations with 3 km, erosive collisions begin after the gaseous disk has lost 40% to 90% of its initial mass. With gas drag weakened, lost objects are then ground down into smaller and smaller objects which are eventually ejected from the system. These calculations yield a reasonably accurate estimate for the final masses of protoplanets. With smaller planetesimals, 1 km, erosion begins with a significant gas disk. These simulations somewhat underestimate the likely masses of the largest objects (e.g., Kobayashi et al., 2011).
To connect the outcomes of coagulation calculations with the results of analytic theory, we write the collision rate in terms of the surface density and the angular velocity of disk material (see also Lissauer, 1987; Kenyon & Bromley, 2008; Ormel et al., 2010a; Youdin & Kenyon, 2012). Adopting as the vertical scale height of disk material and as the mass of a particle, the number density of particles is roughly . With and , where is the escape velocity of typical large objects and is the characteristic speed of smaller bodies, the collision rate is
| (6) |
A single particle experiences collisions per time interval. Defining the collision time, ,
| (7) |
With ( = 1–2) and ,
| (8) |
The collision time grows with decreasing disk mass () and with increasing distance from the central star. This time sets the growth timescales for the largest solid objects in the disk.
3 EVOLUTION OF THE LARGEST OBJECTS
3.1 Growth with a Broad Range of Initial Planetesimal Sizes
We begin with a discussion of planet formation in disks composed of small planetesimals in a power law size distribution with = 3 over an initial size range of 1 m to 1 km. In this size range, viscous stirring from the largest objects is initially weaker than dynamical friction (Stewart & Ida, 2000; Goldreich et al., 2004). Thus, the two important dynamical processes at the start of each calculation are gas drag on the small objects and dynamical friction between large and small objects (Youdin & Kenyon, 2012, and references therein). Gas drag reduces the random velocities of small objects (Adachi et al., 1976; Weidenschilling, 1977a). Dynamical friction raises the random velocities of the smallest objects and damps the random velocities of the largest objects (e.g., Wetherill & Stewart, 1989, 1993, and references therein). As the velocities of the large objects drop relative to the velocities of the small objects, viscous stirring begins to dominate the velocity evolution of the small objects (Stewart & Ida, 2000; Ohtsuki et al., 2002).
When = 3 and = 1 km, every calculation begins with a short phase of orderly growth (see also Kenyon & Luu, 1998; Kenyon & Bromley, 2008, 2010, 2012). Initially, all planetesimals have the same random velocities, which are comparable to the escape velocity (and much larger than the Hill velocity) of 1 km planetesimals. Thus, gravitational focusing factors are small, 1. Growth is orderly: lower mass objects grow more rapidly than more massive objects (see Safronov, 1969; Youdin & Kenyon, 2012, and references therein). As orderly growth proceeds, the random velocities of all planetesimals ‘relax’ to a rough equilibrium where (i) viscous stirring and gas drag achieve an approximate balance for the random velocities of the smallest objects and (ii) dynamical friction maintains an approximate equipartition in random kinetic energy as a function of particle size. For the initial gas densities in these calculations, the ‘equilibrium’ random velocity of the smallest particles is much smaller than the escape velocity of the largest objects (Rafikov, 2004). With , gravitational focusing factors increase considerably as the random velocities of all planetesimals relax (see also Kenyon & Luu, 1998; Goldreich et al., 2004; Kenyon & Bromley, 2012, and references therein). As increases, the largest objects begin to grow much more rapidly than smaller objects. Runaway growth begins.
During the runaway, growth concentrates more and more of the mass in the largest objects. With more mass in larger objects, viscous stirring becomes more and more important in raising the velocities of the smallest objects. Eventually, viscous stirring overcomes damping by gas drag. The random velocities of the smallest planetesimals grow to . Gravitational focusing factors decrease. Runaway growth ends.
Following the runaway, growth again becomes orderly. Throughout the radial grid, the velocities of the smallest planetesimals are a significant fraction of the escape velocity of the largest object in an annulus. Thus, gravitational focusing factors are small and fairly independent of the masses of the largest objects. Orderly growth scales inversely with mass; thus, smaller large objects grow somewhat faster than the largest large objects. In this period of oligarchic growth (Kokubo & Ida, 1998, 2000; Ormel et al., 2010a), the largest object in each annulus evolves to a common size.
Throughout oligarchic growth, the random velocities of the small objects continue to grow. Eventually, the collision energy for a pair of small objects approaches . Collisions then yield copious amounts of debris instead of a merger. Collisions among debris particles produce additional debris, leading to a collisional cascade where the small objects are ground to dust (e.g., Dohnanyi, 1969; Williams & Wetherill, 1994; Kenyon & Bromley, 2002a, b; Wyatt & Dent, 2002; Dominik & Decin, 2003). Because destructive collisions among small objects are more likely than collisions between a large object and a small object, the start of the collisional cascade effectively ends the growth of the largest objects (see also Inaba et al., 2003; Kenyon & Bromley, 2004a; Kobayashi et al., 2010). During the cascade, these objects reach a characteristic maximum size, , which depends on the initial disk mass and the fragmentation parameters (Kenyon & Bromley, 2008, 2010, 2012). Tables 2–3 list for the full suite of calculations.
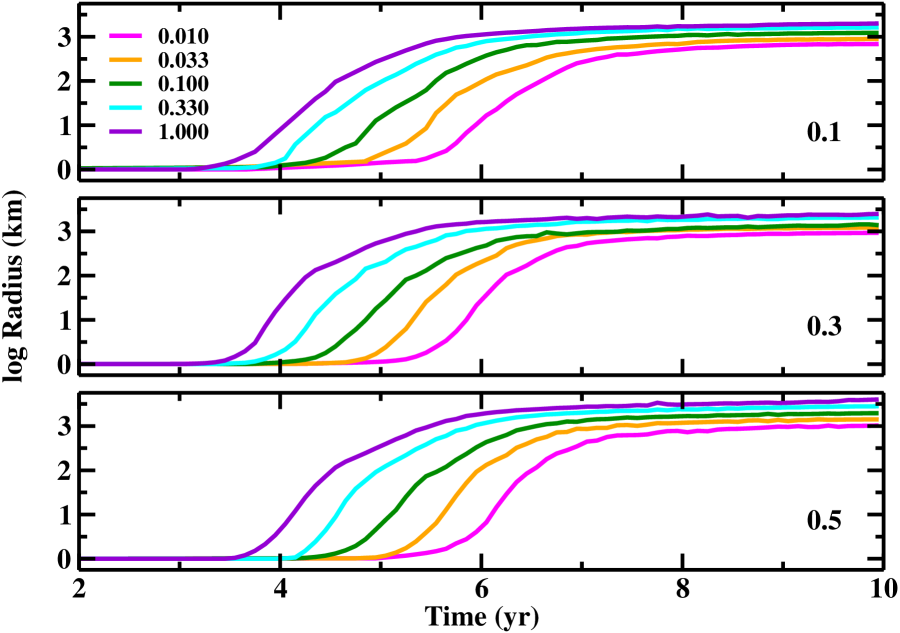
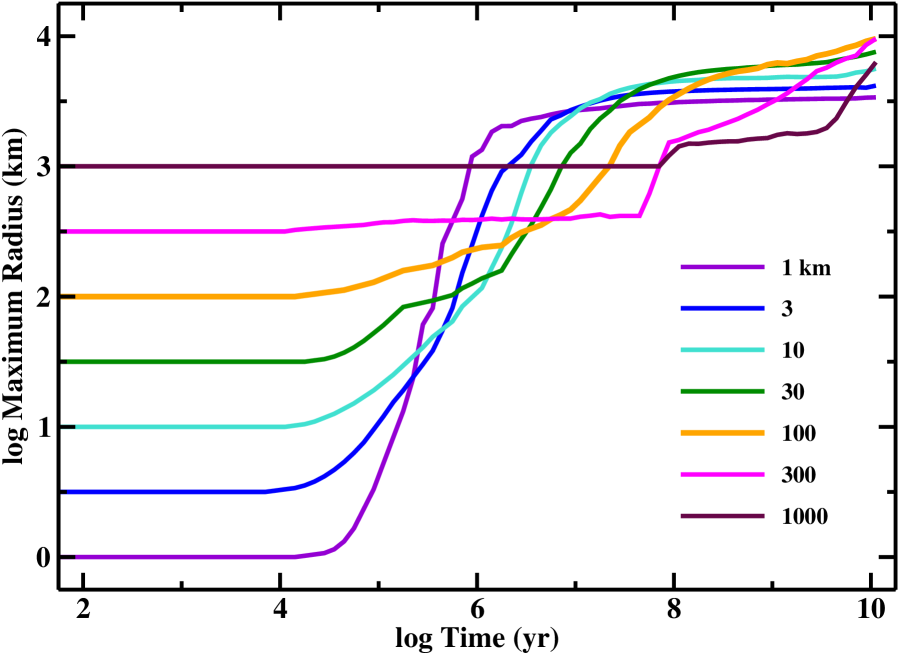
Fig. 1 illustrates this evolution for disks of various masses around 0.1 (upper panel), 0.3 (middle panel), and 0.5 (lower panel) stars. The calculations begin with an initial surface density of solids . In each panel, the curves show the growth of the largest object within the innermost few annuli of disks with the fragmentation parameters and = 0.01–1 as indicated in the legend in the upper panel. As the velocity distribution relaxes at the start of each calculation, large objects begin their evolution with a short orderly growth phase where their radii grow by a few per cent. When runaway growth begins, the largest objects grow in radius by factors of 100–300 in yr. As the radius approaches 300 km, gravitational focusing factors decline. Oligarchic growth begins. During oligarchic growth, the collisional cascade removes more and more material from the grid. The sizes of the largest objects reach a constant value.
For all large objects, the growth time depends on the initial mass in the disk (Fig. 1, see also Kenyon & Bromley, 2008, 2010). With and , the accretion time from eq. (8) is . When viscous stirring and gas drag are in an approximate equilibrium, , with 1/6 to 1/5 (quadratic drag), 0 (Stokes drag) and 2/5 (Epstein drag) (Rafikov, 2004). Kobayashi et al. (2010) derive similar results. This additional component to accretion implies , with 1.3–1.4 (quadratic drag), 1.0 (Stokes drag), and 1.8 (Epstein drag) (see also Kenyon & Bromley, 2008, Appendix).
With a typical (see below), our results match predictions. At the start of these calculations, the smallest (largest) particles are in the Epstein (quadratic) regime. Intermediate-sized particles lie in the Stokes regime. As the gas density drops with time, fewer and fewer particles are in the Epstein regime. Gas drag, mergers among smaller objects, and accretion of small objects by large objects also remove mass from objects in the Epstein regime. Integrating over the size distribution as the system evolves, 75% to 85% of the mass is in the Stokes or quadratic regime. Assuming scales with mass fraction, we expect 1.05–1.2, close to our derived 1.1. We plan to explore the relation between drag regimes and in a separate analysis.
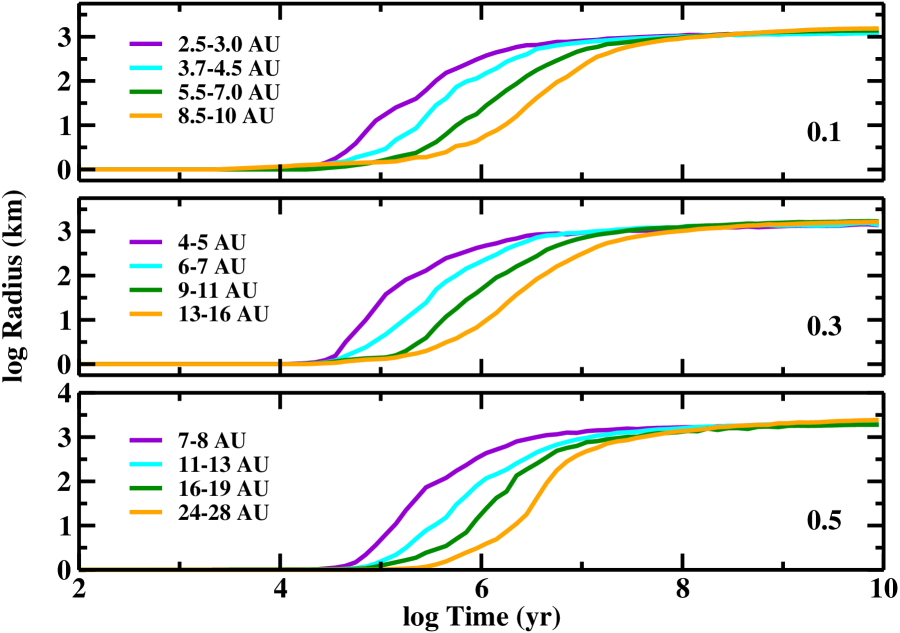
The growth rate also depends on the semimajor axis (Fig. 2). In the inner disks of 0.1–0.5 stars, protoplanets grow much more rapidly than at much larger semimajor axes. For all initial disk masses, the time scale for the radii of protoplanets to reach a fiducial radius scales as , the result predicted from analytic theory (eq. [7]).
Although the outcome of runaway growth is fairly insensitive to , the final masses of protoplanets depend on the fragmentation parameters. In these and other calculations with 1 m to 1 km planetesimals, runaway growth produces a few large objects and leaves most of the initial mass in 0.1–10 km objects. The collision energies of these leftovers are comparable to the gravitational binding energies of the largest objects. Because debris production scales with the ratio of to , weaker (stronger) leftovers produce substantial debris when the largest objects are smaller (larger). Thus, the size of the largest objects () correlates with (see also Inaba et al., 2003; Kobayashi & Tanaka, 2010; Kenyon & Bromley, 2010, 2012; Kobayashi et al., 2011, 2012).
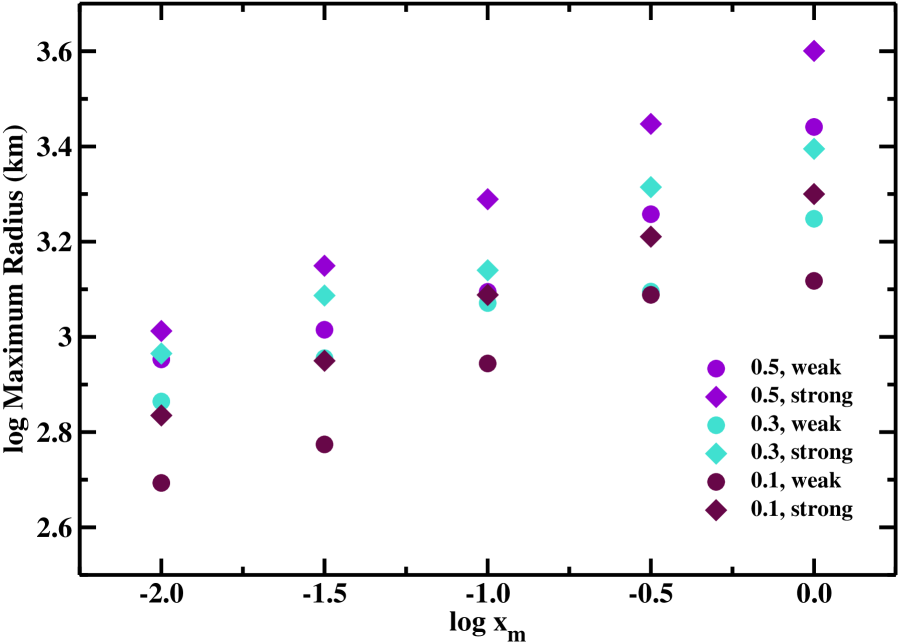
Fig. 3 illustrates the variation of with the fragmentation parameters. For identical initial conditions, the largest objects are 5% to 20% larger (20% to 100% more massive) when planetesimals are strong. Fragmentation has a larger impact on the outcome in more massive disks. When 1, is 15% to 20% larger when planetesimals are strong. At 0.01, fragmentation has a 5% to 10% impact on .
Finally, protoplanet growth is fairly independent of the exponent in the initial power-law relation between the surface density of solids and semimajor axis (Fig. 4). In calculations with similar total disk mass, the time scales for protoplanets to reach sizes of 300 km, 1000 km, and 3000 km depend primarily on the mass in an annulus and the fragmentation parameters. For fixed total mass, disks with and = 3/2 have more material in the inner disk compared to disks with = 1. Thus, protoplanets grow faster in the inner (outer) part of the disk for = 3/2 (1). Over the entire disk, similar initial masses yield similar .
To conclude this section on the growth of ensembles of 1 m to 1 km planetesimals orbiting 0.1–0.5 stars, we quote the median time scale for calculations to produce objects with radii of 300 km () and 1000 km () as a function of initial conditions. From eq. (7), we expect , where is a normalization factor and is the exponent in the surface density law. For every calculation, we verify the relation expected from theory. Our results match this expectation to within 1% to 2%. For every suite of 10–15 calculations with identical initial conditions, we derive the median time scale to reach = 300 km or 1000 km. Among suites with identical fragmentation parameters, we derive the best-fitting and as a function of , where . This analysis yields and the range of listed in Table 4. For disks with masses similar to the MMSN and composed of 1 m to 1 km planetesimals, the time scale for protoplanets to grow to 300 km is roughly 0.1–1 Myr. Growth times for 1000 km protoplanets are roughly a factor of ten longer.
3.2 Growth with a Narrow Range of Initial Planetesimal Sizes
We now examine results for an ensemble of calculations where most of the initial mass is concentrated in the largest planetesimals, with = 0.5. Because protoplanet growth is fairly independent of the surface density relation, all calculations assume an initial . For simplicity, all calculations adopt the fragmentation parameters. The results in §3.1 demonstrate that disks composed of strong planetesimals yield protoplanets with maximum radii roughly 10% larger than disks composed of weak planetesimals (see also Kenyon & Bromley, 2010, 2012). To understand how depends on the initial planetesimal size, we consider disks with = 1–1000 km.
Compared to calculations with 1 m to 1 km planetesimals, we expect several clear differences in the timing and maximum radius of protoplanets. With all of the mass concentrated in large planetesimals, damping from gas drag is much less effective at countering stirring by dynamical friction and viscous stirring. Weaker damping yields larger random velocities for small planetesimals. With less mass in small planetesimals, dynamical friction cannot brake the velocities of the large planetesimals. Less braking implies larger random velocities for the larger planetesimals. Larger velocities lead to longer relaxation times and smaller gravitational focusing factors. Thus, we predict large protoplanets form on much longer time scales.
Concentrating the mass in the largest protoplanets also limits fragmentation and the collisional cascade. Longer periods of orderly growth and less dramatic runaway growth allow smaller planetesimals to grow larger. Larger planetesimals are harder to fragment. With less fragmentation, the largest protoplanets accrete from a more massive reservoir and can grow larger. For calculations with 3 km, disks have more and more material in very large objects that are very hard to fragment. Thus, we predict more massive protoplanets for calculations with = 1 km and much more massive protoplanets for larger .
For our typical starting conditions with , viscous stirring often plays a larger role when the calculations begin. For planetesimals with 3 km, planetesimal velocities are in the shear regime, where dynamical friction is ineffective (Ohtsuki et al., 2002). Although growth in the shear regime is rapid (e.g., Goldreich et al., 2004), the stirring time scale is much shorter than the growth time. Thus, viscous stirring rapidly increases planetesimal velocities and slow, orderly growth begins in the dispersion regime (see also Kenyon & Bromley, 2012).
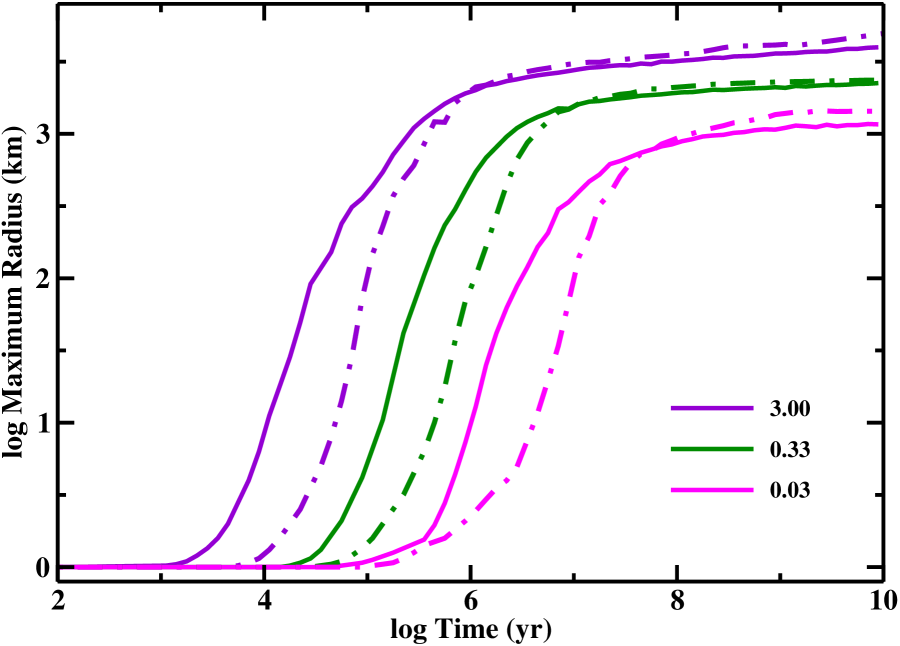
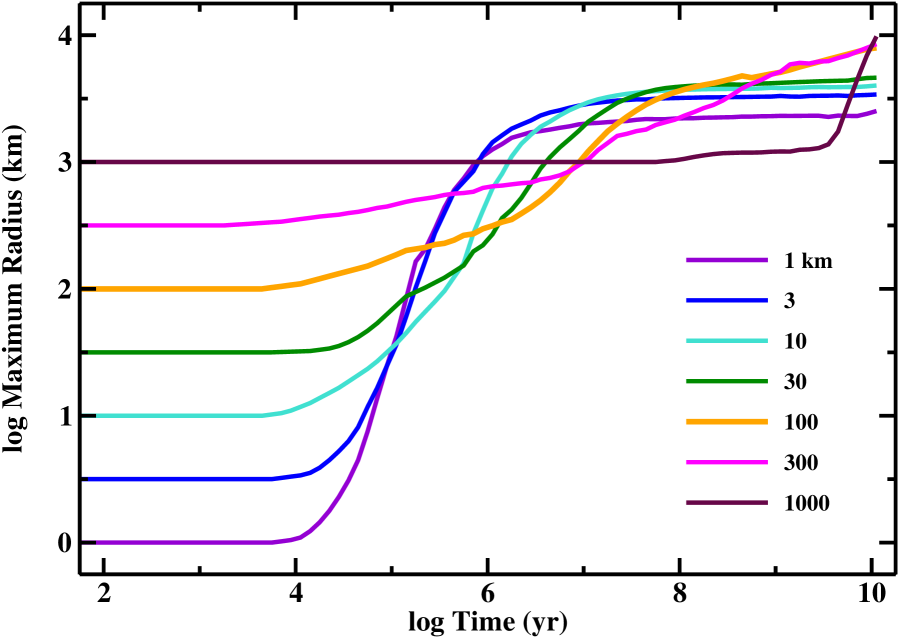
Fig. 5 illustrates several of these points for calculations of disks composed of planetesimals with = 1 km surrounding a 0.5 central star. When = 3 (solid lines in the Fig.), runaway growth begins at yr for = 3 (solid violet line), at yr for = 0.33 (solid green line), and at yr for = 0.03 (solid magenta line). When most of the mass is concentrated initially in large planetesimals ( = 0.5, dot-dashed lines), runaway growth begins at yr ( = 3) to yr ( = 0.03). Despite the later start, calculations with = 0.5 result in 5% larger protoplanets at 100 Myr.
Fig. 6 shows that more massive protoplanets result from initially more massive planetesimals. When most of the mass is concentrated in the largest planetesimals, the growth time initially scales with the size of the largest particle size (eq. 7; see also Goldreich et al., 2004; Ormel et al., 2010a). Thus, disks composed of small planetesimals achieve runaway growth faster than disks composed of large planetesimals. However, runaway growth with smaller planetesimals leaves more material in objects that are easier to fragment. Thus, growth with 30–300 km planetesimals produces much larger protoplanets than growth with 1–10 km planetesimals (see also Kenyon & Bromley, 2010).
Calculations with most of the initial mass in 1000 km planetesimals are an exception to this trend (Fig. 6). When = 1, it takes more than 100 Myr for collisions to produce objects somewhat larger than 1000 km. This slow growth phase lasts nearly 5 Gyr, when ‘runaway growth’ yields objects larger than 3000 km. However, this runaway is still slow: it takes another 5 Gyr for objects to grow to 5000 km and another few Gyr to reach km. Thus, massive planets reach their maximum mass at times, 15 Gyr, larger than the age of the universe.
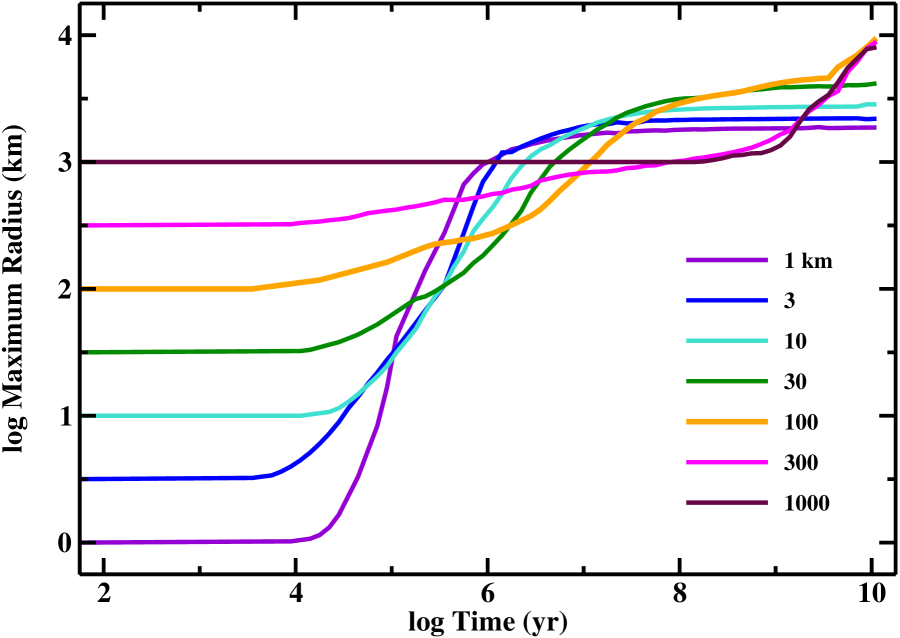
Figs. 7–8 repeat plots of the evolution of with time for calculations with 0.3 and 0.1 central stars. These plots show the same trends. Calculations with smaller planetesimals reach runaway growth sooner, but collisional cascades remove more material from the disk before large protoplanets can reach their maximum sizes. Thus, disks with 30–300 km planetesimals produce the largest protoplanets.
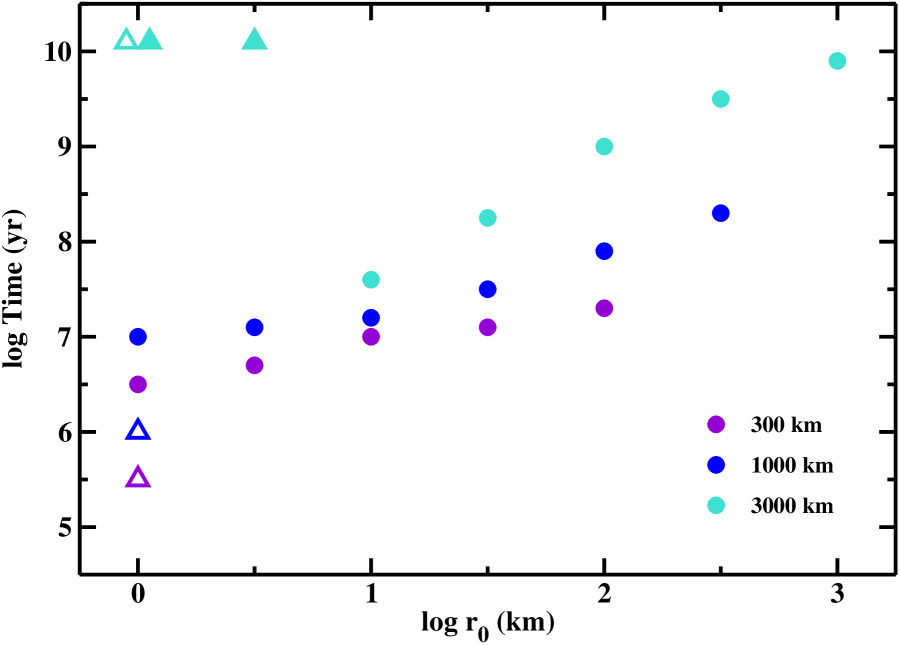
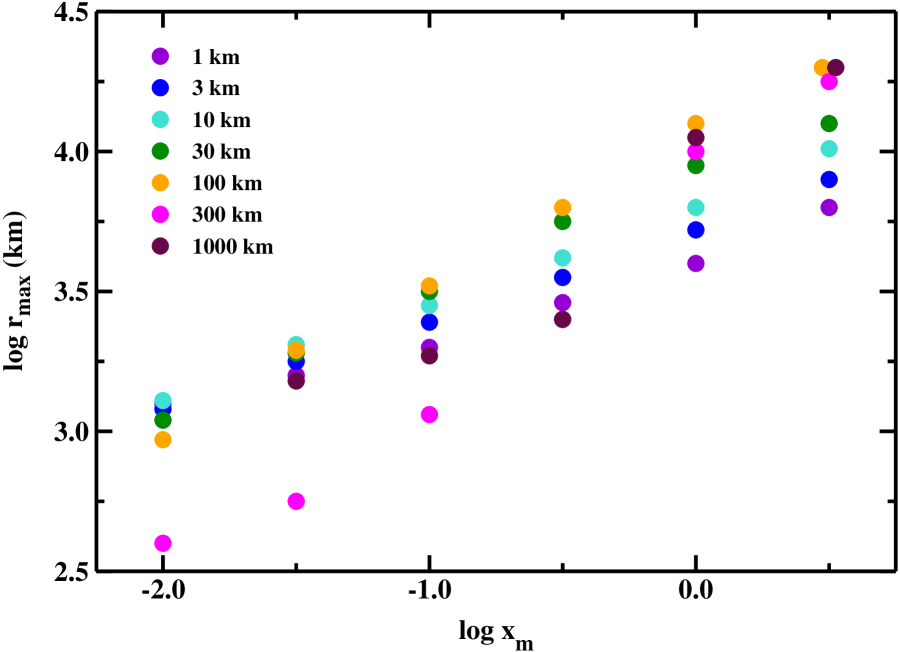
To illustrate these conclusions in more detail, Fig. 9 shows the time required to produce 300 km (), 1000 km (), and 3000 km () objects as a function of the initial planetesimal size (see Table 5). When the initial mass in planetesimals is spread over objects with radii of 1 m to 1 km, growth rapidly produces 300 km and 1000 km objects (open triangles). Growth with most of the mass in 1 km planetesimals takes roughly three times longer. In both cases, the collisional cascade prevents protoplanets from reaching 3000 km (symbols at log time = 10.1). As increases, it takes longer and longer to produce 300–1000 km protoplanets. Aside from the = 1-3 km models, all calculations with most of the mass in large planetesimals produce 3000 km objects.
Although larger planetesimals grow slowly, they often produce much larger protoplanets (Fig. 10). At small disk masses ( 0.1), the long time scales leading to runaway growth prevent the formation of massive protoplanets. Smaller planetesimals then produce larger protoplanets. For larger disk masses ( 0.1), however, larger planetesimals yield much more massive protoplanets. The time scales for large planetesimals to reach runaway growth are then long but still shorter than a Hubble time. With reduced losses from the collisional cascade, these disks have more than enough time to produce super-Earth-type planets in 5–10 Gyr.
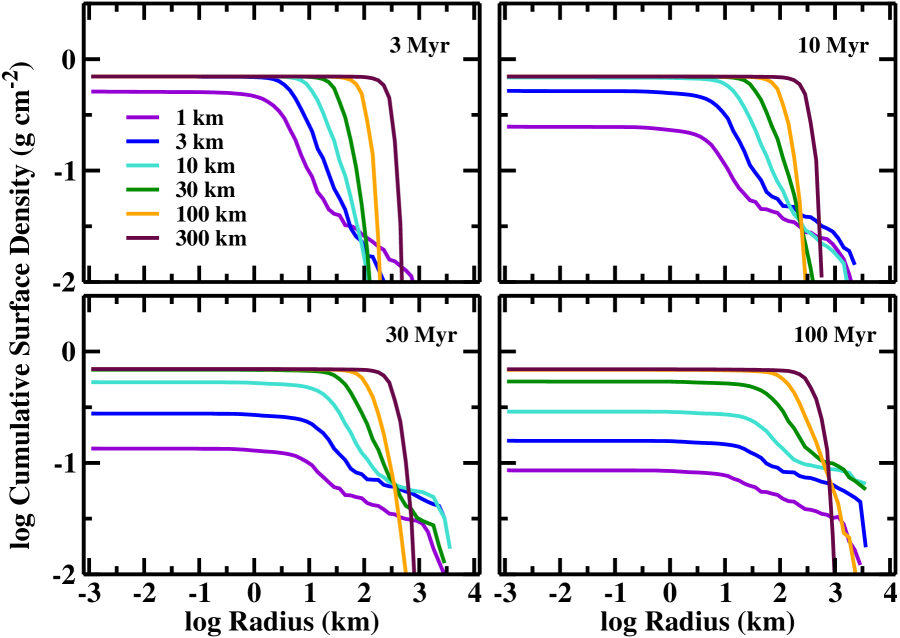
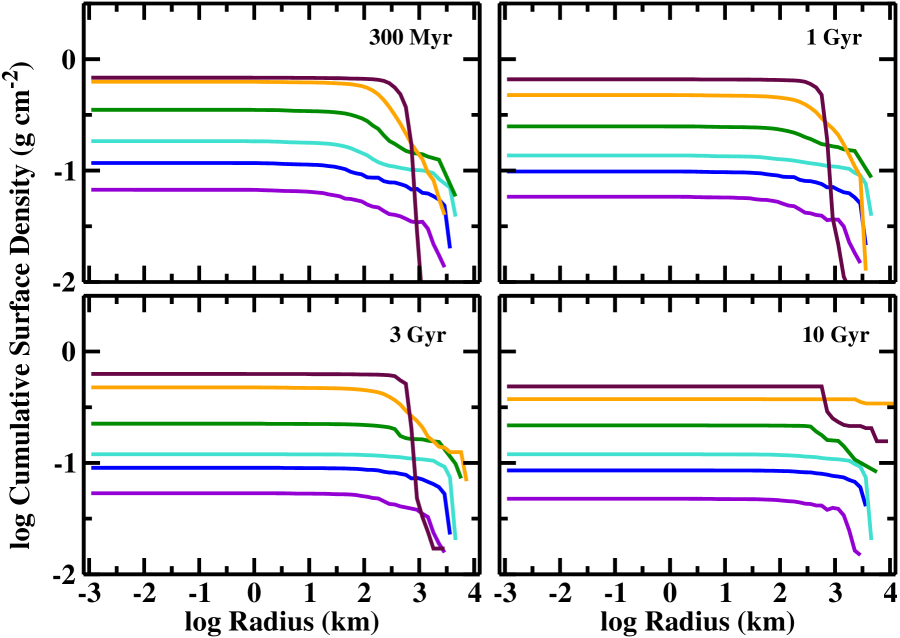
To conclude this section, Figs. 11–12 plot the evolution of the median size distribution for calculations with = 1–1000 km. The first figure shows the evolution for the first 100 Myr; the second figure shows the evolution for 300 Myr to 10 Gyr.
In Fig. 11, the upper left panel shows the rapid growth of an ensemble of 1 km planetesimals relative to other starting sizes. At 3 Myr, some objects have already reached radii of 1000 km. However, stirring by these large objects has also started the collisional cascade: the cumulative surface density is roughly 10% smaller than the starting . As time proceeds, the largest objects in this calculation continue to grow; the surface density continues to fall. After 300 Myr (lower right panel), the collisional cascade has removed roughly 90% of the initial mass in solid material.
For ensembles of larger planetesimals, the rate of growth and the loss of material from the collisional cascade correlate with initial planetesimal size. At 10 Myr, calculations with = 3 km contain the largest objects. By 100 Myr, calculations with = 10–30 km contain the largest objects. Within this sequence of , the fraction of material lost to fragmentation declines from 90% ( = 1 km) to 80% (3 km) to 35% (10 km) to 10% (30 km). Lower fragmentation rates allow calculations with larger to produce larger protoplanets.
In Fig. 12, the evolution from 300 Myr to 10 Gyr shows similar trends. After 10 Gyr, calculations with = 1 km have lost almost 95% of their initial mass; simulations with 300–1000 km planetesimals have lost less than 5%. As a result, disks initially composed of large planetesimals produce much larger protoplanets.
3.3 Summary of Coagulation Calculations
The coagulation calculations in §3.1 and §3.2 demonstrate that collisional evolution of a disk of planetesimals leads to the production of planets ranging in mass from Pluto to roughly ten Earth masses. From the full suite of calculations, we infer five specific conclusions.
-
•
Results from coagulation calculations match analytic theory. For objects with radii 100–1000 km, the growth time is where 1.1 and is the exponent in the power-law relation between surface density and semimajor axis.
-
•
Outcomes of planet formation are relatively insensitive to the slope of the power law relation between the disk surface density and the semimajor axis. For similar total masses, disks with shallower surface density gradients have less (more) mass in the inner (outer) disk than disks with steeper surface density gradients. Analytic theory and coagulation calculations demonstrate that the time scale to produce protoplanets with radius depends on the local surface density. Thus, massive protoplanets form more rapidly in the inner regions of disks with steep surface density gradients and in the outer regions of disks with shallow surface density gradients. However, the maximum protoplanet radius does not depend on the surface density gradient.
-
•
Fragmentation is important for setting the growth time and the maximum radius of growing protoplanets with 300–500 km. When planetesimals are small and relatively weak, protoplanets with 1000 km take longer to form and grow to smaller masses. For calculations starting with 1–3 km planetesimals and ‘standard’ fragmentation parameters, 3000 km. These systems probably produce copious amounts of dust (see also Kenyon & Bromley, 2008, 2010).
-
•
The initial sizes of planetesimals have a major impact on the growth of protoplanets. When most of the solid mass is initially in large planetesimals with radius , protoplanets grow more slowly with increasing . As increases, however, fragmentation has a smaller and smaller impact on protoplanet growth. Thus, calculations with larger yield larger protoplanets.
-
•
The initial size distribution of planetesimals also plays a critical role in outcomes of planet formation. When 0.1 km and the initial size distribution is broad, a balance between viscous stirring and gas drag enables large gravitational focusing factors and promotes rapid growth of protoplanets. When the size distribution is narrow, gas drag is less effective. Growth is slower.
There are two main sources of uncertainty in these conclusions.
-
•
In disks composed of large planetesimals, Earth-mass protoplanets may eject leftover planetesimals before reaching super-Earth masses. As they grow, protoplanets stir up much smaller objects within several Hill radii of their orbits to velocities comparable to their escape velocity, 10 for an icy Earth-mass planet. At the inner edges of the disks considered here, the escape velocity from the star is also 10 . Thus, Earth-mass planets clear their orbits of smaller objects and eject these objects from the planetary system. However, as the mass of the protoplanet approaches an Earth-mass, small objects with radii less than 1000 km contain less than 5% of the mass of the protoplanet. Thus, scattering probably has little impact on the final mass of the protoplanet.
-
•
Merger rates of sub-Earth mass protoplanets into Earth mass or larger protoplanets rely on the particle-in-a-box cross-section instead of direct -body calculations. As more and more mass is concentrated into a few large objects, the particle-in-a-box cross-section provides a poorer and poorer representation of the likely collision rate. Several test simulations using the -body component of Orchestra suggest that mergers among sub-Earth mass protoplanets occur over a somewhat broader range of time scales than suggested by pure coagulation calculations. However, mergers still occur on roughly 1 Gyr time scales. Thus, more sophisticated calculations are unlikely to change our general conclusions.
Despite some uncertainties, our results lead to several broad conclusions for the outcomes of protoplanet growth around low mass stars.
-
1.
In systems with short gas depletion times, disks composed primarily of large planetesimals with 10 km are unlikely to form gas giant planets. In the core accretion theory, formation of gas giant planets requires the growth of a multi-Earth mass icy core before the dissipation of the gaseous disk (e.g., Pollack et al., 1996; Lissauer et al., 2009). With a gas dissipation time scale of 1 Myr, icy cores must form in 1 Myr. In disks of large planetesimals, it takes much longer than 1 Myr to form Earth-mass icy cores.
-
2.
Disks composed primarily of large planetesimals can produce icy super-Earths. Although super-Earth formation occurs at 1–10 Gyr, the long main sequence lifetimes of 0.1–0.5 stars guarantee that massive disks will form several icy super-Earths at distances of several AU from their host stars.
-
3.
In disks composed of small planetesimals with 1–3 km, 1000–2000 km icy cores grow in less than 1 Myr. With the gas surface density still large, the gas can damp the velocities of small particles, preventing the collisional cascade (Rafikov, 2004; Kobayashi et al., 2010). If the cascade produces large numbers of small particles with radii of 1 cm, low mass icy cores rapidly accrete them and evolve into Earth mass or larger objects (Rafikov, 2004; Kenyon & Bromley, 2009; Ida & Lin, 2010; Ormel & Klahr, 2010; Ormel et al., 2010b; Bromley & Kenyon, 2011a; Lambrechts & Johansen, 2012). However, gas drag may halt the cascade at larger sizes, 1–10 m, where accretion by large objects is less effective (e.g., Kobayashi et al., 2010, 2011). Thus, these systems seem unlikely sources of super-Earths or gas giant planets.
Constructing observational tests from these predictions requires one additional ingredient, for newly-formed protoplanets. With current technology, only direct imaging and microlensing observations can detect super-Earths over the range of semimajor axes considered in our calculations. If planets drift inward significantly, however, then radial velocity and transit observations can detect them. For massive planets, strong gravitational interactions among closely-packed planets at large often yield one or more planets orbiting much closer to the central star (e.g., Rasio & Ford, 1996; Jurić & Tremaine, 2008; Mann et al., 2010; Nagasawa & Ida, 2011). Because large ensembles of scattering calculations are cpu intensive, we plan a separate study of this issue. Less dramatically, radial migration through the circumstellar disk can deposit planets of all masses close to the central star (e.g., Ida & Lin, 2008; Mordasini et al., 2009). Thus, we explore whether migration can transport super-Earths formed at late times from 2–10 AU to 1 AU.
4 MIGRATION
To examine whether planets formed at 2–10 AU migrate inwards, we consider super-Earths formed on time scales of 100 Myr to 1 Gyr in a protostellar disk. Although migration of super-Earths through a young gaseous disk is often efficient (Lin & Papaloizou, 1986; Ward, 1997; Paardekooper et al., 2010), there is no disk gas remaining after 100 Myr. Thus, we consider the radial motion of super-Earths through a remnant disk of solid debris (Ward, 1997; Kirsh et al., 2009; Bromley & Kenyon, 2011b; Ormel et al., 2012).
4.1 Migration Through a Planetesimal Disk
Migration through a disk of solid material depends on the mass of the planet and the local properties of the planet. Close to the planet, the Hill sphere defines a region where the gravity of the planet roughly balances the gravity of the central star. If is the mass of the planet and is its orbital semimajor axis, the Hill radius is
| (9) |
For low mass stars, .
Interactions between a planet and nearby planetesimals set the direction and pace of migration. A large planet tries to clear its orbit by scattering smaller planetesimals. Scattering among planetesimals tries to fill the orbit of the planet. When the planet dominates, it reduces the surface density of planetesimals along its orbit and increases the surface density of planetesimals on either side of its orbit. Because the surface density enhancements are not axisymmetric, the planet feels a torque from the planetesimals. If the sum of all of the torques does not vanish, the large objects migrate radially inward or outward (e.g., Goldreich & Tremaine, 1982; Ward, 1997; Ida et al., 2000; Kirsh et al., 2009; Ormel et al., 2012).
When scattering overcomes viscous spreading, planets open gaps in the radial distribution of planetesimals. For convenience, we define the Hill radius necessary for a planet to open up a gap in a cold disk of solid planetesimals where the vertical scale height is smaller than the Hill radius. Adopting typical conditions in disks around low mass stars, this radius is (e.g., Rafikov, 2001; Bromley & Kenyon, 2013)
| (10) |
Planets with 0.03 AU at 10 AU have 0.008 (eq. [9]). Thus, low mass planets open up gaps in disks of planetesimals.
For planets with , there are two possible modes of migration (e.g., Ida et al., 2000; Kirsh et al., 2009; Bromley & Kenyon, 2011b, 2013). If the planet can clear a gap in its corotation zone and migrate across this gap in one synodic period, the planet undergoes fast migration. This mode is similar to type III migration through a gaseous disk (Masset & Papaloizou, 2003). Planets with Hill radii in the range ( 0.01–0.3 ) satisfy this condition, where
| (11) |
As in type II gaseous migration (e.g., Syer & Clarke, 1995), planets with migrate through the disk more slowly.
For all three modes of migration through a disk of planetesimals, the pace of inward or outward migration is more leisurely than migration through gas (Bromley & Kenyon, 2011b, 2013). For planets with in a cold disk where (see eq. [4]) and where for the background planetesimals is small, analytic results yield
| (12) |
Planets with migrate rapidly in the fast mode. This rate is independent of the mass of the planet:
| (13) |
For planets capable of opening up a gap in the disk (), the expected migration rate is:
| (14) |
Planet migrate rapidly (i) when the disk is more massive, (ii) when the planet is more massive, and (iii) when the planet is farther away from the central star.
In a warm disk, migration rates depend on the eccentricity of planetesimals (e.g., Ida et al., 2000; Kirsh et al., 2009; Bromley & Kenyon, 2011b). Using an elegant analytic approach, Ormel et al. (2012) derive rates from encounters with distant and nearby planetesimals. Their results indicate . For an Earth-mass planet with 0.02 at 10 AU around a 0.3 star, their migration rates are comparable to our analytic rates.
The analytic results for planets embedded in cold planetesimal disks have several consequences for growing icy planets around low mass stars.
-
•
Low mass planets with cannot migrate very far through the disk. For disks with 1 in leftover planetesimals, the nominal rates are roughly 1 AU per Gyr. Once large planets capable of migrating form, likely surface densities of leftover planetesimals in the disk are much smaller.
-
•
Although intermediate mass planets with 0.01-0.3 can migrate rapidly, fast mode migration is probably rare. Oligarchic growth usually produces many planets in this mass range. These oligarchs rapidly stir up leftover planetesimals along their orbits. As they migrate, they leave behind wakes of highly stirred planetesimals. Oligarchs cannot migrate through these wakes (Bromley & Kenyon, 2011b). Thus, fast migration generally stalls until many oligarchs merge into a few massive oligarchs. After these mergers, the radii of massive oligarchs exceed . These oligarchs then open a gap in the disk and migrate more slowly.
-
•
Massive oligarchs with migrate at typical rates of 1 AU Myr-1. Massive oligarchs can migrate through the wakes of other oligarchs and can drift close to the central star. As the planet migrates inward, rates decline. Continued stirring and depletion of the disk by fragmentation also slows migration (Bromley & Kenyon, 2011b). Even if rates slow by 2–3 orders of magnitude, the long lifetimes of 0.1–0.5 stars suggest that some icy planets might migrate from 10 AU to 0.1 AU.
These considerations indicate that massive planets probably migrate through the leftover planetesimal disk on time scales of 1 Myr to 1 Gyr. Because the analytic rates rely on the properties of cold disks instead of self-consistent disk models, testing this conclusion requires numerical calculations of planet migration through plantesimal disks. To explore likely outcomes, we now discuss representative calculations of planets migrating through disks of leftover planetesimals.
4.2 Numerical Calculation of Migration Through a Planetesimal Disk
To examine migration through a protostellar disk in more detail, we consider a suite of numerical simulations of a single planet embedded in a planetesimal disk. The simulations explore the behavior of icy planets ( 1 , 0.25 and 2 , 2.5 ) at semimajor axes = 1, 3, and 10 AU in orbit around 0.1, 0.3, and 0.5 stars. To derive the range of plausible migration rates, we consider disks where the surface density scale factor is = 0.01, 0.1, and 1 (see eq. [4]).
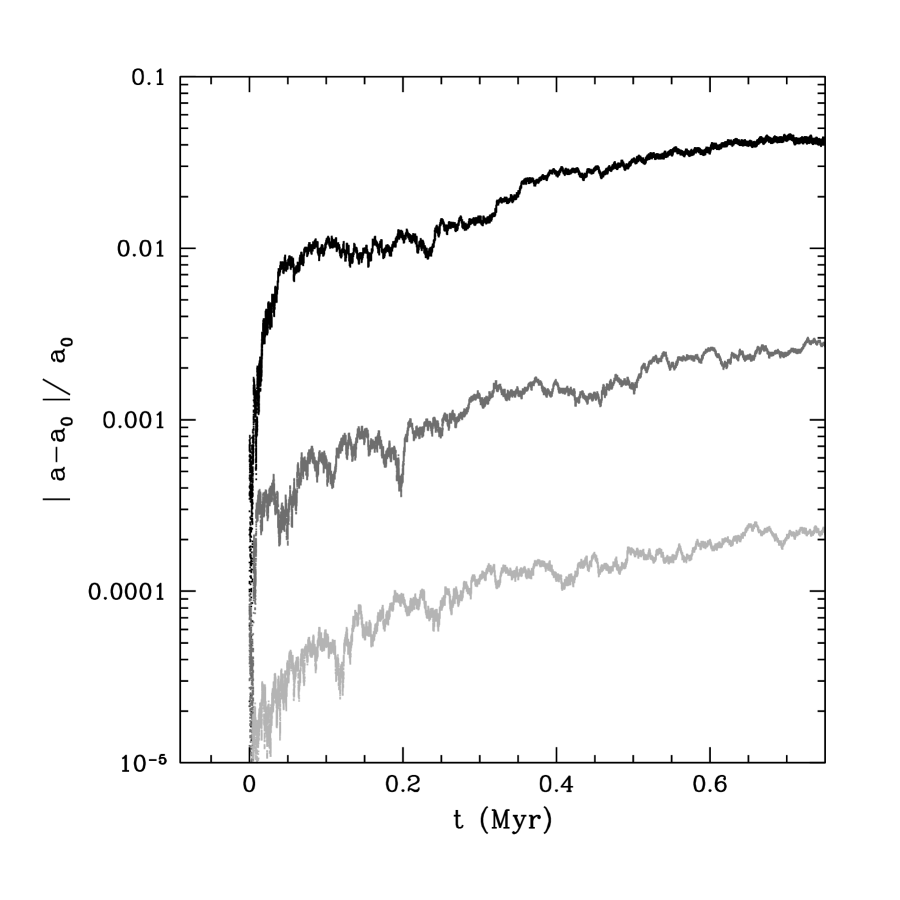
To perform the calculations, we use the -body component of Orchestra. We model the planetesimal disk as a swarm of massless tracer particles with a radial extent of 0.75 to 2.0, where is the initial semimajor axis of the embedded planet. To enable extensive simulations with large number of tracers, we calculate the migration of the planet from the total change in angular momentum of the tracers (Bromley & Kenyon, 2013). Without an embedded planet, long integrations of the tracers conserve angular momentum to machine accuracy. Migration rates derived from the angular momentum of massless tracers agree very well with rates derived from more cpu intensive calculations with massive swarm particles (Bromley & Kenyon, 2013).
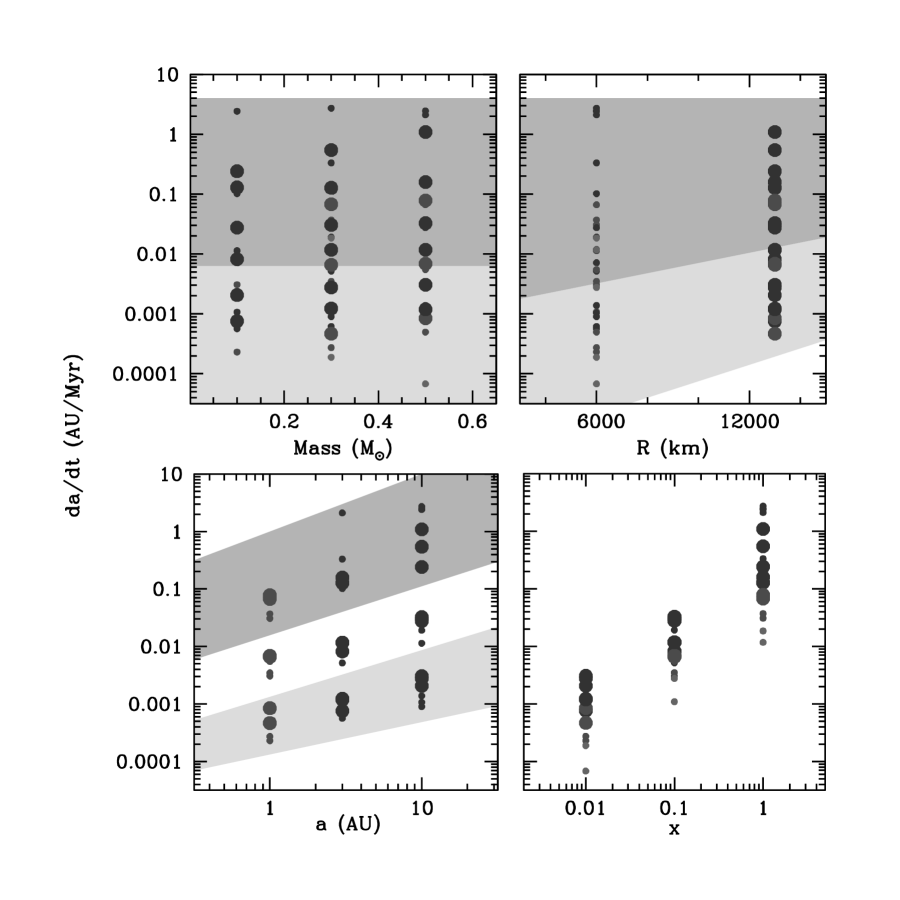
Figure 13 summarizes our results. In the lower right panel, the migration rate depends on the local disk surface density, with AU Myr-1 for sub-Earth mass and super-Earth mass planets orbiting 0.1–0.5 stars. In all disks, a migrating planet scatters lower mass planetesimals along its orbit. Angular momentum and energy exchange during a scattering event produces migration. More massive disks supply more planetesimals to the planet’s Hill sphere. Thus, planets migrate more rapidly in more massive disks.
Migration is also sensitive to the planet’s semimajor axis (Fig. 13, lower left panel). The rates scale as AU Myr-1. The variation of disk mass with produces most of the change of with . Disks with have more mass at large than at small . Thus, planets at larger encounter and scatter more planetesimals along their orbits than planets at smaller .
Trends in the migration rate with planet mass (Fig. 13, upper right panel) demonstrate that more massive planets migrate more rapidly. For planets in low mass disks, the rate scales with , with –1/2. In more massive disks, the migration rates scale more weakly with the mass of the planet.
Finally, there is no strong trend in the migration rate with stellar mass (Fig. 13, upper left panel). Much of this formal insensitivity to comes from the way in which we define ; a constant value of corresponds to a constant ratio of . Still, over a broad range of disk masses and semimajor axes, the drift rate for a planet of mass varies little with stellar mass for 0.1–0.5 stars
Figure 14 emphasizes the importance of disk mass to radial migration. There is a clear linear dependence of the drift rate on . The Figure also illustrates the ‘choppiness’ of migration in planetesimal disks. Even though the mass of the migrating planet is between and times larger than the mass of individual “planetesimals” in the disk, the drift rate changes due to discreteness noise. The migrating planet simply does not encounter planetesimals at a constant rate. We expect this phenomenon to persist in more realistic simulations of growing planets, where the distribution of the smaller objects is broad in mass and patchy in space.
In general, the numerical results agree with analytic expectation. The basic migration rate of 0.1–1 AU Myr-1 derived from the simulations agrees well with the analytic rate of 0.4–0.5 AU Myr-1 (see eq. [14]). As expected, the migration rate scales linearly with disk mass. Although the numerical migration rates scale with , , and , the power-law relations implied by the numerical simulations differ from the analytic results. In the simulations, migration rates are more sensitive to and less sensitive to or . We speculate that these differences result from the way migration proceeds when the small planetesimals have a vertical scale height larger than the Hill radius of the planet (see also Bromley & Kenyon, 2011b). Verifying this speculation requires many more simulations which are beyond the scope of this paper.
4.3 Semi-analytic migration model
Constructing predictive models for the migration of super-Earths through a disk of planetesimals around a low mass star requires a hybrid calculation covering a broad range of semimajor axes, 0.1–10 AU, which follows (i) the growth of planets as a function of semimajor axis with the coagulation code and (ii) the migration of planets through the sea of left over planetesimals with the -body code. This calculation is computationally expensive. To develop an initial set useful predictions, we first explore a simple algorithm.
Our model assumes a massive planet grown within a sea of small particles with an initial surface density scale factor = 1. Mergers of planetesimals into a planet depletes the surface density. Thus, the scale factor declines with time. Planets form more rapidly at smaller (eq. [8]). At a given time, the scale factor increases with : the inner disk is more depleted than the outer disk.
To establish a reference for migration in a depleted disk, we begin with migration in disks with constant . From Fig. 13, we adopt a simple expression for the migration rate:
| (15) |
For the initial conditions, we place a single planet at the inner edge of the disks considered in §3. Thus = 7 AU for a 0.5 star, = 4 AU for a 0.3 star, and = 2.5 AU for a 0.1 star. With fixed, it is straightforward to integrate the time evolution of for a planet with mass .
This approach ignores the variation of with the eccentricity of leftover planetesimals. In Ormel et al. (2012), migration rates for 0.02–0.05 are a factor of 2 larger than our adopted rate. Typical for leftover planetesimals is probably in this range; thus, the rate in eq. (15) is somewhat conservative.
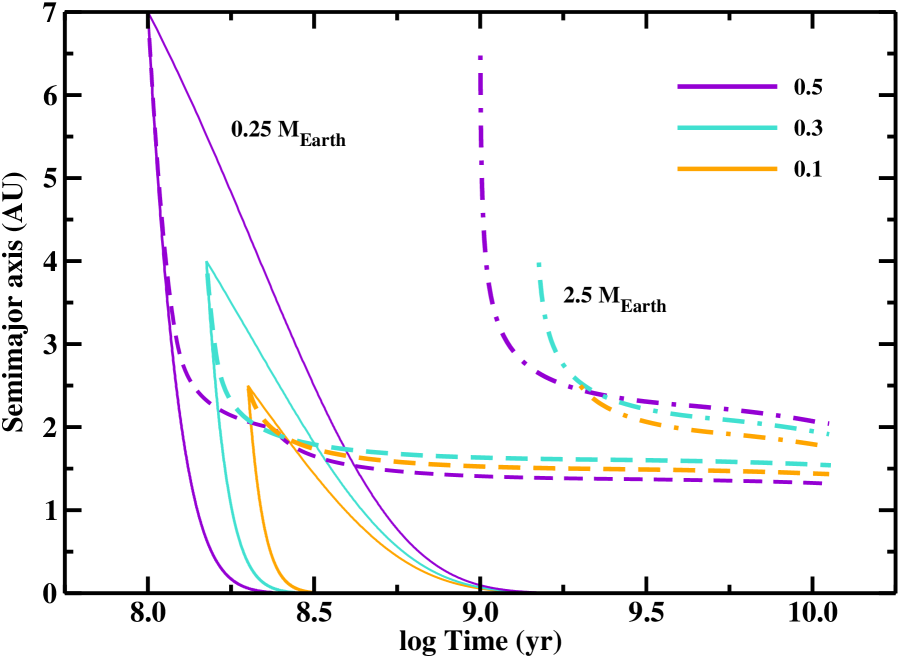
The solid lines in Fig. 15 illustrate the long-term drift of a 0.25 planet through disks with = 0.1 (upper set of three curves) and = 1.0 (lower set of three curves). After this planet forms at 100–200 Myr, it takes from 100 Myr ( = 1) to 1 Gyr ( = 0.1) to migrate to within 0.01 AU of the host star. In disks with more depletion ( 0.1), the migration time is longer, 3 Gyr for = 0.01 and 10 Gyr for = 0.001. In all cases, however, migration through a disk with constant results in super-Earth planets very close to the host star.
To explore how migration changes in a disk with a scale factor that depends on semi-major axis and time, we adopt results from published coagulation calculations (e.g., §3; Kenyon & Bromley, 2004a, 2006, 2008, 2010). We identify the formation time for a planet with mass (e.g., eq. [8] and Tables 4–5) and we infer the scale factor for small planetesimals remaining in the disk:
| (16) |
where is the formation time for the planet and and are parameters that depend on stellar mass and the fragmentation parameters. Typically, and 1.
Combined with eq. (15), this expression allows us to track the migration of a planet through a time-dependent depleted disk of small particles. After setting the initial conditions as a function of stellar mass as outlined above, we then specify the stellar mass dependent parameters for eq. (16). Once these are set, we evolve for a constant mass planet using a simple explicit numerical integration.
Although this model does not include a prescription for the subsequent growth of the planet or any dynamical interactions with planets formed at smaller (e.g., Rogers et al., 2011), it captures several important features of migration in a planet forming disk. Because we begin the evolution when a planet of mass forms, the planet begins to migrate at the appropriate rate through a disk with the appropriate . By specifying a reasonable for the small planetesimals which remain in the disk at all , we accurately derive the migration rate as the planet migrates closer and closer to the central star. In coagulation models, planets form faster closer to the host star. Thus at any time , the fraction of the initial mass remaining in small planetesimals increases outwards from the central star. Because the planet migrates through a disk with smaller and smaller , it migrates more and more slowly. Our goal is to learn whether the results from our numerical calculations of coagulation and migration allow a planet to migrate very close to the host star.
In a realistic depleted disk, planets migrate modest distances. When a 0.25 planet forms at roughly 100–200 Myr, it begins to migrate through a disk where small planetesimals contain most of the initial mass. Thus, the planet migrates inward fairly rapidly (Fig. 15, dashed lines). As the planet migrates inward, it drifts through planetesimals with a smaller and smaller fraction of the total mass in solids. Thus, migration stalls. For the semi-analytic model outlined above, migration for 0.25 planets effectively ceases when 1.5 AU.
Although more massive planets form later in time, they still migrate close to their parent star (Fig. 15, dot-dashed lines). In disks with identical , a massive planet with = 2.5 migrates roughly 3 times faster than a less massive planet with = 0.25 (eq. [15]). At the time a more massive planet forms, however, there is much less material in small leftover planetesimals. The much smaller mass in planetesimals results in a factor of roughly 10 reduction in migration rate. Thus, the 2.5 planet migrates roughly 3 times more slowly than the 0.25 planet. Migration for this massive planet ends at a larger semimajor axis, 2 AU.
The final semimajor axis for migrating icy planets depends on the amount of mass in small planetesimals remaining in the inner disk. Compared to the nominal model illustrated with the dashed and dot-dashed lines in Fig. 15, inner disks with more mass in small planetesimals enable more migration. Inner disks with less mass restrict migration considerably. For an ensemble of systems with a typical range of mass in small planetesimals in the inner disk, we do not generally expect planets to migrate inside of roughly 1 AU.
Despite these general results, some newly-formed icy super-Earths may migrate rapidly to semimajor axes of 0.1 AU. In roughly 5% of our coagulation calculations, collision rates ‘conspire’ to produce a super-Earth 20% earlier than the typical formation time. If the disk interior to this super-Earth is normal, then it will migrate 20% to 40% faster than the typical super-Earth and reach semimajor axes much closer to the central star. Modifying our semi-analytic model to treat these outliers yields final semimajor axes of 0.1–0.2 in 1% to 3% of disks with initial 1.
4.4 Summary of Migration Calculations
Our discussion leads to several specific conclusions for the migration of icy planets orbiting low mass stars.
-
•
Results for numerical calculations of planets migrating through planetesimal disks generally match analytic theory. The numerical rates have the same magnitude as the analytic results and scale with disk mass as expected. Scaling with semimajor axis, planet mass, and stellar mass are somewhat different from the analytic results.
-
•
Earth-mass planets migrate at reasonably large rates, 1 AU Myr-1, through a planetesimal disk with a scaled surface density comparable to the minimum mass solar nebula around a 0.1–0.5 star (see also Ormel et al., 2012). Even though these planets might form quite late in the lifetime of these stars, the rates are sufficient to allow the planet to drift close to the star.
-
•
Combining coagulation and migration calculations into a simple model for the migration of an icy Earth-mass planet in an evolving planetesimal disk, we conclude that many Earth-mass planets formed at 3–7 AU can migrate to 1–2 AU in 1–3 Gyr. A small fraction of rapidly formed super-Earths might migrate to 0.1–0.2 AU. Our model predicts a few icy super-Earths at 0.1–0.2 AU for every 100 icy super-Earths at 1–2 AU.
-
•
Our simple migration algorithm demonstrates that migration is very sensitive to the mass of small planetesimals within the inner disk. Compared to a disk with a power-law surface density and uniform depletion, planets migrate much smaller distances in a realistic disk where the depletion increases inversely with semimajor axis. If planet formation within the inner disk is more efficient than our nominal model, the inner disk contains little mass in small planetesimals. Icy planets fail to migrate. When planet formation is less efficient, however, a more massive inner disk enables icy planet migration inside 1 AU.
These conclusions suggest two formation paths for icy planets close to their parent stars.
-
•
Early formation channel: super-Earths form rapidly on time scales of 1–10 Myr. These planets migrate close to their parent star while the star contracts on its Hayashi track to the main sequence.
-
•
Late formation channel: super-Earths form slowly on time scales of 1 Gyr. These planets migrate when the parent star is on the main sequence.
Aside from the identification of two clear formation channels, it is encouraging that our calculations provide a robust way for planets to migrate from 5–10 AU to 1–2 AU (and occasionally to 0.1–0.2 AU). As these planets migrate inward, they probably encounter other planets formed closer to the star. Dynamical interactions among these planets may lead to the placement of some planets much closer to the parent star (e.g. Rasio & Ford, 1996; Jurić & Tremaine, 2008). Identifying the outcomes of these interactions requires coagulation and migration calculations which cover a larger range of semimajor axes (e.g., 0.1–10 AU) than those discussed in §3–4. Faster parallel computers now enable these calculations. Thus, more comprehensive theoretical predictions should be available in 1–2 years.
5 DISCUSSION
5.1 Comparisons with Previous Results
Current theoretical studies propose a broad range of mechanisms for super-Earth formation within a protoplanetary disk. In the disk instability picture, photoevaporation (e.g., Boss, 2006) or tidal processes (e.g., Nayakshin, 2010) may yield super-Earth leftovers from Jupiter-mass protoplanets. Coagulation models can produce rocky super-Earths very close to the host star (Montgomery & Laughlin, 2009; Ogihara & Ida, 2009) and icy super-Earths somewhat farther from the parent star (Laughlin et al., 2004; Ida & Lin, 2005; Kobayashi et al., 2010; Mann et al., 2010; Rogers et al., 2011). All of these calculations yield super-Earths rapidly, on time scales of 1–10 Myr or less for low mass central stars.
In disks composed primarily of large planetesimals, our results identify a much slower path to super-Earths. When planetesimals are large, growth is slow. However, the collisional cascade is inefficient. Thus, growing protoplanets can accrete nearly all of the initial solid mass in the disk. On time scales of roughly 1 Gyr, the Mars-mass objects produced during runaway growth evolve into Earth-mass and sometimes super-Earth mass objects.
Comparing these results with published calculations is complicated. Many calculations begin with an ensemble of 1000 km or larger objects and follow the evolution with an -body calculation (e.g., Montgomery & Laughlin, 2009; Ogihara & Ida, 2009; Mann et al., 2010). Others consider the history of a single Earth-mass protoplanet embedded in a sea of low mass planetesimals and a gaseous disk (e.g., Laughlin et al., 2004; Rogers et al., 2011). Although our calculations inform these studies, the very different physical approaches preclude robust comparisons.
Despite the lack of broad comparisons, our results address analytic predictions of the velocity equilibrium between viscous stirring and gas drag, the growth time, and the final masses of protoplanets. Using similar expressions for velocity evolution from gas drag and viscous stirring, the predicted ratio of the equilibrium velocity of small particles to the escape velocity of the large particles is roughly , where depends on the gas drag regime (Rafikov, 2004; Kobayashi et al., 2010). Adopting sets the expected variation of growth time with surface density (eq. [7]), , with (Kenyon & Bromley, 2008, Appendix). The inferred from our calculations agrees reasonably well with the analytic predictions of Rafikov (2004) and Kobayashi et al. (2010).
To compare our results with analytic predictions for protoplanet masses, we focus on derivations consistent with our short gas depletion time. The final mass of a protoplanet which does not accrete fragments produced in a collisional cascade (see eq. 21 of Kobayashi et al., 2010) should be similar to the final masses of protoplanets in our simulations. For 100 km planetesimals at = 4 AU around a 0.3 star, our numerical results for an ensemble of calculations with = 1 (0.3–1 ) is close to their analytic result of 0.7 . Our prediction for the variation in final mass with the initial radius of a planetesimal, , is close to their . Given the different approaches, this agreement is remarkable. For more (less) massive stars, our derived masses of 0.5–2.1 (0.1–0.26 ) are reasonably close to the predictions of 0.84 (0.70 ). We suspect the discrepancy at the lowest masses is a function of evolution time: evolution times exceeding 10 Gyr allow larger final masses in our simulations.
To compare numerical simulations directly, we consider Fig. 8 of Kobayashi et al. (2010), which shows protoplanet masses at 10 Myr for simulations with = 10 km, = 1, and = 3/2 around a solar-mass star. For our simulations, the formation time scales as . Thus, we can make an approximate comparison using our results for = 3 around a 0.5 star. At 10 Myr, Kobayashi et al. (2010) infer masses of roughly 0.04 at 6.5 AU, 0.015 at 9 AU, and 0.003 at 13 AU. In our ensemble of simulations, we derive 0.03–0.07 at 7 AU, 0.01–0.03 at 9 AU, and 0.002–0.004 at 13 AU. The agreement is satisfactory.
5.2 Constraints from Observations
Testing plausible evolutionary paths to super-Earths requires a broad range of observations. Here we outline several approaches which could improve our understanding of planet formation theory.
5.2.1 Initial Disk Masses
Although current data cannot distinguish between the various formation mechanisms for super-Earths, observations allow robust constraints on the initial masses of solid material in protostellar disks. To make this constraint, we compile the expected frequency of Earth-mass or larger planets from our calculations as a function of . For calculations with = 30–300 km, the frequency of Earth-mass planets is independent of . Thus, we derive an average frequency for this range in . To compare with observations, we compile results from microlensing data (e.g., Cassan et al., 2012) and HARPS radial velocity data (Bonfils et al., 2013). Both sets of data rely on observations of low mass stars with = 0.1–0.5 . The microlensing observations are sensitive to 10 and larger planets with 0.5–10 AU. The radial velocity data probe the frequency of Earth-mass and larger planets with 0.25 AU. Together, the two samples cover 10 AU and provide a firm lower limit on the frequency of Earth-mass and larger planets.
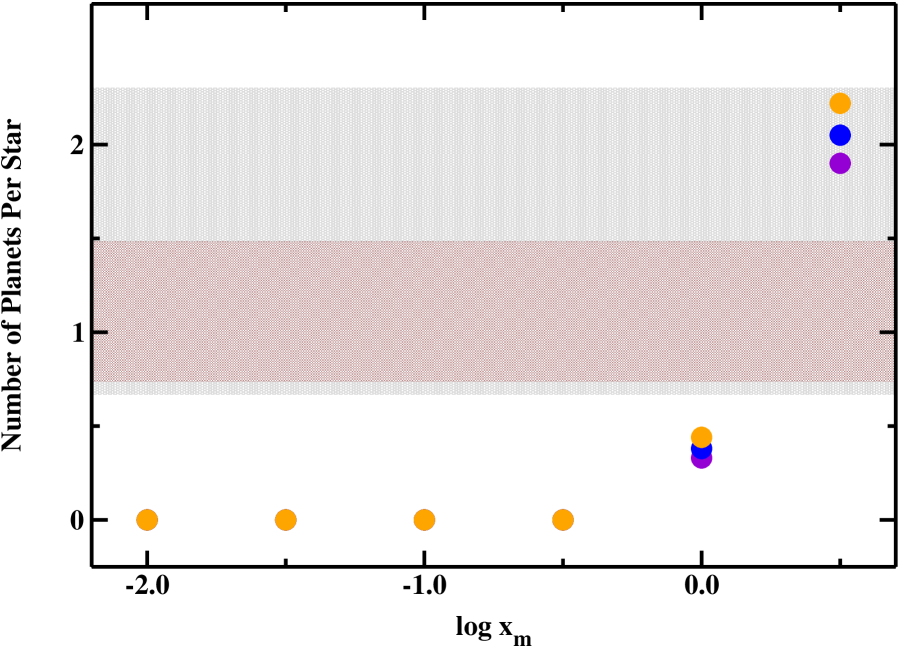
Fig. 16 compares the predicted with observations. Colored symbols indicate results from our simulations for 0.1 (violet), 0.3 (blue), and 0.5 (orange) central stars. Although there is a small increase in planet frequency with stellar mass (see also Kennedy & Kenyon, 2008), there is a marked correlation between planet frequency and initial disk mass. Massive disks with = 1–3 are much more likely to produce Earth-mass and larger planets than disks with 0.3. This correlation has a clear reason: low mass disks with 0.3 do not have enough material to form Earth-mass or larger planets.
Observed frequencies of exoplanets (Fig. 16; shaded regions) suggest most newly-formed low mass stars are surrounded by massive disks with 0.5–1. For microlensing and radial velocity measurements, the 1 ranges imply 1.5 for either set of data. Adopting the 2 range for the microlensing data allows all . However, the 3 range for the radial velocity data – – rules out disks with 0.5. These disk masses are a factor of 5–10 larger than the typical masses inferred for disks around pre-main sequence stars with ages of 1–2 Myr (e.g., Andrews et al., 2013, and references therein).
The simplest way to reconcile the tension between the disk masses required to explain the frequency of super-Earths and those required to explain the mm-wave emission of pre-main sequence stars is to postulate significant growth of solids during the earliest phases of stellar evolution. In this hypothesis, (i) disks are initially massive and (ii) growth of micron- to mm-sized grains concentrates most of the initial mass into m-sized or larger objects in 1–2 Myr. Disk masses derived for pre-main sequence stars then provide an incomplete measure of the total mass in solids available for planet formation.
Improving these constraints on the initial disk mass requires better estimates for the frequency of super-Earths and more extensive radio observations to constrain the fraction of the total disk mass in m-sized or larger objects. Data from Kepler, MEarth, and ongoing microlensing experiments will generate larger populations of super-Earths around M-type stars (e.g., Berta et al., 2012, 2013). ALMA observations can improve our understanding of the total masses of dusty disks surrounding pre-main sequence stars (e.g., Andrews et al., 2013).
5.2.2 Planetesimal Formation
Our calculations also provide a new way to test models of planetesimal formation. In currently popular theories, planetesimals form via coagulation (e.g., Garaud et al., 2013) or some type of dynamical instability (e.g., Johansen et al., 2012). Coagulation tends to concentrate a large fraction of the available solid material into small planetesimals with radii of 0.1–10 km. These outcomes serve as starting points for many of our calculations. Instabilities within the disk collect 0.1–10 cm pebbles into much larger planetesimals with radii of 100 km or larger. In some cases, instabilities may produce only a few very large planetesimals which may then accrete pebbles directly (e.g., Lambrechts & Johansen, 2012, see also Bromley & Kenyon 2011b). Our calculations with large planetesimals address other cases where the instability concentrates most of the solid mass in the disk into very large planetesimals.
Although current samples of planets around low mass stars are insufficient, comprehensive surveys of low mass stars with a broad range of ages enable additional tests. When super-Earths and gas giants form on short time scales, 10–30 Myr, the host star is still contracting to the main sequence. Disks composed only of large planetesimals produce super-Earths on much longer time scales, 1 Gyr, after the star reaches the main sequence. If both paths to super-Earths operate, low mass stars on the main sequence should have a larger fraction of super-Earths than stars approaching the main sequence. Defining as the fraction of low mass pre-main sequence stars with super-Earths and as the fraction of low mass main sequence stars with super-Earths, () then represents the fraction of super-Earths formed at early (late) times in the evolution of the central star.
5.2.3 Atmospheric Properties
Identifying a new formation channel for super-Earths adds another layer of complexity to predictions for the atmospheric structure of super-Earths. In standard models, icy super-Earths form in 1–10 Myr and probably accrete some H-rich gas from the dissipating circumstellar disk (Laughlin et al., 2004; Ida & Lin, 2005; Rogers et al., 2011). Rocky super-Earths form later when the H-rich disk has almost entirely dissipated (Montgomery & Laughlin, 2009; Ogihara & Ida, 2009). In our new formation channel, icy super-Earths form roughly 1 Gyr after the disk has disappeared. Thus, we expect no accreted atmosphere on icy super-Earths formed at late times from large planetesimals.
Despite the lack of accreted atmosphere, icy super-Earths formed at late times may still have significant atmospheres (e.g., Elkins-Tanton & Seager, 2008; Rogers & Seager, 2010; Seager & Deming, 2010; Levi et al., 2013). As one example, degassing during the late stages of accretion can produce a broad range of compositions and total masses for super-Earth atmospheres. Volatiles trapped in ices and brought to the surface by convection can add a variety of molecules to the atmosphere. Predicting the atmospheric structure requires an accurate assessment of the composition of icy planetesimals and a detailed understanding of the accretion history.
6 SUMMARY
We describe coagulation calculations of icy planets around 0.1–0.5 stars. Growth times for planets as a function of disk mass and semimajor axis match analytic theory, where is the exponent in the power-law relation between surface density and semimajor axis. The growth time also depends on the sizes and intrinsic strengths of the planetesimals that collide and merge into planets.
These calculations predict a new formation channel for icy super-Earths orbiting low mass stars. When icy planetesimals are large ( 30–100 km), they grow slowly, on time scales much longer than typical gas depletion times of a few Myr. With modest mass loss due to fragmentation, ensembles of large planetesimals grow into super-Earths on time scales of 1 Gyr, late in the lifetime of a low mass star.
Detailed -body calculations suggest Earth-mass planets migrate through remnant planetesimal disks at rates of 0.01–1 AU Myr-1. Migration rates scale with the disk mass, the mass of the planet, and the semimajor axis of the planet. The calculated rates agree fairly well with those derived from analytic theory.
A simple model combining the results of the coagulation and -body calculations demonstrates that icy Earth-mass planets can migrate from 5–10 AU to 1–2 AU in 1 Gyr. Lower mass planets form earlier and migrate farther than more massive planets. For all Earth-mass planets, migration from 5–10 AU to 1–2 AU probably leads to dynamical interactions between icy super-Earths and rocky planets formed closer to the star. These interactions probably place some planets much closer to their host stars.
The high frequency of Earth-mass exoplanets from microlensing and HARPS radial velocity observations suggest large initial disk masses for 0.1–0.5 stars (Fig. 16). Although the exoplanet frequency derived from microlensing data is somewhat larger, the smaller errors in the frequency derived from the HARPS data provide stronger constraints on initial disk masses. Both sets of data imply disks with 0.5–1.0.
This result has important implications for the structure of protostellar disks around the youngest stars. Observations suggest typical protostellar disks with ages of roughly 1 Myr have median 0.1 and dispersions in of at least an order of magnitude (e.g., Williams & Cieza, 2011; Andrews et al., 2013, and references therein). If the high frequency of super-Earths around low mass stars requires disks with initial masses 1 and most protostellar disks have 0.1, then current observations of protostellar disks significantly underestimate the total mass in solids, implying significant planetesimal growth during the first 1–2 Myr in the life of a young star (e.g., Hartmann et al., 1998; Furlan et al., 2009, and references therein).
Observations can test other aspects of these calculations. If super-Earths can form during the earliest (1–10 Myr) and latest (1 Gyr) stages in the lfetime of a low mass star, stars on the main sequence should have a larger fraction of super-Earths than low mass stars contracting on Hayashi tracks towards the main sequence. Simulations are not yet extensive enough to predict a robust semimajor axis range where older stars should have more super-Earths than younger stars. However, identifying an excess for any range of semimajor axes would provide strong constraints on planet formation theory.
For low mass stars of any age, better estimates on the mass densities of super-Earth and sub-Earth mass planets are important to provide limits on the relative fraction of rocky and icy/watery planets close to their host stars. Our calculations suggest that some planetary systems should contain a mixture of icy and rocky planets. Measuring the frequency of these systems will enable important tests of theory.
We acknowledge generous allotments of computer time on the NASA ‘discover’ cluster, the SI ‘hydra’ cluster, and the ‘cosmos’ cluster at the Jet Propulsion Laboratory. Advice and comments from T. Currie, M. Geller, G. Kennedy, and G. Stewart also greatly improved our presentation. We thank an anonymous referee for a clear and thorough review. Portions of this project were supported by the NASA Astrophysics Theory and Origins of Solar Systems programs through grant NNX10AF35G, the NASA TPF Foundation Science Program through grant NNG06GH25G, the Spitzer Guest Observer Program through grant 20132, and grants from the endowment and scholarly studies programs of the Smithsonian Institution.
References
- Adachi et al. (1976) Adachi, I., Hayashi, C., & Nakazawa, K. 1976, Progress of Theoretical Physics, 56, 1756
- Andrews et al. (2013) Andrews, S. M., Rosenfeld, K. A., Kraus, A. L., & Wilner, D. J. 2013, ArXiv e-prints
- Andrews & Williams (2005) Andrews, S. M., & Williams, J. P. 2005, ApJ, 631, 1134
- Arakawa et al. (2002) Arakawa, M., Leliwa-Kopystynski, J., & Maeno, N. 2002, Icarus, 158, 516
- Backman & Paresce (1993) Backman, D. E., & Paresce, F. 1993, in Protostars and Planets III, ed. E. H. Levy & J. I. Lunine, 1253–1304
- Baraffe et al. (1998) Baraffe, I., Chabrier, G., Allard, F., & Hauschildt, P. H. 1998, A&A, 337, 403
- Beaulieu et al. (2006) Beaulieu, J.-P., et al. 2006, Nature, 439, 437
- Belyaev & Rafikov (2011) Belyaev, M. A., & Rafikov, R. R. 2011, Icarus, 214, 179
- Benz & Asphaug (1999) Benz, W., & Asphaug, E. 1999, Icarus, 142, 5
- Berta et al. (2013) Berta, Z. K., Irwin, J., & Charbonneau, D. 2013, ArXiv e-prints
- Berta et al. (2012) Berta, Z. K., Irwin, J., Charbonneau, D., Burke, C. J., & Falco, E. E. 2012, AJ, 144, 145
- Bonfils et al. (2013) Bonfils, X., et al. 2013, A&A, 549, A109
- Boss (2006) Boss, A. P. 2006, ApJ, 643, 501
- Bromley & Kenyon (2006) Bromley, B. C., & Kenyon, S. J. 2006, AJ, 131, 2737
- Bromley & Kenyon (2011a) —. 2011a, ApJ, 731, 101
- Bromley & Kenyon (2011b) —. 2011b, ApJ, 735, 29
- Bromley & Kenyon (2013) —. 2013, ApJ
- Burchell et al. (2005) Burchell, M. J., Leliwa-Kopystyński, J., & Arakawa, M. 2005, Icarus, 179, 274
- Cassan et al. (2012) Cassan, A., et al. 2012, Nature, 481, 167
- Chambers (2008) Chambers, J. 2008, Icarus, 198, 256
- Chambers (2009) Chambers, J. E. 2009, ApJ, 705, 1206
- Chambers & Wetherill (1998) Chambers, J. E., & Wetherill, G. W. 1998, Icarus, 136, 304
- Chiang & Youdin (2010) Chiang, E., & Youdin, A. N. 2010, Annual Review of Earth and Planetary Sciences, 38, 493
- Currie et al. (2007) Currie, T., Kenyon, S. J., Balog, Z., Bragg, A., & Tokarz, S. 2007, ApJ, 669, L33
- Currie et al. (2009) Currie, T., Lada, C. J., Plavchan, P., Robitaille, T. P., Irwin, J., & Kenyon, S. J. 2009, ApJ, 698, 1
- Currie et al. (2012) Currie, T., et al. 2012, ApJ, 760, L32
- Davis et al. (1985) Davis, D. R., Chapman, C. R., Weidenschilling, S. J., & Greenberg, R. 1985, Icarus, 63, 30
- Dohnanyi (1969) Dohnanyi, J. S. 1969, J. Geophys. Res., 74, 2531
- Dominik & Decin (2003) Dominik, C., & Decin, G. 2003, ApJ, 598, 626
- Dressing & Charbonneau (2013) Dressing, C. D., & Charbonneau, D. 2013, ApJ, 767, 95
- Eiroa et al. (2013) Eiroa, C., et al. 2013, A&A, 555, A11
- Elkins-Tanton & Seager (2008) Elkins-Tanton, L. T., & Seager, S. 2008, ApJ, 685, 1237
- Forveille et al. (2009) Forveille, T., et al. 2009, A&A, 493, 645
- Fressin et al. (2013) Fressin, F., et al. 2013, ApJ, 766, 81
- Furlan et al. (2009) Furlan, E., et al. 2009, ApJ, 703, 1964
- Garaud et al. (2013) Garaud, P., Meru, F., Galvagni, M., & Olczak, C. 2013, ApJ, 764, 146
- Giblin et al. (2004) Giblin, I., Davis, D. R., & Ryan, E. V. 2004, Icarus, 171, 487
- Goldreich et al. (2004) Goldreich, P., Lithwick, Y., & Sari, R. 2004, ARA&A, 42, 549
- Goldreich & Tremaine (1982) Goldreich, P., & Tremaine, S. 1982, ARA&A, 20, 249
- Gould et al. (2010) Gould, A., et al. 2010, ApJ, 720, 1073
- Haghighipour (2011) Haghighipour, N. 2011, Contemporary Physics, 52, 403
- Haghighipour (2013) —. 2013, Annual Review of Earth and Planetary Sciences, 41, 469
- Hartmann et al. (1998) Hartmann, L., Calvet, N., Gullbring, E., & D’Alessio, P. 1998, ApJ, 495, 385
- Hayashi (1981) Hayashi, C. 1981, Progress of Theoretical Physics Supplement, 70, 35
- Holsapple (1994) Holsapple, K. A. 1994, Planet. Space Sci., 42, 1067
- Housen & Holsapple (1999) Housen, K. R., & Holsapple, K. A. 1999, Icarus, 142, 21
- Ida et al. (2000) Ida, S., Bryden, G., Lin, D. N. C., & Tanaka, H. 2000, ApJ, 534, 428
- Ida & Lin (2005) Ida, S., & Lin, D. N. C. 2005, ApJ, 626, 1045
- Ida & Lin (2008) —. 2008, ApJ, 673, 487
- Ida & Lin (2010) —. 2010, ApJ, 719, 810
- Inaba & Ikoma (2003) Inaba, S., & Ikoma, M. 2003, A&A, 410, 711
- Inaba et al. (2003) Inaba, S., Wetherill, G. W., & Ikoma, M. 2003, Icarus, 166, 46
- Johansen et al. (2012) Johansen, A., Youdin, A. N., & Lithwick, Y. 2012, A&A, 537, A125
- Jurić & Tremaine (2008) Jurić, M., & Tremaine, S. 2008, ApJ, 686, 603
- Kary et al. (1993) Kary, D. M., Lissauer, J. J., & Greenzweig, Y. 1993, Icarus, 106, 288
- Kennedy & Kenyon (2008) Kennedy, G. M., & Kenyon, S. J. 2008, ApJ, 673, 502
- Kennedy & Kenyon (2009) —. 2009, ApJ, 695, 1210
- Kenyon & Bromley (2001) Kenyon, S. J., & Bromley, B. C. 2001, AJ, 121, 538
- Kenyon & Bromley (2002a) —. 2002a, AJ, 123, 1757
- Kenyon & Bromley (2002b) —. 2002b, ApJ, 577, L35
- Kenyon & Bromley (2004a) —. 2004a, AJ, 127, 513
- Kenyon & Bromley (2004b) —. 2004b, ApJ, 602, L133
- Kenyon & Bromley (2006) —. 2006, AJ, 131, 1837
- Kenyon & Bromley (2008) —. 2008, ApJS, 179, 451
- Kenyon & Bromley (2009) —. 2009, ApJ, 690, L140
- Kenyon & Bromley (2010) —. 2010, ApJS, 188, 242
- Kenyon & Bromley (2012) —. 2012, AJ, 143, 63
- Kenyon & Hartmann (1987) Kenyon, S. J., & Hartmann, L. 1987, ApJ, 323, 714
- Kenyon & Hartmann (1995) —. 1995, ApJS, 101, 117
- Kenyon & Luu (1998) Kenyon, S. J., & Luu, J. X. 1998, AJ, 115, 2136
- Kenyon & Luu (1999) —. 1999, AJ, 118, 1101
- Kirsh et al. (2009) Kirsh, D. R., Duncan, M., Brasser, R., & Levison, H. F. 2009, Icarus, 199, 197
- Kobayashi et al. (2012) Kobayashi, H., Ormel, C. W., & Ida, S. 2012, ApJ, 756, 70
- Kobayashi & Tanaka (2010) Kobayashi, H., & Tanaka, H. 2010, Icarus, 206, 735
- Kobayashi et al. (2011) Kobayashi, H., Tanaka, H., & Krivov, A. V. 2011, ApJ, 738, 35
- Kobayashi et al. (2010) Kobayashi, H., Tanaka, H., Krivov, A. V., & Inaba, S. 2010, Icarus, 209, 836
- Kokubo & Ida (1998) Kokubo, E., & Ida, S. 1998, Icarus, 131, 171
- Kokubo & Ida (2000) —. 2000, Icarus, 143, 15
- Kopparapu (2013) Kopparapu, R. K. 2013, ApJ, 767, L8
- Lambrechts & Johansen (2012) Lambrechts, M., & Johansen, A. 2012, A&A, 544, A32
- Laughlin et al. (2004) Laughlin, G., Bodenheimer, P., & Adams, F. C. 2004, ApJ, 612, L73
- Leinhardt & Stewart (2009) Leinhardt, Z. M., & Stewart, S. T. 2009, Icarus, 199, 542
- Leinhardt et al. (2008) Leinhardt, Z. M., Stewart, S. T., & Schultz, P. H. 2008, in The Solar System Beyond Neptune, ed. Barucci, M. A., Boehnhardt, H., Cruikshank, D. P., & Morbidelli, A. (University of Arizona Press, Tucson, AZ), 195–211
- Lestrade et al. (2012) Lestrade, J.-F., et al. 2012, A&A, 548, A86
- Levi et al. (2013) Levi, A., Sasselov, D., & Podolak, M. 2013, ApJ, 769, 29
- Lin & Papaloizou (1986) Lin, D. N. C., & Papaloizou, J. 1986, ApJ, 309, 846
- Lissauer (1987) Lissauer, J. J. 1987, Icarus, 69, 249
- Lissauer et al. (2009) Lissauer, J. J., Hubickyj, O., D’Angelo, G., & Bodenheimer, P. 2009, Icarus, 199, 338
- Love & Ahrens (1996) Love, S. G., & Ahrens, T. J. 1996, Icarus, 124, 141
- Luhman (2012) Luhman, K. L. 2012, ArXiv e-prints
- Mamajek (2009) Mamajek, E. E. 2009, in American Institute of Physics Conference Series, Vol. 1158, American Institute of Physics Conference Series, ed. T. Usuda, M. Tamura, & M. Ishii, 3–10
- Mann et al. (2010) Mann, A. W., Gaidos, E., & Gaudi, B. S. 2010, ApJ, 719, 1454
- Masset & Papaloizou (2003) Masset, F. S., & Papaloizou, J. C. B. 2003, ApJ, 588, 494
- Matthews et al. (2010) Matthews, B. C., et al. 2010, A&A, 518, L135
- Montgomery & Laughlin (2009) Montgomery, R., & Laughlin, G. 2009, Icarus, 202, 1
- Mordasini et al. (2009) Mordasini, C., Alibert, Y., Benz, W., & Naef, D. 2009, A&A, 501, 1161
- Nagasawa & Ida (2011) Nagasawa, M., & Ida, S. 2011, ApJ, 742, 72
- Nayakshin (2010) Nayakshin, S. 2010, MNRAS, 408, L36
- O’Brien & Greenberg (2003) O’Brien, D. P., & Greenberg, R. 2003, Icarus, 164, 334
- Ogihara & Ida (2009) Ogihara, M., & Ida, S. 2009, ApJ, 699, 824
- Ohtsuki (1992) Ohtsuki, K. 1992, Icarus, 98, 20
- Ohtsuki et al. (2002) Ohtsuki, K., Stewart, G. R., & Ida, S. 2002, Icarus, 155, 436
- Ormel et al. (2010a) Ormel, C. W., Dullemond, C. P., & Spaans, M. 2010a, ApJ, 714, L103
- Ormel et al. (2010b) —. 2010b, Icarus, 210, 507
- Ormel et al. (2012) Ormel, C. W., Ida, S., & Tanaka, H. 2012, ApJ, 758, 80
- Ormel & Klahr (2010) Ormel, C. W., & Klahr, H. H. 2010, A&A, 520, A43
- Paardekooper et al. (2010) Paardekooper, S.-J., Baruteau, C., Crida, A., & Kley, W. 2010, MNRAS, 401, 1950
- Petigura et al. (2013) Petigura, E. A., Marcy, G. W., & Howard, A. W. 2013, ArXiv e-prints
- Podolak et al. (1988) Podolak, M., Pollack, J. B., & Reynolds, R. T. 1988, Icarus, 73, 163
- Pollack et al. (1996) Pollack, J. B., Hubickyj, O., Bodenheimer, P., Lissauer, J. J., Podolak, M., & Greenzweig, Y. 1996, Icarus, 124, 62
- Rafikov (2001) Rafikov, R. R. 2001, AJ, 122, 2713
- Rafikov (2004) —. 2004, AJ, 128, 1348
- Rasio & Ford (1996) Rasio, F. A., & Ford, E. B. 1996, Science, 274, 954
- Raymond et al. (2004) Raymond, S. N., Quinn, T., & Lunine, J. I. 2004, Icarus, 168, 1
- Raymond et al. (2011) Raymond, S. N., et al. 2011, ArXiv e-prints
- Rieke et al. (2005) Rieke, G. H., et al. 2005, ApJ, 620, 1010
- Rivera et al. (2005) Rivera, E. J., et al. 2005, ApJ, 634, 625
- Rogers et al. (2011) Rogers, L. A., Bodenheimer, P., Lissauer, J. J., & Seager, S. 2011, ApJ, 738, 59
- Rogers & Seager (2010) Rogers, L. A., & Seager, S. 2010, ApJ, 716, 1208
- Ryan et al. (1999) Ryan, E. V., Davis, D. R., & Giblin, I. 1999, Icarus, 142, 56
- Safronov (1969) Safronov, V. S. 1969, Evoliutsiia doplanetnogo oblaka. (Evolution of the Protoplanetary Cloud and Formation of the Earth and Planets, Nauka, Moscow [Translation 1972, NASA TT F-677] (1969.)
- Scholz et al. (2006) Scholz, A., Jayawardhana, R., & Wood, K. 2006, ApJ, 645, 1498
- Seager & Deming (2010) Seager, S., & Deming, D. 2010, ARA&A, 48, 631
- Stern & Colwell (1997) Stern, S. A., & Colwell, J. E. 1997, AJ, 114, 841
- Stewart & Ida (2000) Stewart, G. R., & Ida, S. 2000, Icarus, 143, 28
- Syer & Clarke (1995) Syer, D., & Clarke, C. J. 1995, MNRAS, 277, 758
- Tanaka et al. (1996) Tanaka, H., Inaba, S., & Nakazawa, K. 1996, Icarus, 123, 450
- Trilling et al. (2008) Trilling, D. E., et al. 2008, ApJ, 674, 1086
- Ward (1997) Ward, W. R. 1997, Icarus, 126, 261
- Weidenschilling (1977a) Weidenschilling, S. J. 1977a, MNRAS, 180, 57
- Weidenschilling (1977b) —. 1977b, Ap&SS, 51, 153
- Weidenschilling (1989) —. 1989, Icarus, 80, 179
- Wetherill (1990) Wetherill, G. W. 1990, Icarus, 88, 336
- Wetherill & Stewart (1989) Wetherill, G. W., & Stewart, G. R. 1989, Icarus, 77, 330
- Wetherill & Stewart (1993) —. 1993, Icarus, 106, 190
- Williams & Wetherill (1994) Williams, D. R., & Wetherill, G. W. 1994, Icarus, 107, 117
- Williams & Cieza (2011) Williams, J. P., & Cieza, L. A. 2011, ArXiv e-prints
- Wyatt & Dent (2002) Wyatt, M. C., & Dent, W. R. F. 2002, MNRAS, 334, 589
- Youdin (2011) Youdin, A. N. 2011, ApJ, 742, 38
- Youdin & Kenyon (2012) Youdin, A. N., & Kenyon, S. J. 2012, ArXiv e-prints
| Stellar Mass in | |||
|---|---|---|---|
| 0.1 | 0.3 | 0.5 | |
| 0.01 | 0.07 | 0.34 | 0.98 |
| 0.03 | 0.23 | 1.12 | 3.26 |
| 0.10 | 0.70 | 3.35 | 9.79 |
| 0.33 | 2.33 | 11.17 | 32.64 |
| 1.00 | 7.00 | 33.51 | 97.92 |
| 0.01 | 0.01 | 0.05 | 0.11 |
| 0.03 | 0.04 | 0.17 | 0.38 |
| 0.10 | 0.14 | 0.52 | 1.15 |
| 0.33 | 0.46 | 1.73 | 3.82 |
| 1.00 | 1.37 | 5.20 | 11.47 |
| 3.00 | 4.12 | 15.59 | 34.41 |
| Disk Mass () | |||||||||
|---|---|---|---|---|---|---|---|---|---|
| (km) | 0.01 | 0.03 | 0.10 | 0.33 | 1.00 | 3.00 | |||
| 0.1 | 1.0 | 1.0 | 2.91 | 3.02 | 3.15 | 3.28 | 3.40 | KB2008 | |
| 0.3 | 1.0 | 1.0 | 3.02 | 3.15 | 3.27 | 3.43 | 3.58 | KB2008 | |
| 0.5 | 1.0 | 1.0 | 3.10 | 3.25 | 3.39 | 3.51 | 3.65 | KB2008 | |
| 0.5 | 1.5 | 1.0 | 2.97 | 3.08 | 3.19 | 3.35 | 3.47 | 3.61 | KB2008 |
| 0.1 | 1.0 | 1.0 | 2.75 | 2.89 | 3.01 | 3.12 | 3.25 | LS2009 | |
| 0.3 | 1.0 | 1.0 | 2.91 | 3.01 | 3.12 | 3.25 | 3.39 | LS2009 | |
| 0.5 | 1.0 | 1.0 | 2.95 | 3.09 | 3.17 | 3.38 | 3.49 | LS2009 | |
| 0.5 | 1.5 | 1.0 | 2.84 | 2.95 | 3.09 | 3.21 | 3.29 | 3.41 | LS2009 |
| (km) | |||||||||
|---|---|---|---|---|---|---|---|---|---|
| () | 1 | 3 | 10 | 30 | 100 | 300 | 1000 | ||
| 0.1 | 0.01 | 2.85 | 2.90 | 2.85 | 2.80 | 2.90 | 2.60 | LS2009 | |
| 0.03 | 3.00 | 3.05 | 3.10 | 3.05 | 3.00 | 2.80 | LS2009 | ||
| 0.10 | 3.10 | 3.10 | 3.20 | 3.30 | 3.25 | 2.95 | 3.15 | LS2009 | |
| 0.33 | 3.25 | 3.30 | 3.40 | 3.55 | 3.65 | 3.40 | 3.50 | LS2009 | |
| 1.00 | 3.40 | 3.45 | 3.60 | 3.80 | 3.80 | 3.90 | 4.05 | LS2009 | |
| 3.00 | 3.50 | 3.60 | 3.85 | 4.00 | 4.10 | 4.10 | 4.15 | LS2009 | |
| 0.3 | 0.01 | 2.95 | 3.00 | 3.00 | 2.95 | 2.96 | 3.10 | LS2009 | |
| 0.03 | 3.10 | 3.15 | 3.20 | 3.20 | 3.20 | 3.20 | 3.05 | LS2009 | |
| 0.10 | 3.25 | 3.30 | 3.35 | 3.40 | 3.45 | 3.40 | 3.10 | LS2009 | |
| 0.33 | 3.38 | 3.45 | 3.57 | 3.65 | 3.75 | 3.70 | 3.20 | LS2009 | |
| 1.00 | 3.51 | 3.60 | 3.70 | 3.85 | 4.00 | 4.10 | 4.10 | LS2009 | |
| 3.00 | 3.64 | 3.75 | 3.86 | 4.23 | 4.13 | 4.20 | 4.20 | LS2009 | |
| 0.5 | 0.01 | 3.10 | 3.08 | 3.11 | 3.04 | 2.97 | 2.60 | LS2009 | |
| 0.03 | 3.20 | 3.25 | 3.31 | 3.28 | 3.29 | 2.75 | 3.18 | LS2009 | |
| 0.10 | 3.30 | 3.39 | 3.45 | 3.50 | 3.52 | 3.06 | 3.27 | LS2009 | |
| 0.33 | 3.46 | 3.55 | 3.62 | 3.75 | 3.80 | 3.40 | 3.40 | LS2009 | |
| 1.00 | 3.60 | 3.72 | 3.80 | 3.95 | 4.10 | 4.00 | 4.05 | LS2009 | |
| 3.00 | 3.80 | 3.90 | 4.01 | 4.10 | 4.30 | 4.25 | 4.30 | LS2009 | |
| (Myr) | (Myr) | |||
|---|---|---|---|---|
| 0.1 | 1.0 | 3.0 | 15 | KB2008 |
| 0.3 | 1.0 | 0.8 | 2 | KB2008 |
| 0.5 | 1.0 | 0.3 | 1 | KB2008 |
| 0.5 | 1.5 | 1.0 | 3 | KB2008 |
| 0.1 | 1.0 | 3.0 | 50 | LS2009 |
| 0.3 | 1.0 | 0.8 | 10 | LS2009 |
| 0.5 | 1.0 | 0.3 | 2 | LS2009 |
| 0.5 | 1.5 | 1.0 | 15 | LS2009 |
| (Myr) | (Myr) | (Myr) | ||||
|---|---|---|---|---|---|---|
| 0.1 | 1.5 | 1.0 | 30 | 70 | 30000 | LS2009 |
| 0.1 | 1.5 | 3.0 | 60 | 100 | 15000 | LS2009 |
| 0.1 | 1.5 | 10.0 | 100 | 250 | 12500 | LS2009 |
| 0.1 | 1.5 | 30.0 | 250 | 800 | 11000 | LS2009 |
| 0.1 | 1.5 | 100.0 | 150 | 1000 | 11000 | LS2009 |
| 0.1 | 1.5 | 300.0 | 1500 | 12000 | LS2009 | |
| 0.1 | 1.5 | 1000.0 | 11000 | LS2009 | ||
| 0.3 | 1.5 | 1.0 | 7 | 20 | 10000 | LS2009 |
| 0.3 | 1.5 | 3.0 | 10 | 25 | 275 | LS2009 |
| 0.3 | 1.5 | 10.0 | 20 | 50 | 200 | LS2009 |
| 0.3 | 1.5 | 30.0 | 50 | 170 | 300 | LS2009 |
| 0.3 | 1.5 | 100.0 | 30 | 200 | 2500 | LS2009 |
| 0.3 | 1.5 | 300.0 | 250 | 8000 | LS2009 | |
| 0.3 | 1.5 | 1000.0 | 12500 | LS2009 | ||
| 0.5 | 1.5 | 1.0 | 3 | 10 | 500 | LS2009 |
| 0.5 | 1.5 | 3.0 | 5 | 10 | 30 | LS2009 |
| 0.5 | 1.5 | 10.0 | 10 | 15 | 30 | LS2009 |
| 0.5 | 1.5 | 30.0 | 15 | 30 | 70 | LS2009 |
| 0.5 | 1.5 | 100.0 | 20 | 100 | 400 | LS2009 |
| 0.5 | 1.5 | 300.0 | 200 | 7000 | LS2009 | |
| 0.5 | 1.5 | 1000.0 | 8000 | LS2009 |