LAT and observations of the supernova remnant HB 21
Abstract
We present the analysis of Fermi Large Area Telescope (LAT) -ray observations of HB 21 (G89.0+4.7). We detect significant -ray emission associated with the remnant: the flux MeV is erg cm-2 s-1. HB 21 is well modeled by a uniform disk centered at = 8875 004, = +465 006 with a radius of 119 006. The -ray spectrum shows clear evidence of curvature, suggesting a cutoff or break in the underlying particle population at an energy of a few GeV. We complement -ray observations with the analysis of the WMAP 7-year data from 23 to 93 GHz, achieving the first detection of HB 21 at these frequencies. In combination with archival radio data, the radio spectrum shows a spectral break which helps to constrain the relativistic electron spectrum, hence parameters of simple non-thermal radiation models. In one-zone models multiwavelength data favor the origin of rays from nucleon-nucleon collisions. A single population of electrons cannot produce both rays through bremsstrahlung and radio emission through synchrotron radiation. A predominantly inverse-Compton origin of the -ray emission is disfavored because it requires lower interstellar densities than are inferred for HB 21. In the hadronic-dominated scenarios accelerated nuclei contribute a total energy of ergs, while in a two-zone bremsstrahlung-dominated scenario the total energy in accelerated particles is 1 ergs.
1 Introduction
Diffusive shock acceleration in supernova remnants (SNRs) is strongly advocated as the mechanism responsible for the acceleration of Galactic cosmic rays (CRs, e.g. Drury 2012). High-energy emission from SNRs is a powerful probe of this process (Reynolds, 2008). In particular, high-energy -ray emission can pinpoint the presence of energetic leptons or ions, constraining the acceleration efficiency and the maximum energy of accelerated particles (e.g. Aharonian et al., 2007; Abdo et al., 2011; Acciari et al., 2011; Giordano et al., 2012).
SNRs interacting with dense molecular clouds are expected to be bright -ray sources (e.g., Hewitt et al., 2009). Archetypal remnants of this class are IC 443 and W44, for which GeV- and, for the former, TeV-energy -ray emission are observed and interpreted as the signature of collisions between accelerated nuclei and interstellar matter (Abdo et al., 2010d; Albert et al., 2007; Abdo et al., 2010c), as recently confirmed by the detection of the characteristic spectral feature of -rays produced from the decay of neutral pions (Giuliani et al., 2011; Ackermann et al., 2013a).
Both sources belong to a class of objects known as mixed-morphology (MM) SNRs, where an outer shell revealed by non-thermal radio emission surrounds a central region filled by thermal gas emitting in X-rays (Rho & Petre, 1998). There is a strong association between MM SNRs and evidence for interactions between shock fronts and dense clouds revealed by OH masers (Yusef-Zadeh et al., 2003). Therefore, MM SNRs are good candidates to be bright -ray sources. Indeed, in addition to W44 and IC 443, other members of this class are known to be GeV -ray emitters: W28 (Abdo et al., 2010a), W49B (Abdo et al., 2010b), W51C (Abdo et al., 2009a) and 3C 391 (Castro & Slane, 2010).
HB 21 (also known as G89.0+4.7, Green 2009) is a MM SNR interacting with molecular clouds. Evidence for interaction comes from several different wavelengths. X-ray observations with Einstein provide evidence that the SN explosion took place in a low-density cavity, therefore suggesting a massive stellar progenitor (Knoedlseder et al., 1996). HB 21 has a radio shape with bright filaments and indentations suggesting interactions with the nearby clouds (Byun et al., 2006). Looking at the CO distribution it is possible to distinguish two different structures based on the velocity of the molecular clouds. Koo & Heiles (1991) report the presence of broad CO lines emitted from shocked clumps of molecular gas with high column densities. Infrared line observations (Shinn et al., 2009) reveal an infrared spectrum from H2 gas with a mixture of temperatures, indicating shocks into a multi-phase medium, typical of molecular clouds.
The distance to HB 21 was first estimated to be kpc on the basis of an association with the Cygnus OB7 complex and ROSAT observations of X-ray absorption (Leahy & Aschenbach, 1996). Considering the preshock velocities, the X-ray absorbing column density, the and CO distribution along the line of sight and the highly polarized emission, the distance was later determined to be 1.7 kpc (Byun et al., 2006). In this work we adopt the later, revised distance.
The age of the SNR is also uncertain. Lazendic & Slane (2006) determine an age of 5600 years by fitting evolutionary models to the thermal X-ray spectrum of the SNR. However, this results from assuming that the SNR is located at 0.8 kpc, and still in the adiabatic phase. Kinematics of the shell velocity of 124 km s-1 indicates a much older age for the remnant of yr (Koo & Heiles, 1991). Additionally, H2 spectra indicate steady-state continuous shocks, which require 104 yr to develop (Flower & Pineau des Forêts, 1999). In at least some regions optical filaments are observed with line ratios typical of velocities 150 km s-1, indicating that the shock has evolved into the radiative phase (Mavromatakis et al., 2007). A SNR shock propagating into a uniform medium of 1 cm-3 becomes radiative at an age of yr (Mavromatakis et al., 2007). Given this evidence, we argue that HB 21 is a middle-aged SNR, at an age of a few tens of thousands of years, similar to other SNRs interacting with molecular clouds detected by Fermi Large Area Telescope (LAT).
High-energy -ray sources coincident with HB 21 were reported in the 2-year Catalog of the LAT on board the Fermi Gamma-ray Space Telescope (Nolan et al., 2012). Three sources are associated with the remnant (2FGL J2043.3+5105, J2046.0+4954, and J2041.5+5003) and an additional source is present on the edge (2FGL J2051.8+5054): we will investigate if it is part of the emission of the remnant or it is a source itself. Reichardt et al. (2012) recently reported an analysis of 3.5 years of Fermi LAT data towards HB 21, finding evidence for extended emission and claiming a softer spectrum in the direction of a shocked cloud in the north-western region of the remnant.
Due to the large apparent size (2∘) this object is well suited for a detailed morphological study using Fermi LAT data. Therefore, it is ideal to further assess the correlation between cloud-interacting shocks and -ray emission as a tracer of particle acceleration in MM SNRs, as well as to investigate the possible spectral variations that could shed light on the poorly known processes of particle escape from the shocks (e.g. Gabici et al., 2009).
In this paper we present the analysis of years of LAT observations of HB 21 and we discuss the -ray emission mechanism in light of a new analysis of WMAP 7-years data, as well as of archival radio data. In §2 we describe the -ray observations and the morphological and spectral characterization of the -ray emission from HB 21. In §3 we present the analysis of the WMAP and archival radio data, which reveals a break in the high-frequency radio spectrum. In §4 the interpretation of these results is discussed.
2 Gamma-ray analysis
2.1 Observations
The Fermi LAT is a pair-conversion -ray telescope detecting photons from 20 MeV to GeV (Atwood et al., 2009). Its on-orbit calibration is described in Abdo et al. (2009b) and Ackermann et al. (2012b) along with the event classification and instrument performance.
For this analysis, data are accumulated from the beginning of scientific operations on 2008 August 4 to 2012 June 14, selecting the low-background P7SOURCE event class. The data analysis was performed using the LAT Science Tools package (v9r27p1), available from the Fermi Science Support Center111http://fermi.gsfc.nasa.gov/ssc. For the morphological characterization we use only events with energy 1 GeV to profit from the narrower point-spread function (PSF) in order to separate the -ray emission associated with HB 21 from neighboring sources and interstellar emission. We then use events down to MeV to determine the spectral energy distribution of the remnant. Below this energy the PSF becomes much broader than the SNR and the uncertainties related to the instrument response are larger. In both the morphological and spectral characterization we consider photons with measured energies up to GeV, but only find a significant detection of the source up to energies of several GeV due to the limited number of events at high energies.
We perform the analysis in a 10∘10∘ region of interest (RoI) centered at the radio position of HB 21 ( = 890, = +47). The RoI approximately corresponds to the 68% event containment region for the P7SOURCE events at 100 MeV and exceeds the 95% event containment region for energies MeV. We adopted this narrower than usual RoI in order to limit at the lowest energies the large uncertainties due to the modeling of the bright interstellar emission from the nearby Cygnus region (Ackermann et al., 2011, 2012c). We also exclude a few time intervals when the LAT boresight was rocked with respect to the local zenith by more than 52∘ (mostly for calibration purposes or to point at specific sources) and events with a reconstructed angle with respect to the local zenith 100∘ in order to limit the contribution from the Earth’s atmospheric -ray emission. To take into account the latter selection criterion in the calculation of the exposure, we exclude time intervals when any part of the RoI was observed at zenith angles 100∘.
2.2 Background model and analysis method
The background is composed of diffuse emission and individual nearby -ray sources. Diffuse emission is taken into account using the standard models provided by the Fermi LAT collaboration222http://fermi.gsfc.nasa.gov/ssc/data/access/lat/BackgroundModels.html for the P7SOURCE selection (see Nolan et al., 2012). They include a model that accounts for the Galactic interstellar emission from CR interactions with interstellar gas and low-energy radiation fields, and an isotropic background spectrum that accounts for diffuse -ray emission of extragalactic origin and residual background events due to charged particle interactions in the LAT misclassified as -rays. We leave the normalization of the Galactic interstellar model as a free parameter, yet fix the isotropic background spectrum because it is difficult to separate it from the other components in such a small RoI and it is more reliably determined over larger regions of the sky.
We include in the background model all the point sources present in the 2FGL catalog (Nolan et al., 2012) with distances less than 15∘ from the RoI center and which are not associated with the SNR. We will discuss in §2.4 the case of the source 2FGL J2051.8+5054, which is located at the edge of the SNR. The spectral models used for background sources are those reported in the 2FGL catalog. Fluxes and spectral indices are left as free parameters in the fit if the source is within the RoI. Otherwise they are fixed to the catalog values.
The background model and the various models for HB 21 are fitted to the LAT data using a binned maximum-likelihood method based on Poisson statistics (e.g. Mattox et al., 1996), as implemented in the gtlike tool. For this purpose data were binned on an angular grid with 01 spacing, and different binning in energy as detailed below. The analysis uses the post-launch instrument response functions (IRFs) P7SOURCEV6 (Ackermann et al., 2012b).
Finally, we note that the radio pulsar J2047+5029 is 05 away from the remnant’s radio center (Janssen et al., 2009). While pulsars represent the largest Galactic -ray source class, this particular pulsar likely contributes no detectable flux to the ROI. The spindown power is erg s-1, lower than that of any known -ray pulsar, and three times lower than for any young, radio-loud -ray pulsar (Abdo et al., 2013). That is, the pulsar is probably below the “deathline” expected from the outer magnetospheric emission models that best describe the LAT pulsars (Wang & Hirotani, 2011). Furthermore, the pulsar’s dispersion measure indicates a distance kpc. The ratio erg1/2 kpc-2 (a proxy of the expected -ray luminosity) is five times lower than for any known -ray pulsar (see Fig. 15 in Abdo et al., 2013). The two-year LAT catalog shows no point source at the pulsar position (Nolan et al., 2012), nor does the 4-year catalog currently in preparation. Nevertheless, we searched PSR J2047+5029 for -ray pulsations. It is not part of Fermi’s pulsar timing campaign (Smith et al., 2008), so we obtained a timing solution based on Westerbork Synthesis Radio Telescope (SRT) and Jodrell Bank radio data taken concurrently with the Fermi data333Janssen, and Stappers private communication. The ephemeris will be presented in future work (Janssen et al. 2013). We used it to phase-fold the LAT data, over a grid of minimum energy cuts (100 MeV to 1000 MeV, in 50 MeV steps) and maximum radius cuts (from to from the pulsar position, in steps). For pulsars with unknown -ray spectral shapes and unknown pulse profile shapes, such grids amount to a search for the maximum pulsar signal-to-background noise ratio. At each grid location, we calculated the H-test, which never exceeded statistical significance (see Section 5 in Abdo et al., 2013). The pulsar’s energy flux above 100 MeV is therefore lower than for any known -ray pulsar, that is, below erg cm-2 s-1. We conclude that the pulsar can be neglected when characterizing -ray emission from HB 21.
2.3 Systematic uncertainties
Two major sources of systematic errors on the results are the uncertainties in the LAT effective area and the modeling of interstellar emission. The uncertainties in the effective area for the IRFs we use are evaluated as at MeV, at MeV, and above GeV, linearly varying with the logarithm of energy between those values (Ackermann et al., 2012b). We estimate the error induced in the characterization of the -ray fluxes of HB 21 by repeating the analysis with two sets of modified IRFs where the effective area was upscaled or downscaled by its uncertainty. This approach neglects errors induced by possibly more complicated variations of the effective area and, therefore, does not capture uncertainties in the spectral shape of the source. However, this is sufficient for our purpose since, as discussed in section 2.5, for HB 21 systematic uncertainties are dominated by the modeling of interstellar emission.
To gauge the systematic uncertainties due to the interstellar emission model we compare the results obtained using the standard model in §2.2 with the results based on eight alternative interstellar emission models. The alternative emission models are based on a subsample of those examined by Ackermann et al. (2012a). We varied some of the most important parameters of the interstellar emission models, namely the uniform spin temperature used to estimate the column densities of interstellar atomic hydrogen ( K and K, the latter being equivalent to the small optical depth approximation), the vertical height of the CR propagation halo ( kpc and kpc), the CR source distribution in the Galaxy (the pulsar distribution by Lorimer et al. 2006 and the SNR distribution by Case & Bhattacharya 1998444The validity of the Case & Bhattacharya (1998) relation has been criticised: it is used in Ackermann et al. (2012a) as an alternative to probe the effect of changing the CR distribution.). In this way we built a grid of eight alternative interstellar emission models. We refer the reader to Ackermann et al. (2012a) for further details about the modeling strategy and multimessenger/multiwavelength constraints on these parameters.
Each of these models was fitted to the whole-sky P7SOURCE data in the energy range between MeV and GeV using the maximum likelihood method described in Ackermann et al. (2012a). We determine independent log-parabolic re-normalization functions separately for the Inverse Compton (IC) component and the components associated to atomic hydrogen and molecular hydrogen (traced by CO), split along the line of sight into four broad Galactocentric annuli between 0–4 kpc, 4–8 kpc, 8–10 kpc (the local annulus) and 10–30 kpc.
The eight resulting models were used to repeat the source analysis described in §2.4, for the determination of the disk dimension, and §2.5 for the spectral analysis of the source. In each of the iterations we replaced the standard isotropic background and Galactic interstellar emission models with the alternative isotropic background spectra and Galactic interstellar emission templates, independently for the sub-components described above (note that for the line of sight of HB 21 only the two outermost Galactocentric annuli are relevant). For the same reasons as for the standard model, we fix the isotropic background spectrum. We leave free the normalization parameters of the interstellar model components in the third and fourth ring, and of the IC component. Through this procedure we explored the impact of adopting a different model-construction strategy, of varying the model parameters and of allowing more freedom in the fit. We stress that we explored only some of the uncertainties related to the modeling of interstellar emission, but we are nevertheless able to obtain an indication about some important systematic effects. A more thorough discussion on this method for exploring the systematic uncertainties due to the modeling of diffuse emission is available in de Palma et al. (2013).
2.4 Morphological analysis
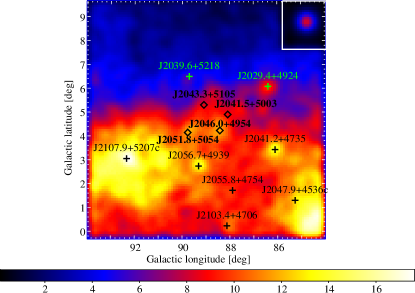
In Figure 1a we show a count map of the RoI for energies 1 GeV, to visually illustrate the morphology of the -ray emission in the region. We consider different spatial models for the emission from HB 21, summarized in Table 1. For each model we evaluate the test statistic
| (1) |
where is the maximum-likelihood value for the model including the remnant and is the maximum-likelihood value for the model not including it (null hypothesis). If the null hypothesis is verified (no -ray emission associated to HB 21), is expected to be distributed as a with a number of degrees of freedom given by the additional number of free parameters in the model including the source, with the caveats discussed in Protassov et al. (2002).
|
|
|
We determine the position and extension of the -ray emission associated with HB 21 from -ray data only using the pointlike tool, which is optimized and widely validated against Monte Carlo simulations for this purpose (Lande et al., 2012). We model the source as a disk with a power-law spectrum and we determine the position of its center and radius , along with flux and spectral index from LAT data, using an energy binning of eight bins per decade. We considered both the cases where 2FGL J2051.8+5054 is included as a separate point source in the model or removed. In the first case we obtain the best fit parameters: = 8862 005, = 479 006, and = 114 007. In the second we have = 8875 004, = 465 006, = 119 006. Errors reflect statistical uncertainties only. The for the case including separately 2FGL J2051.8+5054 in the model is larger by than the case with the disk only (Table 1). The significance of the separate source hypothesis is below the threshold usually required to claim a detection for LAT sources ( ). Deeper observations are needed to determine if 2FGL J2051.8+5054 can be distinguished as a source independent from the remnant. In the rest of the paper, we do not consider 2FGL J2051.8+5054 as a separate source and, therefore, we remove it from the model. We note that the results concerning the morphology of HB 21 are robust regardless of whether 2FGL J2051.8+5054 is included as a separate source in the model or not. Using the best fit disk, the significance of the detection of HB 21 is . We also check whether the source size changes with energy by separately fitting a disk to the LAT data from 1 to 3 GeV and from 3 to 10 GeV. We obtain = 119 009 in the lower-energy range and = 124 009 in the higher-energy range. No significant change in size with energy is detected.
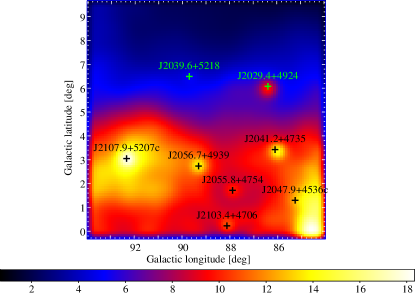
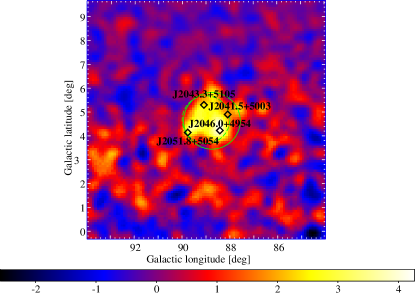
In Figure 1b we show the background model map obtained from the fit with the disk, and in Figure 1c the background-subtracted count map where the emission associated to HB 21 is visible. If we compare the with the model in which HB 21 is modeled by the four point sources in the 2FGL Catalog (Table 1) we find that the extended source provides a higher likelihood for a lower number of free parameters in the fit. Therefore, we conclude that the hypothesis of extended emission is preferred over four individual point sources.
We then calculate the systematic uncertainties related to interstellar emission using the alternative models as described in §2.3. When the alternative interstellar emission models are used, the -ray disk is systematically shifted toward the north-west part with respect to the radio shell (with shifts in longitude between 019 and 024, and in latitude between 006 and 009), and the disk radius is systematically smaller by 018–024, but the significance of the detection of HB 21 does not change sizably. This effect is mainly due to the different approaches used to deal with the dark gas, neutral interstellar gas which is not well traced by the linear combination of column densities inferred from the 21-cm line and the 2.6-mm CO line, but which is traced by correlated residuals in dust emission/absorption and interstellar -ray emission (Grenier et al., 2005). Dust residuals are used as a dark-gas template fitted to the -ray data in the standard interstellar model, whereas they are used to correct the column densities in the alternative models assuming a dust-to-gas ratio independent from -ray observations. This leads to different estimates of the gas column densities, therefore to different structures in the interstellar emission models. Additionally, the standard model accounts for enhanced interstellar emission toward the nearby Cygnus X complex (see Ackermann et al., 2011, 2012c), whereas the alternative models do not. These differences are found to have a significant impact on the determination of the SNR morphology. We note that for all the alternative models the disk extends beyond the rim of the remnant in coincidence with the western molecular cloud, but leave the faint south-east edge of the radio shell off.
| sources | d.o.f. | |
|---|---|---|
| Null hypothesis | 0 | 0 |
| 4 point sources | 256 | 10 |
| disk | 302 | 5 |
| disk + 2FGL J2051.8+5054 | 316 | 7 |
| X-ray image | 212 | 2 |
| X-ray image+ 2FGL J2051.8+5054 | 234 | 4 |
| radio image | 298 | 2 |
| radio image + 2FGL J2051.8+5053 | 312 | 4 |
|
|
|
|
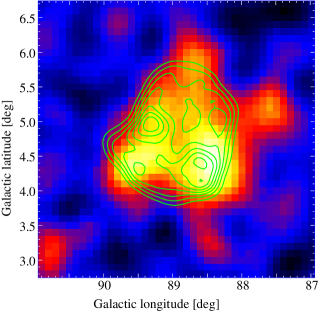
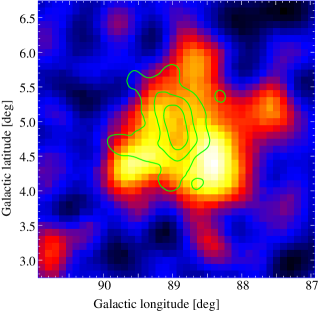
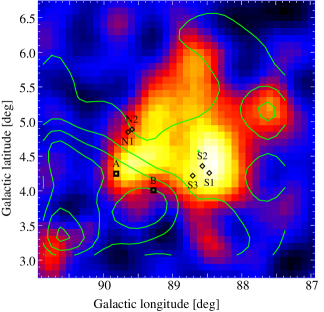
In Figure 2 we compare the -ray emission associated with HB 21 to emission from the remnant at other wavelengths. Figure 2a compares the -ray image with radio emission at 6-cm tracing non-thermal electrons (see later §3). Figure 2b compares the -ray morphology with X-ray emission from the thermal plasma filling the center of the remnant, measured by ROSAT (Voges et al., 1999). The ROSAT image was cleaned using the standard background maps555Available from http://www.xray.mpe.mpg.de/cgi-bin/rosat/rosat-survey. Finally Figure 2c compares the -ray emitting region with the distribution of molecular material. Molecular column densities in the Local-Arm region are traced by the CO line intensities at 2.6-mm (Dame et al., 2001; Dame & Thaddeus, 2011) integrated over velocities with respect to the local standard of rest within km s-1. We also show the positions of shocked CO clumps and of two large CO clouds distributed along the boundary of the radio shell (Koo & Heiles, 1991). The -ray emission associated with HB 21 is broader than the central region filled by thermal X-ray emitting plasma. It compares well with the radio shell, but appears to extend beyond the radio shell in regions where molecular clouds are present. The brightest -ray regions coincide with the Southern shocked CO clumps identified by Koo & Heiles (1991). This correlation with CO suggests that at least part of the -ray emission from HB 21 may be produced by accelerated particles colliding with dense interstellar matter.
To quantitatively assess the correlation between -ray, X-ray and radio emission from HB 21 we use the X-ray and radio images as templates in the -ray analysis. For both templates we compare the cases when 2FGL J2051.8+5054 is included in the fit as a background source or not. All the spatial templates are fitted with a power-law spectrum. From the results reported in Table 1 we confirm that the morphology of the remnant in -rays significantly differs, as expected, from the emission in X-rays. Both the radio template and the -ray disk provide a good fit to the data, though the first has less degrees of freedom, as shown in Table 1. Since the two models are not nested it is not possible to conclude which is the best one. Given that the disk model provides the largest of all single source models, and is derived from the -ray data, we use this model to compute the spectrum of the remnant.
2.5 Spectral analysis
The spectral energy distribution (SED) of HB 21 is determined over the full energy range between 100 MeV and 300 GeV (using 35 logarithmic energy bins for the likelihood analysis) by modeling the remnant with the best-fit disk. We compare the hypotheses of a power law
| (2) |
with three different curved spectral models in order to quantify deviations from the former. The three functional forms are:
-
1.
log-parabola.
(3) -
2.
smooth broken power law
(4) with and being the spectral indices below and above the break energy , respectively
-
3.
power law with exponential cutoff
(5) where is the cutoff energy.
| spectrum shape | additional d.o.f. | Fit parameters | |
|---|---|---|---|
| power law | 0 | 0 | =2.330.03 |
| log-parabola | 92 | 1 | |
| smooth broken power law | 41 | 2 | 1=1.670.02 |
| 2=3.540.05 | |||
| Eb=78965 MeV | |||
| power law with exponential cutoff | 82 | 1 | 1=1.420.03 |
| Ec=95841 MeV |
In Table 2 we report the values and the additional degrees of freedom for the curved spectral models compared to the power law. All the curved models have a higher than the power law distribution. For the following discussion we adopt the log-parabola because it yields the largest improvement with respect to the simple power-law, with a , corresponding to an improvement at a 9 significance level in the energy range from 100 MeV to 300 GeV. The total -ray energy flux from HB 21 results to be erg cm-2 s-1 and the photon flux ph cm-2 s-1. The systematic errors shown in this section are calculated as described in §2.3 and extracting the root mean square of the variations with respect to the values from the standard model.
We also computed the SED in a model-independent way by splitting the energy range between 0.1 MeV and 60 GeV in 12 logarithmically spaced bins. The model is the same as described above, but in each narrow energy bin we leave free only the overall fluxes; other spectral parameters are fixed to the 2FGL values for background sources and to a power-law index of 2 for HB 21 (the results are insensitive to this particular choice). When for an individual bin is we calculate an upper limit at the 95% confidence level determined through the likelihood profile method.
We show the resulting SED in Figure 3 with also systematic errors indicated. Systematic errors due to interstellar emission model are then summed in quadrature with the error due to the LAT effective area uncertainties (§2.3) for display.
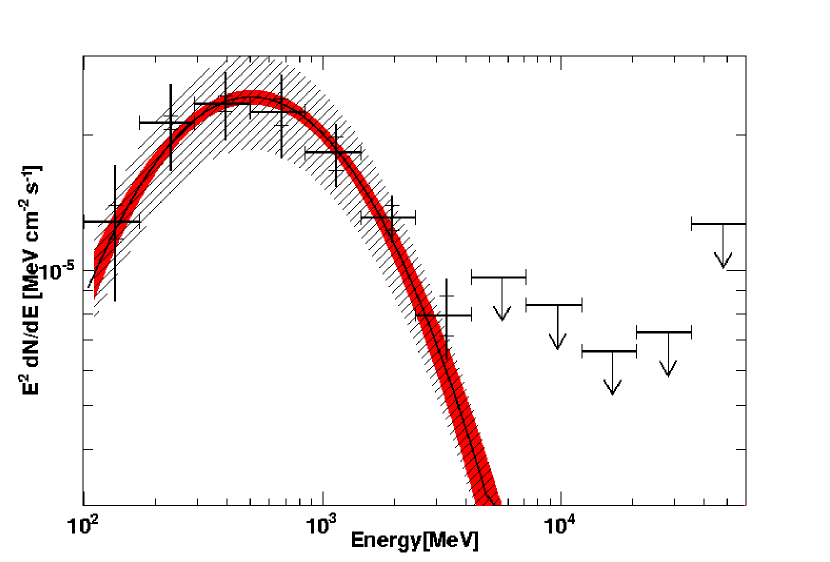
The SED points are reported in Table 3. The contributions due to the modeling of interstellar emission and the LAT effective area are presented separately. In the energy range considered, the systematic errors are driven by the interstellar emission model.
| Energy bin center | Statistical | IEM | EA | Total syst. | |
|---|---|---|---|---|---|
| [MeV] | [eV cm-2 s-1] | [eV cm-2 s-1] | [eV cm-2 s-1] | [eV cm-2 s-1] | [eV cm-2 s-1] |
| 135 | 12.8 | 1.1 | 4.1 | 1.2 | 4.3 |
| 230 | 21.3 | 0.8 | 4.3 | 1.8 | 4.7 |
| 393 | 23.5 | 0.9 | 3.8 | 1.6 | 4.1 |
| 670 | 22.5 | 1.5 | 4.6 | 1.1 | 4.8 |
| 1143 | 18.3 | 1.5 | 2.7 | 0.9 | 2.9 |
| 1950 | 13.1 | 0.9 | 1.4 | 0.7 | 1.6 |
| 3327 | 7.9 | 0.8 | 1.5 | 0.5 | 1.6 |
2.6 Search for spectral variations across the remnant
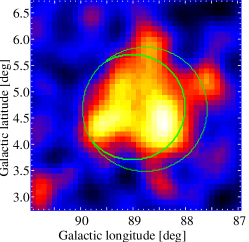
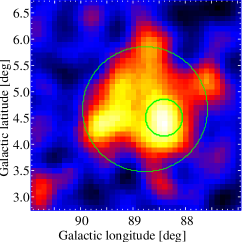
HB 21 is an extended source, located in an area rich in interstellar matter. The interaction with nearby molecular clouds (Byun et al., 2006) might cause spectral variation across the SNR, as suggested in the analysis by Reichardt et al. (2012). To further investigate the possibility, we repeat the analysis described in §2.4 after splitting the best-fit disk in several different ways (Figure 4):
-
a.
radio-emitting area (modeled with a uniform disk centered at l=890 b=+47 with radius 1∘) and the remainder of the best-fit disk (Figure 4a);
-
b.
southern shocked-CO region (modeled as a uniform disk centered at l=8838 b=450 and radius 035) and the remainder of the best-fit disk (Figure 4b);
-
c.
disk split into two halves to separate the southern shocked CO area from the rest (Figure 4c);
- d.
|
|

|

|
We first perform the analysis above 1 GeV to profit from the narrower PSF. For this configuration we modeled the source spectrum as a simple power law. The results are reported in Table 4. There are no significant improvements in the likelihood from splitting the disk in subregions (). This means that there is no evidence of spectral variations across the -ray emitting region. Indeed, the spectral indices of the subregions are all compatible within statistical uncertainties.
| region splitting | d.o.f. | index 1 | index 2 | index 3 | |
|---|---|---|---|---|---|
| single disk | 0 | 0 | 3.090.12 | ||
| a | 2.8 | 2 | 2.980.12 | 3.350.10 | |
| b | 4.2 | 2 | 2.880.31 | 3.140.15 | |
| c | 2.2 | 2 | 2.860.4 | 3.290.1 | |
| d | 1.6 | 4 | 2.920.22 | 3.290.21 | 2.950.17 |
Then we perform the analysis over the full energy range above 100 MeV. We fit the spectrum of each subregion with a log-parabola function as for the uniform disk. The results are reported in Table 5. Even for this larger energy range we find only marginal evidence () of spectral variations across the remnant and the values for the spectral parameters are compatible within statistical errors.
| region splitting | d.o.f. | |||
|---|---|---|---|---|
| single disk | 0 | 0 | 2.540.05 | 0.390.04 |
| a | 13 | 3 | =2.410.09 | =0.370.06 |
| =3.480.89 | =0.740.39 | |||
| b | 13.4 | 3 | =2.270.06 | =0.380.04 |
| =2.610.21 | =0.430.03 | |||
| c | 8 | 3 | =2.470.06 | =0.360.03 |
| =2.640.09 | =0.450.03 | |||
| d | 3 | 6 | =2.350.15 | =0.380.10 |
| =2.750.29 | =0.390.17 | |||
| =2.530.18 | =0.430.13 |
In conclusion, we do not confirm the claim by Reichardt et al. (2012) of a softer spectrum toward the clouds NW and A. Spectral variations are not signifcant (), even considering statistical uncertainties only. More data and a better handling of the current dominating uncertainties related to the modeling of interstellar emission (that were neglected in the study of Reichardt et al. 2012) are required in order to further probe for possible -ray spectral variations across HB 21.
3 observations and radio spectrum
The radio morphology of HB 21 is that of a large oblate shell (see contours in Figure 4a). It has both a large angular diameter and high radio flux density, which have made it a favorable target for telescopes across the radio spectrum. High-resolution imaging reveals bright filaments and indentations along the periphery (Leahy & Roger, 1998). We use the 7-year all-sky data of the Wilkinson Microwave Anisotropy Probe (WMAP) to extend the radio spectrum of HB 21 above 10 GHz. Five bands are analyzed with effective central frequencies () of 23 to 93 GHz (Jarosik et al., 2011).
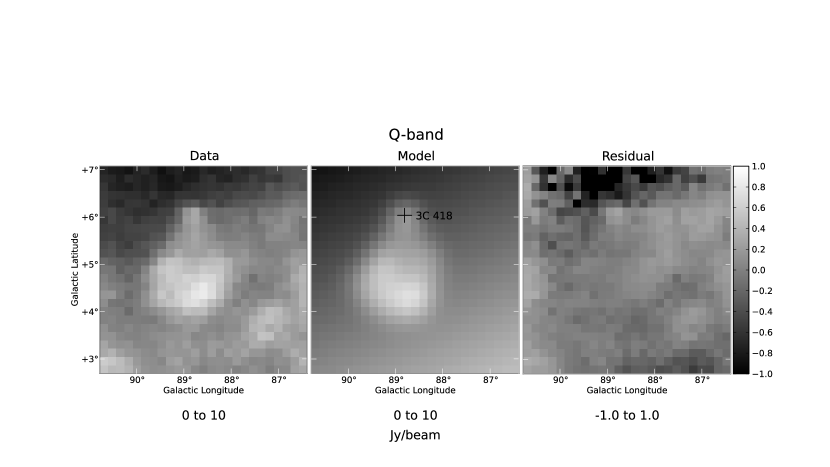
The WMAP data are fit within a 4° square region with a spatial template plus a sloping planar baseline (following Hewitt et al., 2012). For the spatial template we use the map of HB 21 from the Sino-German 6-cm (4.8 GHz) survey (Gao et al., 2011, resolution of 9.5′). We include a separate, freely-normalized point source to account for the bright nearby extragalactic point source 3C 418 (Hill, 1974). The templates are smoothed to the WMAP beam at each band (Weiland et al., 2011) and fit to the data.
Figure 5 shows an example of the WMAP skymap, best-fit model and residual map for the Q band (61 GHz). Table 6 lists the beam sizes and fitted fluxes with errors estimated from the RMS of the fit residuals. To ensure that fluxes we extracted from the WMAP data are properly calibrated, we also analyzed the bright radio sources 3C 58 and Cassiopeia A using the same procedure and find agreement with Weiland et al. (2011). We also note that the addition of a template for 3C 418 does not produce a significant change in the measured fluxes of HB 21.
| Band | beam FWHM | Flux Density | |
|---|---|---|---|
| (GHz) | (°) | (Jy) | |
| K | 22.7 | 0.93 | 343 |
| Ka | 33.0 | 0.68 | 244 |
| Q | 40.6 | 0.53 | 205 |
| V | 60.5 | 0.35 | 178 |
| W | 93.0 | 0.23 | 56aa2 upper limit. |
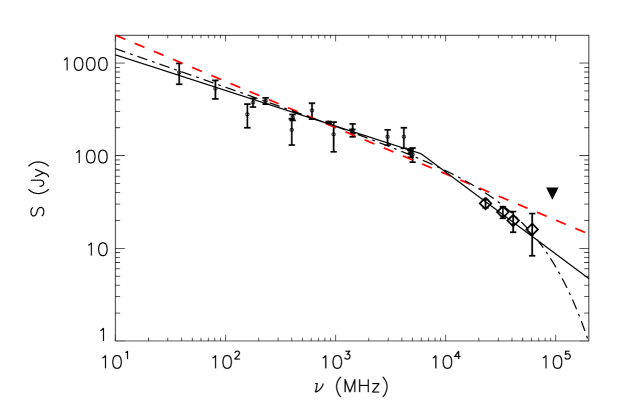
The global radio spectrum of HB 21 from 38 MHz to 93 GHz is shown in Figure 6. We include our WMAP analysis along with published flux densities from the literature (Kothes et al., 2006, and references therein). It is evident that a spectral break is present in the spectrum at high frequencies. We first fit the radio spectrum with a single power law, S() = S0 and find a flux normalization at 1 GHz of S0 = 2013 Jy and an index = 0.50 0.02. The fitted index is significantly steeper than = 0.38 determined from fitting only the data below 10 GHz because it does not account for the break at high frequencies.
We therefore include a spectral break of = 0.5 at a frequency . This is appropriate for synchrotron losses in a homogeneous source of continuously injected electrons, as expected for middle-aged SNRs (Leahy & Roger, 1998; Reynolds, 2009, Section 2.1). With one additional free parameter, we can now produce a good fit to the radio spectrum. We find the spectral break to have a significance of 5.3 by applying the F-test to compare the fit to that of the simple power-law. The best fit parameters for the radio spectrum of HB 21 are = 0.38 0.02 and = 5.9 1.2 GHz. Additionally, we tried to fit the spectrum using a power law with an exponential cutoff of the form, S() = S0 exp(). This produces nearly as good a fit, with = 0.34 0.02, = 29 4 GHz, and a significance of 5.2.
The radio index, , is related to the particle index, , by = 2+1. The observed radio index below the break = 0.38 gives 1.8, which is similar to the spectral index obtained with the Fermi LAT data in §2.5. We explore physical mechanisms which could explain both the -ray and radio spectra in the discussion in §4.
The observed break in the high-frequency spectrum cannot be explained by spectral variations across HB 21. Leahy (2006) studied spectral variations using radio observations at 408 and 1420 MHz. Manual fits to 36 individual regions across the SNR show variations between 0.2–0.8, with a mean spectral index of 0.45 and a standard deviation of 0.16. The brightest regions tend to have an index that is flatter than average and than the canonical spectral index (0.5) from diffusive shock acceleration. Thus, fitting the radio spectral index of the flux from the entire remnant leads to an even flatter global index of 0.38.
4 Discussion
4.1 Non-thermal Modeling
We have identified spatially extended -ray emission coincident with SNR HB 21, indicating the presence of relativistic particles. Determining the mechanism responsible for -ray emission is crucial in order to measure the underlying particle population accelerated by the SNR. To do so, we model emission from the remnant using isis, the Interactive Spectral Interpretation System (Houck & Denicola, 2000). For arbitrary particle momentum distributions, a suite of interaction models available in the literature is used to calculate the non-thermal emission spectrum (Houck & Allen, 2006, and references therein) which is then fit to radio and -ray data. We used an updated interaction cross section for hadronic interactions (Karlsson & Kamae, 2008). The included prescriptions are in agreement with the results from Sturner et al. (1997).
To constrain the emitting particle distribution we simultaneously fit radio and -ray emission from non-thermal electrons and protons. Initially, we adopt the simplifying assumption that all emission originates from a region characterized by a constant matter density and magnetic field strength. This single emitting zone is assumed to be equal to the size of the remnant derived from the best-fit -ray disk. Additionally, the population of accelerated nuclei and electrons is assumed to be described by the same particle distribution, here assumed to follow a power-law with an exponential cutoff of the form dN/d exp(–), where / gives the ratio of electrons to protons and the momentum. The normalization and maximum energy cutoff are left as free parameters, and adjusted to fit the data. An exponential cutoff in the momentum spectra of electrons is expected when energy losses exceed the rate of energy gain from shock acceleration (Webb et al., 1984). In practice, we find that we do not have sufficient spectral coverage to differentiate strongly between an exponential cutoff or a broken power law.
To determine the total energy in relativistic particles from the normalization of the non-thermal emission we must consider the physical conditions of the emitting region. HB 21 is known to lie in the vicinity of several large molecular clouds. The presence of optical S II but not oxygen line emission indicates slow shocks 100 km s-1 into ambient densities of at least 2.5 cm-3 (Mavromatakis et al., 2007). Shocked CO filaments are observed with densities of order 102–104 cm-3 and small filling factors (Koo et al., 2001). For neutral gas, the mean ambient HI density for the expanding shell is 8 cm-3 at a distance of 1.7 kpc (Koo & Heiles, 1991). Reichardt et al. (2012) estimated the molecular mass within HB 21 by integrating all CO line emission between the velocity range from +0 to –20 km s-1. This estimate likely includes molecular gas outside the SNR, but is a conservative upper limit. Adopting a distance of 1.7 kpc, the maximum molecular mass is , the diameter of the SNR is 55 pc, and the maximum volume-averaged molecular gas density is 25 cm-3. Therefore, we assume a gas density of 15 cm-3, noting that this is uncertain by a factor of a few.
There are three primary emission mechanisms to produce -ray emission in SNRs. In the so-called hadronic scenario the emission is dominated by -rays radiated through the decay of mesons produced in collisions between accelerated nuclei with the ambient gas. In the leptonic scenarios -ray emission results either from IC scattering of relativistic electrons on low-energy photon fields such as the cosmic microwave background (CMB), or non-thermal bremsstrahlung. As the matter density is increased, the bremsstrahlung contribution will rise and dominate over the IC at densities 1 cm-3, unless the photon field is greatly amplified above the CMB. HB 21 appears to have a high enough gas density that bremsstrahlung is expected to dominate over IC emission. In modeling the non-thermal spectrum of HB 21 we explored models in which the assumed physical conditions are modified such that each of these three emission mechanisms is dominant.
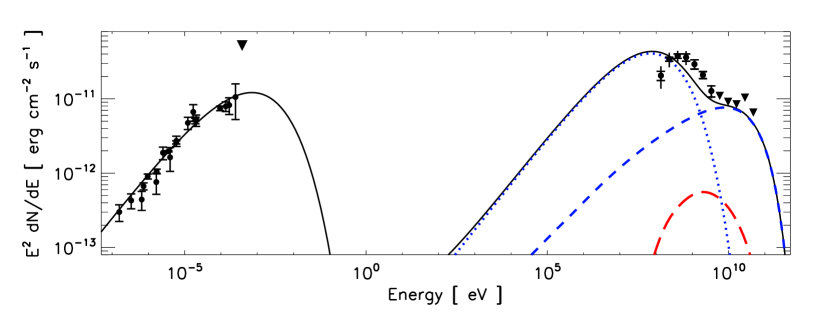
One-zone models for all three scenarios are presented as SED fits in Figure 7. Parameters are given in Table 7, including the total energy of accelerated particles integrated above 1 GeV for protons, and above 511 keV for electrons. We adjusted the ratio of electrons-to-protons to differentiate between bremsstrahlung- and hadronic-dominated models. A ratio / 0.01 is seen in cosmic rays at Earth around 10 GeV (Gaisser, 1990), but an even lower ratio 0.001 may be expected from diffusive shock acceleration models (Reynolds, 2008). We cannot robustly constrain / through our fits, so we choose characteristic values for each scenario. While the chosen parameters are not unique in their ability to fit the broadband spectrum, they are representative.
Under our simple assumptions, a single zone with a single particle distribution for both electrons and protons, we find that only hadronic models can reproduce both the observed radio and -ray spectra. For / = 0.001 we find a momentum cutoff of 10 GeV/c and a magnetic field of 90 G. Decreasing / results in a higher magnetic field strength to simultaneous fit the synchrotron normalization and break in the radio. Bremsstrahlung dominates over neutral pion decay when / 0.05, but there is no combination of magnetic field strength and momentum cutoff that can simultaneously produce the observed SED from one electron population, as can be seen in Figure 7. To produce a model in which IC emission dominates, we must adopt a density of 0.1 cm-3, which is well below gas density estimates. Therefore an IC-dominated model is unlikely, and furthermore, cannot produce a good fit to the data. The energetics of our hadronic model indicate 31049 erg in accelerated cosmic ray protons and nuclei, which is comparable to that estimated for other old SNRs in a dense environment detected by Fermi.
The failure of bremsstrahlung-dominated models is largely due to an inability to fit both the observed spectral breaks in the radio and -rays. To explain synchrotron emission at a peak frequency from an electron in a magnetic field B, requires the electron have an energy E = 14.7(/BμG)1/2 GeV (Reynolds, 2008). For the observed radio break at 6 GHz and -ray break at 1 GeV to be explained by the same electron population requires a magnetic field of 1 mG, which is far in excess of the magnetic field expected for a SNR in such an evolved stage (unless the density is very high 104 cm-3). However, molecular clouds have a well-known multiphase structure, so the density of HB 21 is unlikely to be uniform, and the one-zone approximation may be overly simplistic.
We therefore explored relaxing the single-zone assumption by modeling the radio and -ray emission as dominated by distinct regions. Allowing the normalization and spectrum of the radio emission to be separately fit from -rays is physically motivated. Radio emission is observed from dense filaments, but globally may be dominated by diffuse gas that fills a larger volume. For SNRs W44 and IC 443 the observed proton index from -decay emission is softer than the electron index inferred from the radio spectrum (Ackermann et al., 2013b).
In this two-zone scenario, we found that both bremsstrahlung- and hadronic-dominated models can fit the data. The cutoff in the accelerated particle spectrum responsible for -rays need not match that responsible for the radio emission, due to the different physical conditions. It is also possible that high-energy CR electrons may cool in the dense filaments formed by shock-interaction with molecular clumps, or that CR protons may have largely escaped from the SNR (Aharonian & Atoyan, 1996; Malkov et al., 2011). In the latter case, we would expect that nearby clouds could be illuminated by the escaping CRs, but the geometry of the clouds in relation to HB 21 is not well known. While multi-zone models appear as feasible as single zone models, they are not well constrained due to the poor spatial resolution of the data at -rays and high-frequency radio. The energy in CRs in bremsstrahlung-dominated two-zone models is several times 1048 ergs, with a comparable energy in accelerated nuclei and leptons.
| Model | Index | / | |||||
|---|---|---|---|---|---|---|---|
| [GeV/c] | [cm-3] | [G] | [erg] | [erg] | |||
| IC | 1.76 | 100 | 0.1 | 2 | 1 | 1.31050 | 2.11051 |
| Brems. | 1.76 | 19 | 15 | 24 | 0.1 | 6.41048 | 1048 |
| -decay | 1.76 | 8.1 | 15 | 140 | 0.001 | 3.01049 | 1.11047 |
4.2 HB 21 and the population of detected -ray SNRs
Here we briefly discuss HB 21 in comparison to other -ray SNRs known to be interacting with molecular clouds. The total luminosity of HB 21 above 100 MeV at a distance of 1.7 kpc is 1034 erg s-1. Other -ray-detected MM SNRs, such as W44 and IC 443, have luminosities of 1035 erg s-1 and associated cloud masses of 104 M⊙. While the total CO line emission along the line of sight to HB 21 indicates a large cloud mass, this could be due to the Cygnus OB7 complex, which lies along the line of sight at a similar velocity to HB 21, but at a distance of only 0.8 kpc, between us and the SNR. It is therefore possible that the low luminosity of HB 21 is due to the SNR currently encountering only a relatively small reservoir of material.
Flat radio indices, as for HB 21, are observed for other -ray detected SNRs known to be interacting with molecular clouds, such as IC 443 and W44. Leahy (2006) proposed two mechanisms to produce the observed flat spectrum: ionization losses due to emission from regions of high density, and low-frequency absorption by thermal electrons in the post-shock cooling regions. Alternatively, Uchiyama et al. (2010) proposed that re-acceleration takes place in the compressed cloud, resulting in a hardening of the spectrum of existing accelerated particles. Though it is likely interacting with a less-dense environment than HB 21, the latter model was shown to plausibly explain radio and -ray emission from SNR S147 (Katsuta et al., 2012).
HB 21 shows a cutoff or break in the -ray spectrum mirroring that of the underlying particle spectrum, which is typical of middle-aged SNRs detected by the LAT (e.g. the Cygnus Loop, Katagiri et al. 2011, and W28, Abdo et al. 2010a). This is in agreement with the circumstantial evidence for HB 21 itself to be a middle-aged/old remnant (see §1). Given the long timescales for radiative losses via proton-proton collision, bremsstrahlung or synchrotron losses for GeV particles, it is unlikely that such spectral curvature is produced by radiative losses. Several mechanisms have been proposed, including runaway CRs illuminating nearby clouds (Gabici et al., 2009), the aforementioned re-acceleration in highly-compressed shocks at the interaction sites (Uchiyama et al., 2010), and magnetic damping of Alfven waves in a partially ionized medium that leads to a break in the particle spectrum (Malkov et al., 2011). All these mechanisms appear viable for the case of HB 21, and could produce different particle distributions for electrons and protons remaining in the SNR. Given the many shared similarities with other MM SNRs, HB 21 appears to be an extension of this -ray class to lower luminosities.
5 Summary
We analyzed Fermi LAT -ray data from the region around HB21, a MM SNR. We detect significant -ray emission (29) associated with the remnant. The emission is best modeled by a disk centered at (l,b) = (8875 004, +465 006) with a radius r = 119 006 with a systematic uncertainty on the position of 025 and on the radius of 024, so it is well-resolved by the LAT for energies greater than 1 GeV. The -ray emission extends over the whole area of the non-thermal radio shell, larger than the X-ray emitting thermal core. The emission in -rays may extend beyond the radio shell in a region rich of interstellar matter in the north western part of the SNR. Furthermore, the brightest -ray emitting region coincides with known shocked molecular clumps. Both results are suggestive that collisions of shock-accelerated particles with interstellar matter are responsible for the observed -ray emission. No spectral variations across the -ray emitting region that would further support this hypothesis were detected with the current observations.
The spectrum is best modeled by a curved function, indicative of a cutoff or break in the spectrum of the accelerated particles, typical of middle-aged/old SNRs in a dense interstellar environment. The total -ray luminosity of HB 21 above 100 MeV is estimated to be erg s-1, fainter than other SNRs interacting with molecular clouds detected by the LAT. This can be explained by the lower mass of the molecular clouds supposed to be in interaction with the remnant.
Reichardt et al. (2012) recently reported a lower luminosity for HB 21. We assume a distance of 1.7 kpc, based on the arguments of Byun et al. (2006), while their work assumes a nearer distance of 0.8 kpc adopted in numerous earlier works. Taking this difference into account, our values of the 0.1-10 GeV flux and luminosity of SNR HB 21 are in agreement. Even considering statistical uncertainties only, we do not find any significant evidence for spectral variations across the SNR, as suggested for cloud NW and A in their work.
We complement the -ray analysis by exploiting the WMAP 7-year observations from 23 to 93 GHz, obtaining the first detections of HB 21 at these energies. By combining WMAP with lower-energies radio observations we find that the radio spectral index of HB 21 steepens significantly above 10 GHz. This spectral feature in the radio helps to constrain the relativistic electron spectrum and constrain possible physical parameters in simple non-thermal radiation models.
An IC origin of the -ray emission is disfavored because it would require unrealistically low interstellar densities in order to prevent bremsstrahlung from dominating. decay due to nuclei interactions can reproduce the data well. Bremsstrahlung and synchrotron emission from a single population of energetic electrons cannot reproduce both the -ray and radio SEDs. Based on the most likely values for the ISM densities over the volume of the remnant, in the hadronic-dominated scenario accelerated nuclei contribute a total energy of 31049 ergs. This is reduced to several times 1048 ergs under a two-zone bremsstrahlung-dominated model, with a comparable energy in leptonic CRs.
The Fermi-LAT Collaboration acknowledges generous ongoing support from a number of agencies and institutes that have supported both the development and the operation of the LAT as well as scientific data analysis. These include the National Aeronautics and Space Administration and the Department of Energy in the United States, the Commissariat à l’Energie Atomique and the Centre National de la Recherche Scientifique/Institut National de Physique Nucléaire et de Physique des Particules in France, the Agenzia Spaziale Italiana and the Istituto Nazionale di Fisica Nucleare in Italy, the Ministry of Education, Culture, Sports, Science and Technology (MEXT), High Energy Accelerator Research Organization (KEK) and Japan Aerospace Exploration Agency (JAXA) in Japan, and the K. A. Wallenberg Foundation, the Swedish Research Council and the Swedish National Space Board in Sweden. Additional support for science analysis during the operations phase is gratefully acknowledged from the Istituto Nazionale di Astrofisica in Italy and the Centre National d’Études Spatiales in France.
The Lovell Telescope is owned and operated by the University of Manchester as part of the Jodrell Bank Centre for Astrophysics with support from the Science and Technology Facilities Council of the United Kingdom. The Westerbork Synthesis Radio Telescope is operated by Netherlands Foundation for Radio Astronomy, ASTRON.
References
- Abdo et al. (2009a) Abdo, A. A., et al. 2009a, ApJ, 706, L1
- Abdo et al. (2009b) —. 2009b, Astroparticle Physics, 32, 193
- Abdo et al. (2010a) —. 2010a, ApJ, 718, 348
- Abdo et al. (2010b) —. 2010b, ApJ, 722, 1303
- Abdo et al. (2010c) —. 2010c, Science, 327, 1103
- Abdo et al. (2010d) —. 2010d, ApJ, 712, 459
- Abdo et al. (2011) —. 2011, ApJ, 734, 28
- Abdo et al. (2013) —. 2013, ApJS, 208, 17
- Acciari et al. (2011) Acciari, V. A., et al. 2011, ApJ, 730, L20
- Ackermann et al. (2011) Ackermann, M., et al. 2011, Science, 334, 1103
- Ackermann et al. (2012a) —. 2012a, ApJ, 750, 3
- Ackermann et al. (2012b) —. 2012b, Astroparticle Physics, 35, 346
- Ackermann et al. (2012c) —. 2012c, A&A, 538, A71
- Ackermann et al. (2013a) —. 2013a, Science, 339, 807
- Ackermann et al. (2013b) —. 2013b, Science, 339, 807
- Aharonian et al. (2007) Aharonian, F., et al. 2007, A&A, 464, 235
- Aharonian & Atoyan (1996) Aharonian, F. A., & Atoyan, A. M. 1996, A&A, 309, 917
- Albert et al. (2007) Albert, J., et al. 2007, ApJ, 664, L87
- Atwood et al. (2009) Atwood, W. B., et al. 2009, ApJ, 697, 1071
- Byun et al. (2006) Byun, D.-Y., Koo, B.-C., Tatematsu, K., & Sunada, K. 2006, ApJ, 637, 283
- Case & Bhattacharya (1998) Case, G. L., & Bhattacharya, D. 1998, ApJ, 504, 761
- Castro & Slane (2010) Castro, D., & Slane, P. 2010, ApJ, 717, 372
- Dame et al. (2001) Dame, T. M., Hartmann, D., & Thaddeus, P. 2001, ApJ, 547, 792
- Dame & Thaddeus (2011) Dame, T. M., & Thaddeus, P. 2011, ApJ, 734, L24
- de Palma et al. (2013) de Palma, F., Brandt, T. J., Johannesson, G., Tibaldo, L., & for the Fermi LAT collaboration. 2013, ArXiv e-prints
- Drury (2012) Drury, L. O. . 2012, Astroparticle Physics, 39, 52
- Flower & Pineau des Forêts (1999) Flower, D. R., & Pineau des Forêts, G. 1999, MNRAS, 308, 271
- Gabici et al. (2009) Gabici, S., Aharonian, F. A., & Casanova, S. 2009, MNRAS, 396, 1629
- Gaisser (1990) Gaisser, T. K. 1990, Cosmic rays and particle physics
- Gao et al. (2011) Gao, X. Y., Han, J. L., Reich, W., Reich, P., Sun, X. H., & Xiao, L. 2011, A&A, 529, A159
- Giordano et al. (2012) Giordano, F., et al. 2012, ApJ, 744, L2
- Giuliani et al. (2011) Giuliani, A., et al. 2011, ApJ, 742, L30
- Green (2009) Green, D. A. 2009, Bulletin of the Astronomical Society of India, 37, 45
- Grenier et al. (2005) Grenier, I. A., Casandjian, J.-M., & Terrier, R. 2005, Science, 307, 1292
- Hewitt et al. (2012) Hewitt, J. W., Grondin, M.-H., Goumard-Lemoine, M., Reposuer, T., Ballet, J., & others. 2012, ApJ, in print
- Hewitt et al. (2009) Hewitt, J. W., Yusef-Zadeh, F., & Wardle, M. 2009, ApJ, 706, L270
- Hill (1974) Hill, L. E. 1974, MNRAS, 169, 59
- Houck & Allen (2006) Houck, J. C., & Allen, G. E. 2006, ApJS, 167, 26
- Houck & Denicola (2000) Houck, J. C., & Denicola, L. A. 2000, in Astronomical Society of the Pacific Conference Series, Vol. 216, Astronomical Data Analysis Software and Systems IX, ed. N. Manset, C. Veillet, & D. Crabtree, 591
- Janssen et al. (2009) Janssen, G. H., Stappers, B. W., Braun, R., van Straten, W., Edwards, R. T., Rubio-Herrera, E., van Leeuwen, J., & Weltevrede, P. 2009, A&A, 498, 223
- Jarosik et al. (2011) Jarosik, N., et al. 2011, ApJS, 192, 14
- Karlsson & Kamae (2008) Karlsson, N., & Kamae, T. 2008, ApJ, 674, 278
- Katagiri et al. (2011) Katagiri, H., et al. 2011, The Astrophysical Journal, 741, 44
- Katsuta et al. (2012) Katsuta, J., et al. 2012, ApJ, 752, 135
- Knoedlseder et al. (1996) Knoedlseder, J., Oberlack, U., Diehl, R., Chen, W., & Gehrels, N. 1996, A&AS, 120, C339
- Koo & Heiles (1991) Koo, B.-C., & Heiles, C. 1991, ApJ, 382, 204
- Koo et al. (2001) Koo, B.-C., Rho, J., Reach, W. T., Jung, J., & Mangum, J. G. 2001, The Astrophysical Journal, 552, 175
- Kothes et al. (2006) Kothes, R., Fedotov, K., Foster, T. J., & Uyanıker, B. 2006, A&A, 457, 1081
- Lande et al. (2012) Lande, J., et al. 2012, ApJ, 756, 5
- Lazendic & Slane (2006) Lazendic, J. S., & Slane, P. O. 2006, ApJ, 647, 350
- Leahy (2006) Leahy, D. A. 2006, ApJ, 647, 1125
- Leahy & Aschenbach (1996) Leahy, D. A., & Aschenbach, B. 1996, A&A, 315, 260
- Leahy & Roger (1998) Leahy, D. A., & Roger, R. S. 1998, ApJ, 505, 784
- Lorimer et al. (2006) Lorimer, D. R., et al. 2006, MNRAS, 372, 777
- Malkov et al. (2011) Malkov, M. A., Diamond, P. H., & Sagdeev, R. Z. 2011, Nature Communications, 2
- Mattox et al. (1996) Mattox, J. R., et al. 1996, ApJ, 461, 396
- Mavromatakis et al. (2007) Mavromatakis, F., Xilouris, E. M., & Boumis, P. 2007, Astronomy and Astrophysics, 461, 991
- Nolan et al. (2012) Nolan, P. L., et al. 2012, ApJS, 199, 31
- Protassov et al. (2002) Protassov, R., van Dyk, D. A., Connors, A., Kashyap, V. L., & Siemiginowska, A. 2002, ApJ, 571, 545
- Reichardt et al. (2012) Reichardt, I., de Oña-Wilhelmi, E., Rico, J., & Yang, R. 2012, A&A, 546, A21
- Reynolds (2008) Reynolds, S. P. 2008, ARA&A, 46, 89
- Reynolds (2009) —. 2009, ApJ, 703, 662
- Rho & Petre (1998) Rho, J., & Petre, R. 1998, ApJ, 503, L167
- Shinn et al. (2009) Shinn, J.-H., Koo, B.-C., Burton, M. G., Lee, H.-G., & Moon, D.-S. 2009, ApJ, 693, 1883
- Smith et al. (2008) Smith, D. A., et al. 2008, A&A, 492, 923
- Sturner et al. (1997) Sturner, S. J., Skibo, J. G., Dermer, C. D., & Mattox, J. R. 1997, ApJ, 490, 619
- Uchiyama et al. (2010) Uchiyama, Y., Blandford, R. D., Funk, S., Tajima, H., & Tanaka, T. 2010, ApJ, 723, L122
- Voges et al. (1999) Voges, W., et al. 1999, A&A, 349, 389
- Wang & Hirotani (2011) Wang, R.-B., & Hirotani, K. 2011, ApJ, 736, 127
- Webb et al. (1984) Webb, G. M., Drury, L. O., & Biermann, P. 1984, A&A, 137, 185
- Weiland et al. (2011) Weiland, J. L., et al. 2011, ApJS, 192, 19
- Yusef-Zadeh et al. (2003) Yusef-Zadeh, F., Wardle, M., Rho, J., & Sakano, M. 2003, ApJ, 585, 319