K. Fujisawa et al. Methanol Masers with EAVN \Received\Accepted
masers: methanol — Instrumentation: high angular resolution — Stars: formation — ISM: H\emissiontypeII regions
Observations of 6.7 GHz Methanol Masers with EAVN I : VLBI Images of the first Epoch of Observations
Abstract
Very long baseline interferometry (VLBI) monitoring of the 6.7 GHz methanol maser allows us to measure the internal proper motions of the maser spots and therefore study the gas motion around high-mass young stellar objects. To this end, we have begun monitoring observations with the East-Asian VLBI Network. In this paper we present the results of the first epoch observation for 36 sources, including 35 VLBI images of the methanol maser. Since two independent sources were found in three images, respectively, images of 38 sources were obtained. In 34 sources, more than or equal to 10 spots were detected. The observed spatial scale of the maser distribution was from 9 to 4900 astronomical units, and the following morphological categories were observed: elliptical, arched, linear, paired, and complex. The position of the maser spot was determined to an accuracy of approximately 0.1 mas, sufficiently high to measure the internal proper motion from two years of monitoring observations. The VLBI observation, however, detected only approximately 20% of all maser emission, suggesting that the remaining 80% of the total flux was spread into an undetectable extended distribution. Therefore, in addition to high-resolution observations, it is important to observe the whole structure of the maser emission including extended low-brightness structures, to reveal the associated site of the maser and gas motion.
1 Introduction
Although high-mass star formation has been intensively studied, it remains poorly understood because of the large distance and high obscuration of the high-mass star-forming regions and short duration of critical evolutionary phases ([Zinnecker & Yorke (2007)], and references therein). Star forming regions are associated with maser emissions of high brightness temperature, and high transparency in the radio band, which are suitable for probing young stellar objects (YSOs). Maser emissions are particularly useful for tracing circumstellar gas motions close to the central star. The 6.7 GHz methanol maser transition, which is the brightest among the methanol masers, is observed only from high-mass star-forming regions (e.g., [Menten (1991)]; [Caswell et al. (1995)]; [Minier et al. (2003)]; [Xu et al. (2008)]) and considered one of the best tracers of gas dynamics around high-mass YSOs.
Some 6.7 GHz methanol masers show linearly elongated morphology with a linear velocity gradient ([Norris et al. (1993)]; [Phillips et al. (1998)]; [Walsh et al. (1998)]; [Minier et al. (2000)]). These masers can be interpreted as circumstellar disks viewed edge-on. Bartkiewicz et al. (2009) analyzed samples surveyed by very-long-baseline interferometry (VLBI) imaging using the European VLBI Network (EVN). They found elliptical morphology in 30% of the sampled methanol masers and deduced that this morphology arises from inclined rotating disks with expansion or infall motions. In fact, rotational motions consistent with circumstellar disks have been identified as internal proper motions in a few 6.7 GHz methanol maser sources (G 16.590.05, G 23.010.41, and IRAS 201264104; Sanna et al. (2010a), \yearcite2010A&A…517A..78S; Moscadelli et al. (2011)). In addition, the 6.7 GHz methanol maser source AFGL 5142 exhibits infall proper motion (Goddi et al., 2011), while a rotation and infall motion is observed in Cepheus A (Sugiyama et al. 2013).
On the other hand, the associating sites of 6.7 GHz methanol masers remain obscure. De Buizer (2003) and De Buizer et al. (2009) reported that, in 60% of their samples, the methanol maser spots were distributed along the elongated direction of the H2 S(1) at 2.12 m and SiO thermal line emissions, which are shock diagnostic. According to these authors, such a parallel distribution suggests that methanol masers are directly associated with outflows. Supporting this inference, outward proper motions have been found in a few 6.7 GHz methanol maser sources (Rygl et al. (2010); Sugiyama et al. (2011); Matsumoto et al. (2011); Sawada-Satoh et al. 2013). Pandian et al. (2011) observed linear/arched morphology in only nine out of 50 sources with the Multi-Element Radio-Linked Interferometric Network (MERLIN) and the Karl G. Jansky Very Large Array (JVLA), and they did not detect any source with a clear elliptical morphology, in contrast to the results of Bartkiewicz et al. (2009).
If masers are to be used for studying high-mass star formation, the origin of the 6.7 GHz methanol maser must be elucidated. This can be achieved with VLBI monitoring of numerous unbiased sources, from which the spatial distributions and three-dimensional velocity field (radial velocity and proper motions in RA and Dec) of the maser can be statistically investigated.
To date, VLBI images of 6.7 GHz methanol masers have been reported for approximately 60 sources (e.g., Minier et al. (2000); Dodson et al. (2004); Sugiyama et al. (2008); Bartkiewicz et al. (2009)), while the masers have been detected in more than 900 high-mass star-forming regions (Pestalozzi et al. (2005), and references therein; Ellingsen (2007); Pandian et al. (2007); Xu et al. (2009b); Caswell et al. (2010), \yearcite2011MNRAS.417.1964C; Green et al. (2010), \yearcite2012MNRAS.420.3108G). As mentioned above, the internal proper motion of the 6.7 GHz methanol maser has been measured in only a fraction of cases. Therefore, we have started a VLBI monitoring project of the 6.7 GHz methanol maser sources with the East-Asian VLBI Network (EAVN) to systematically investigate their internal proper motions. This study presents the initial results of this project, namely, the spatial distributions of the 6.7 GHz methanol maser spots.
Section 2 describes the criteria for target source selection and provides details of the observations and data reduction methods. Section 3 presents the EAVN images, while individual sources are discussed in Section 4. Section 5 focuses on the spatial morphology and feasibility of measuring the internal proper motion. Throughout this paper, sources are named by their Galactic coordinates, expressed in the form xxx.xxxx.xx following the IAU recommendation for nomenclature, unless the source has been previously named (e.g., G 9.6210.196).
2 Observations and Data Reduction
2.1 Source Selection
The target sources were selected from the methanol maser catalog of Pestalozzi et al. (2005) and the Methanol Multibeam Survey catalog (Caswell et al. 2010; Green et al. 2010) using the following criteria: 1) source declination , 2) catalogued peak flux density 65 Jy, and 3) no previous VLBI observation. These criteria were satisfied by 34 sources. Two additional 6.7 GHz methanol maser sources 031.2800.06 and 049.4900.38 were included in the target sources, despite having been previously observed by EVN (Minier et al. 2000; Phillips & van Langevelde (2005); Surcis et al. (2012)). These were used to compare the imaging capabilities of EAVN with those of EVN. The selected 36 sources, together with their properties (Galactic and IRAS names (if any), coordinates, peak velocity, peak flux density, distance, and the references) are summarized in Table 1. Most of these sources (34/36, 94%) are located in the southern hemisphere ( 0∘).
2.2 EAVN Array
Observations were conducted with EAVN (Shen et al. (2004)), which consists of the following three VLBI networks: the Japanese VLBI Network (JVN; Doi et al. 2006), Korean VLBI Network (KVN; Minh et al. 2003), and Chinese VLBI Network (CVN; Ye et al. 1991). Due to the location of the EAVN stations at latitudes below 40∘ N, the facility is suitable to observing sources in the southern hemisphere. There are three main frequency bands of EAVN observations: 6.7, 8 and 22 GHz. The two Japanese telescopes Yamaguchi and Hitachi participating in this project are described in Fujisawa et al. (2002) and Yonekura et al. (2013), respectively.
2.3 Observations and Data Reduction
The first epoch observations of this monitoring project were conducted during six sessions between 2010 and 2011. Table 2 lists the observational parameters of each session, including the date, time, and participating telescopes. The location of the telescopes is shown in Figure 1. The projected baselines were from 6 M (Yamaguchi–Iriki) to 50 M (Mizusawa–Ishigaki) corresponding to fringe spacings of 34.4 mas and 4.1 mas, respectively, at 6.7 GHz. The typical size of the minor axis of the synthesized beam was 5 mas, although it varied depending on the uv-coverage.
The continuum sources 3C454.3 and NRAO530 were used as the fringe finder and bandpass calibrator, respectively. Continuum sources located adjacent to target maser sources, J17002610, J17430350, J18452852, J18240119, and J19301532, were used for delay calibration. For one source, 232.62+00.99, located apart from the other sources, J06070834, J06091542, and J07301141 were used for delay calibration. Five to seven maser sources were observed in each session. The integration time of a single scan of each maser source was 15 min, and scanning was repeated three or four times with an interval of 1 or 2 h, yielding a total integration time of approximately 1 h for each source. The data were recorded on magnetic tapes using the VSOP-terminal system at a data rate of 128 Mbps with 2-bit sampling and correlated at the Mitaka FX correlator (Shibata et al. 1998). We selected 4 MHz including spectral lines from the recorded 32 MHz at the correlation. The selected 4 MHz bandwidths were then divided into 1024 channels, yielding a velocity coverage of 180 km s-1 and channel spacing of 0.178 km s-1.
The data were reduced using the Astronomical Image Processing System (AIPS; Greisen 2003). Correlator digitization errors were corrected using the task ACCOR. The clock and clock-rate offsets were corrected and bandpass was calibrated using the strong continuum calibrators. Next, the delay was calibrated and Doppler corrections were performed. Amplitude calibration parameters were derived from the total-power spectra of maser lines using the template method in the task ACFIT. Template spectra at or near the VLBI observation date were obtained from single-dish observations of each target source with the Yamaguchi 32 m telescope. Fringe fitting was performed using one spectral channel of the strongest maser feature, followed by self-calibration. The fringe-fitted solutions were poor for some sources at longer-baseline because the maser components of these sources, including the strongest component, were heavily resolved out. At the amplitude calibration stage using the ACFIT, we flagged antennas for which calibration failed. Following calibration, uniformly weighted channel maps were made every 0.178 km s-1, and maser components were searched for within the image cubes. Maser components are considered real if detected with signal-to-noise ratio (SNR) at similar (within the beam FWHM) positions in two or more consecutive channels. Once a maser component was found, it was fitted to an elliptical Gaussian using the task JMFIT. The identified maser spots are shown as VLBI images in the following sections.
We also used the task FRMAP for fringe-rate mapping, from which we obtained the absolute coordinates of each source with an accuracy of 200 mas. The fringe-rate map was made for selected bright maser features in each source, and the coordinates were estimated from the average of multiple solutions. The absolute coordinates estimated by fringe-rate mapping are shown in Table 3. Due to the extended north-south size of the synthesized beam for sources near the equator, nine sources suffered positional uncertainties of arcsec, and so were excluded. The positions of the other four sources were not determined mainly due to the weak flux, and the sources are also excluded from Table 3.
| No. | G-Name | IRAS | Coordinates (J2000) | Ref. | ||||
| R.A. | Dec. | |||||||
| () | () | (km s-1) | (Jy) | (kpc) | ||||
| 1 | 000.5400.85 | 174702853 | 17 50 14.35 | 28 54 31.1 | 11.8 | 68 | 7.2 | cas10 |
| 2 | 000.6400.04 | 174412822 | 17 47 18.65 | 28 24 25.0 | 49.1 | 69 | 7.9† | cas10 |
| 3 | 002.5300.19 | 174762638 | 17 50 46.47 | 26 39 45.3 | 3.1 | 88 | 4.2 | cas10 |
| 4 | 006.1800.35 | 18 01 02.16 | 23 47 10.8 | 30.2 | 228.57 | 5.1 | gre10 | |
| 5 | 006.7900.25 | 175892312 | 18 01 57.75 | 23 12 34.9 | 16.3 | 91.07 | 3.8 | gre10 |
| 6 | 008.6800.36 | 180322137 | 18 06 23.49 | 21 37 10.2 | 43.2 | 102.0 | 4.5 | gre10 |
| 7 | 008.8300.02 | 180242119 | 18 05 25.67 | 21 19 25.1 | 3.8 | 159.08 | 5.2 | gre10 |
| 8 | 009.6100.19 | 180322032 | 18 06 14.92 | 20 31 44.3 | 5.5 | 70.00 | 5.2† | gre10 |
| 9 | 009.9800.02 | 180482019 | 18 07 50.12 | 20 18 56.5 | 42.2 | 67.58 | 12.0 | gre10 |
| 10 | 010.3200.16 | 180602005 | 18 09 01.46 | 20 05 07.8 | 11.5 | 90.05 | 2.39 | gre10 |
| 11 | 011.4901.48 | 181341942 | 18 16 22.13 | 19 41 27.1 | 6.6 | 68.40 | 1.6 | gre10 |
| 12 | 011.9000.14 | 180921842 | 18 12 11.44 | 18 41 28.6 | 42.9 | 64.89 | 4.0 | gre10 |
| 13 | 012.0200.03 | 180901832 | 18 12 01.86 | 18 31 55.7 | 108.3 | 96.26 | 11.1 | gre10 |
| 14 | 012.6800.18 | 18 13 54.75 | 18 01 46.6 | 57.5 | 544.0 | 2.40† | imm13 | |
| 15 | 012.8800.48 | 180891732 | 18 11 51.40 | 17 31 29.6 | 39.3 | 68.88 | 2.34† | gre10 |
| 16 | 014.1000.08 | 181281640 | 18 15 45.81 | 16 39 09.4 | 15.4 | 87.26 | 5.4 | gre10 |
| 17 | 020.2300.06 | 182491116 | 18 27 44.56 | 11 14 54.2 | 71.8 | 77 | 4.4 | cas09 |
| 18 | 023.4300.18 | 183190834 | 18 34 39.25 | 08 31 38.5 | 103 | 45 | 5.9† | cas09 |
| 19 | 025.6501.05 | 183160602 | 18 34 20.91 | 05 59 40.5 | 41.9 | 178 | 12.5 | xu09 |
| 20 | 025.7100.04 | 183530628 | 18 38 03.15 | 06 24 15.0 | 92.8 | 364 | 11.8 | xu09 |
| 21 | 025.8200.17 | 183610627 | 18 39 03.63 | 06 24 09.5 | 91.2 | 70 | 5.0 | xu09 |
| 22 | 028.8300.25 | 184210348 | 18 44 51.08 | 03 45 48.5 | 83.5 | 73 | 4.6 | cyg09 |
| 23 | 029.8600.04 | 18 45 59.57 | 02 45 04.4 | 101.4 | 67 | 9.3 | xu09 | |
| 24 | 030.7000.06 | 184500205 | 18 47 36.9 | 02 01 05 | 88 | 87 | 5.9 | xu09 |
| 25 | 030.7600.05 | 184500200 | 18 47 39.73 | 01 57 22.0 | 92 | 68 | 4.8 | xu09 |
| 26 | 030.9100.14 | 184480146 | 18 47 15.0 | 01 44 07 | 104 | 95.2 | 5.6 | xu09 |
| 27 | 031.2800.06 | 184560129 | 18 48 12.39 | 01 26 22.6 | 110 | 71 | 5.8 | xu09 |
| 28 | 032.0300.06 | 184700049 | 18 49 37.3 | 00 45 47 | 92.8 | 93 | 7.2 | xu09 |
| 29 | 037.4001.52 | 185170437 | 18 54 10.5 | 04 40 49 | 41.1 | 279 | 2.1 | xu09 |
| 30 | 049.4900.38 | 192131424 | 19 23 43.949 | 14 30 34.44 | 59.2 | 850 | 5.41† | xu09 |
| 31 | 232.6200.99 | 072991651 | 07 32 09.79 | 16 58 12.4 | 23 | 162 | 1.68† | cas09 |
| 32 | 351.7700.53 | 172333606 | 17 26 42.57 | 36 09 17.6 | 1.3 | 231 | 0.4 | cas10 |
| 33 | 352.6301.06 | 172783541 | 17 31 13.91 | 35 44 08.7 | 2.9 | 183 | 0.9 | cas10 |
| 34 | 353.4100.36 | 172713439 | 17 30 26.18 | 34 41 45.6 | 20.3 | 116 | 3.8 | cas10 |
| 35 | 354.6100.47 | 172693312 | 17 30 17.13 | 33 13 55.1 | 24.4 | 166 | 3.8 | cas10 |
| 36 | 359.4300.10 | 17 44 40.60 | 29 28 16.0 | 47.8 | 73.50 | 8.2 | cas10 | |
|
Column 1: ID number;
Columns 2, 3: Galactic and IRAS names (if any), respectively;
Columns 4, 5: Absolute coordinates (referenced in Column 9);
Columns 6, and 7: Radial velocity and peak flux density of the brightest maser feature, respectively;
Column 8: Source distance (referenced in section 4);
Column 9: Absolute coordinate reference.
Reference – cas09: Caswell (2009); cyg09: Cyganowski et al. (2009); xu09: Xu et al. (2009b); cas10: Caswell et al. (2010); gre10: Green et al. (2010); imm13: Immer et al. (2013). : distances determined by trigonometric parallax. |
||||||||
| Session | Date | Time | Telescopes∗ |
| (y/m/d) | (UT) | ||
| 1 | 2010/08/28 | 07:00-16:00 | M, R, O, I, H, S |
| 2 | 2010/08/29 | 07:00-28:00 | M, R, O, I, H, S |
| 3 | 2010/08/30 | 08:00-17:00 | M, R, O, I, H |
| 4 | 2011/10/27 | 03:00-10:00 | M, R, O, I, Y, H |
| 5 | 2011/10/28 | 03:00-10:00 | M, R, O, I, Y, H, S |
| 6 | 2011/11/26 | 01:30-09:00 | M, R, O, I, Y, U, H, S |
| : M: Mizusawa, R: Iriki, O: Ogasawara, I: Ishigaki, Y: Yamaguchi, U: Usuda, H: Hitachi, S: Shanghai25. | |||
3 Results
The spatial distributions of the 6.7 GHz methanol maser spots were successfully obtained for all sources except 014.1000.08, whose fringe was detected only in the MizusawaHitachi baseline. Among the 35 VLBI images, 33 were obtained for the first time. This study has increased the number of reported VLBI images of 6.7 GHz methanol masers by a factor of 1.5.
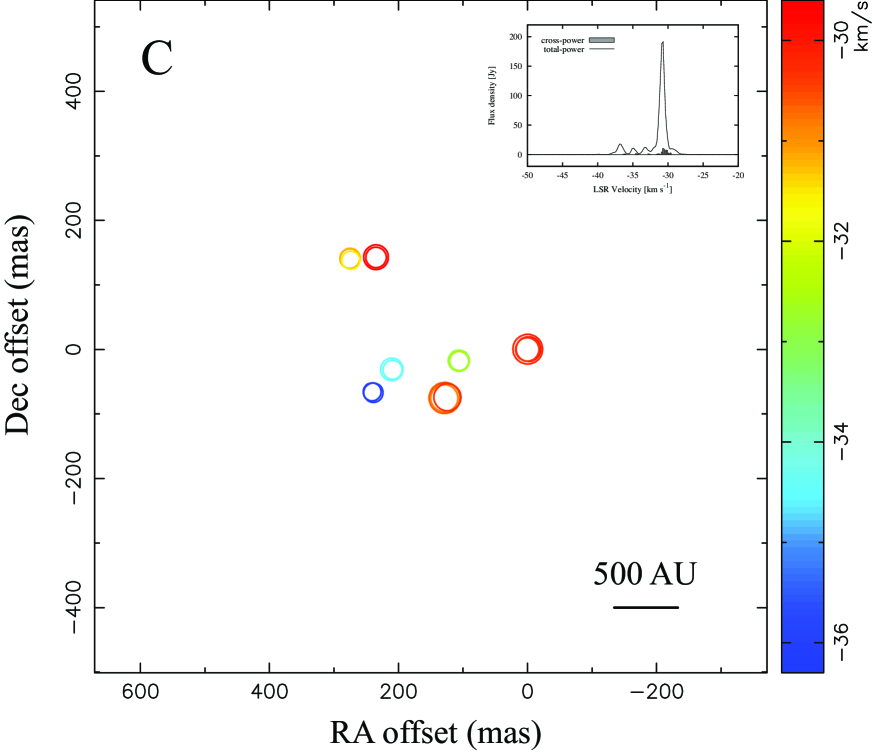
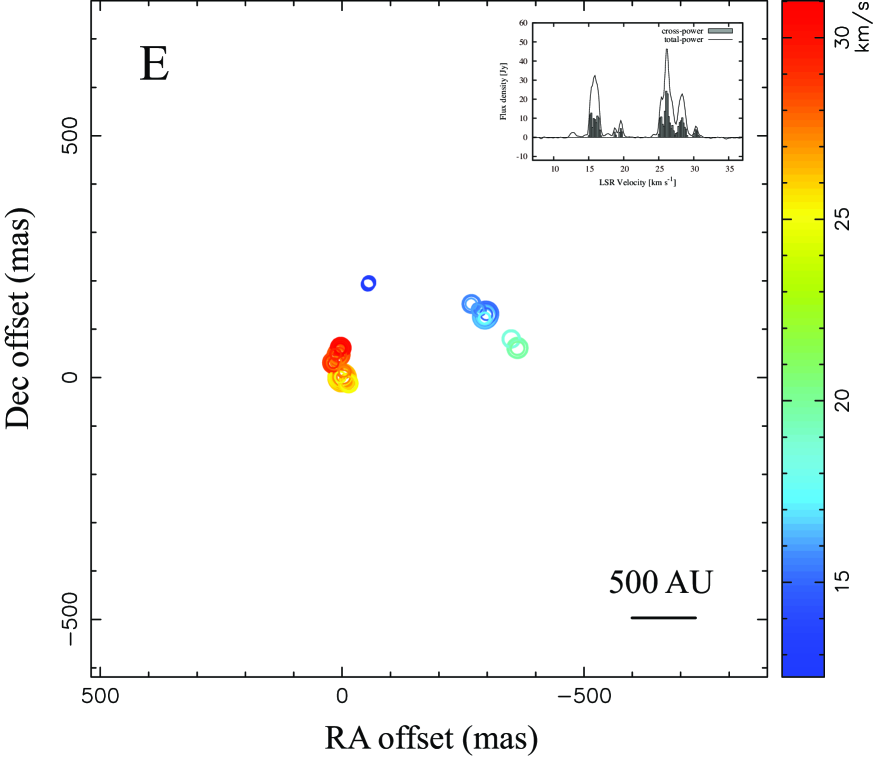
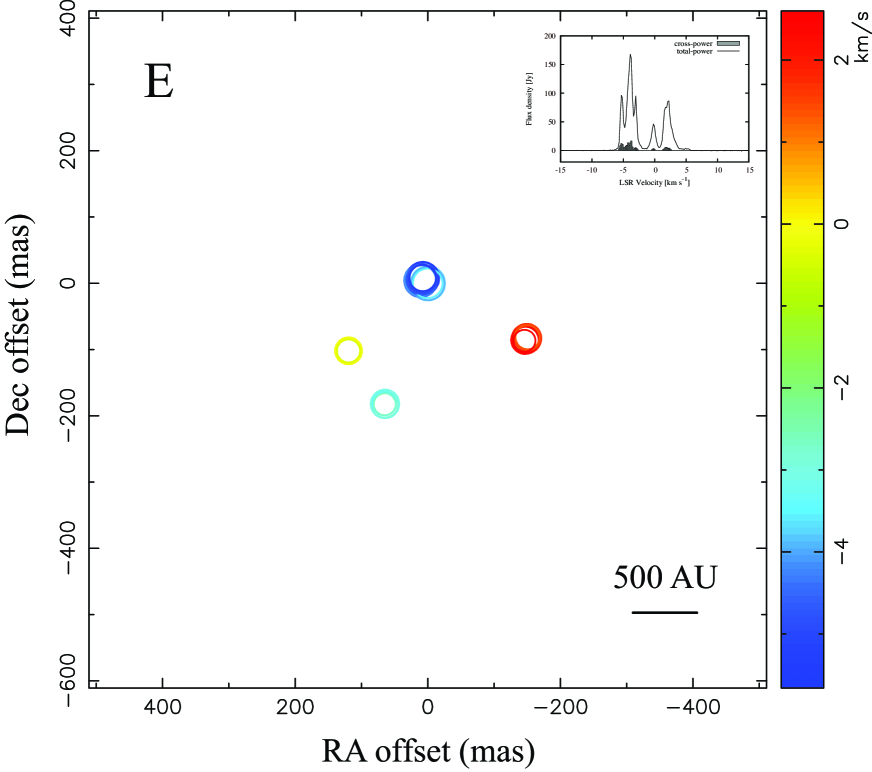
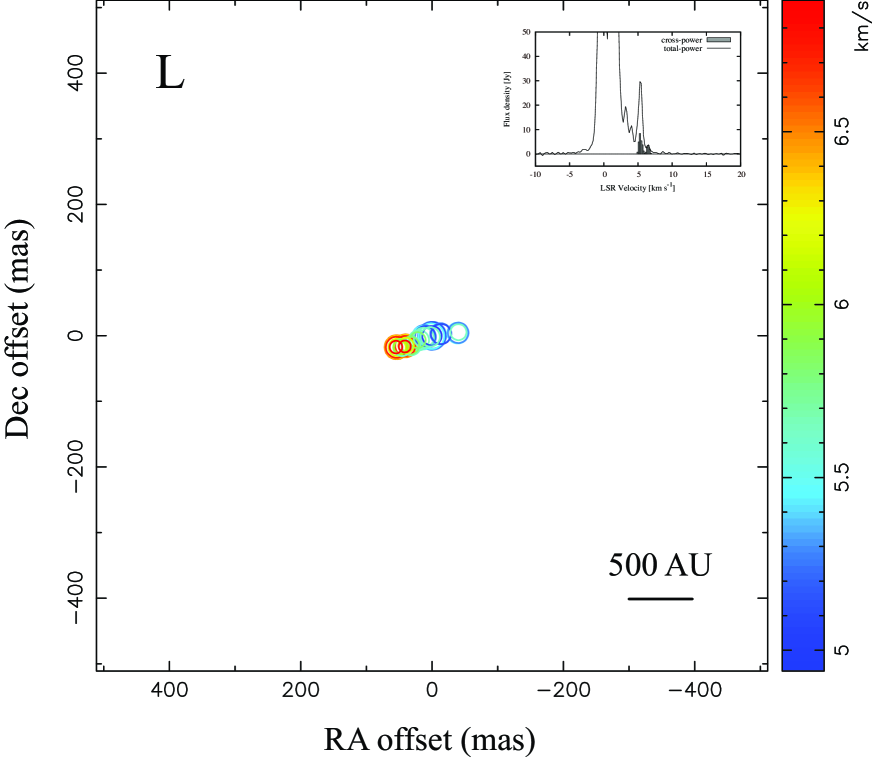
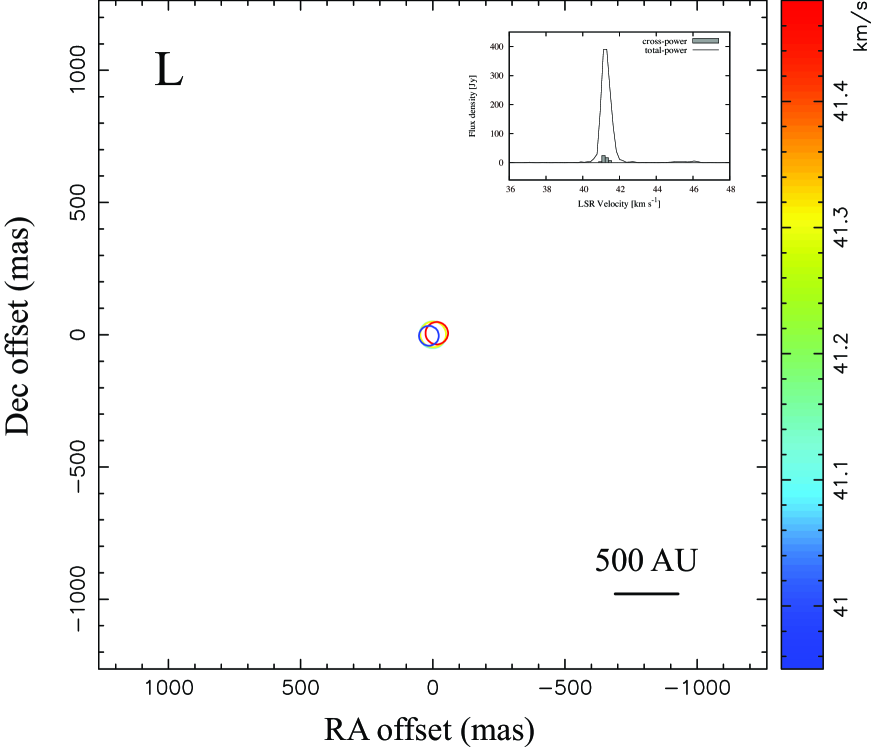
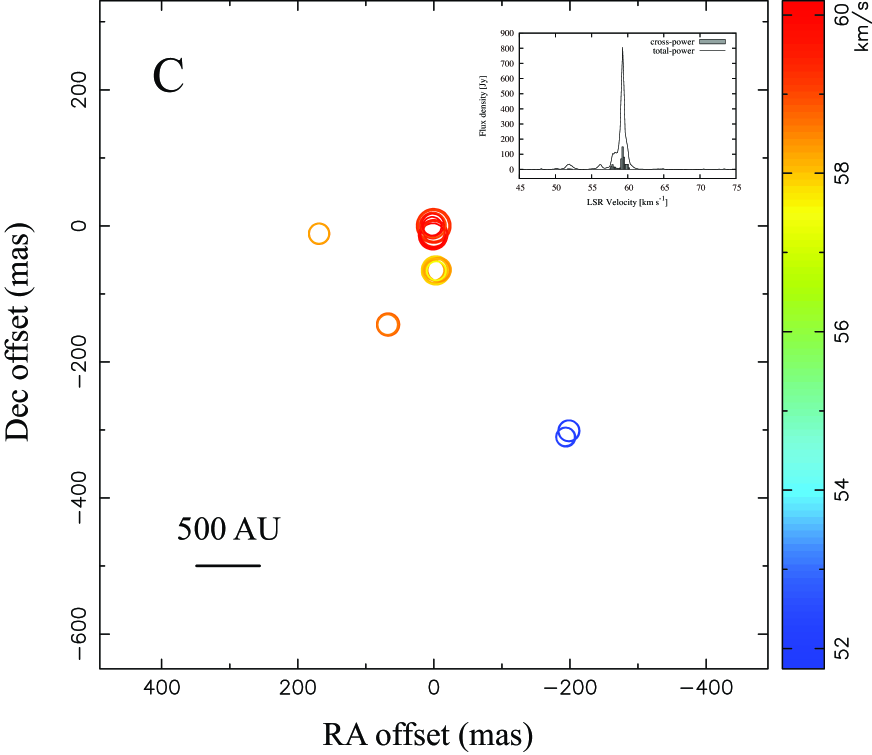
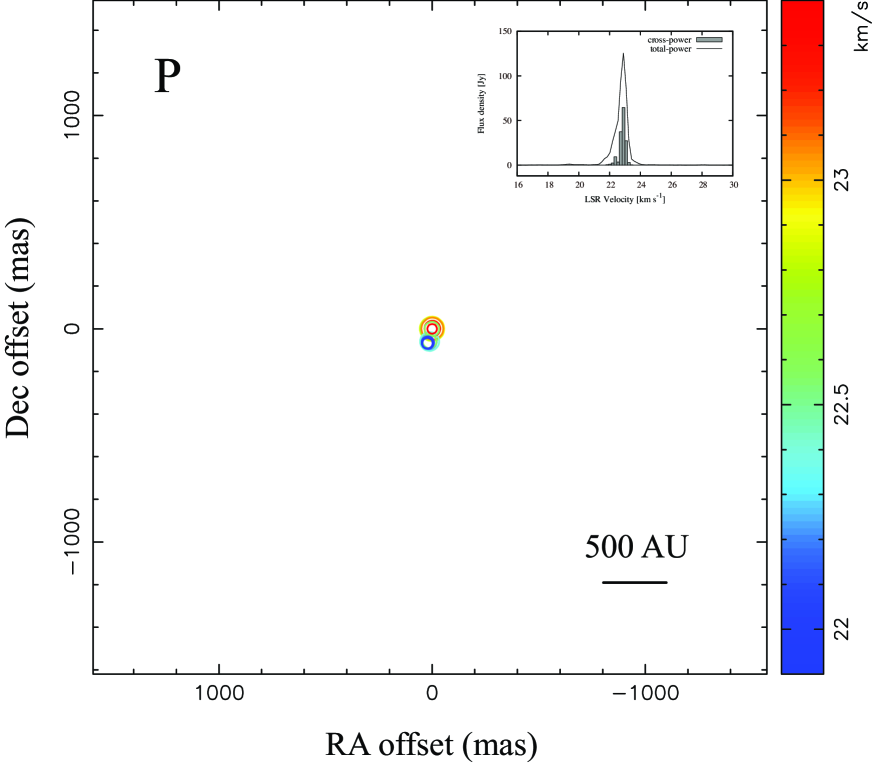
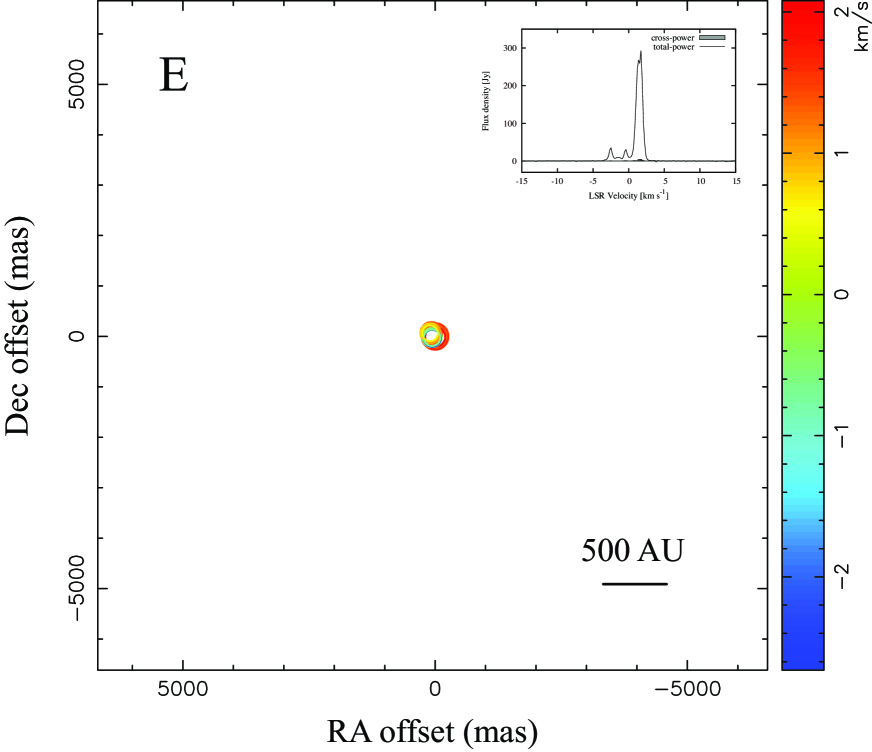
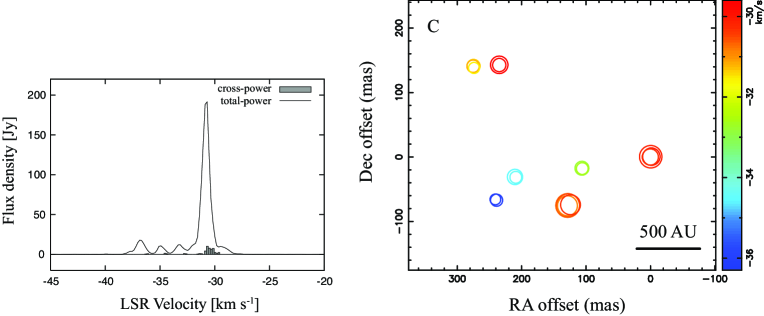
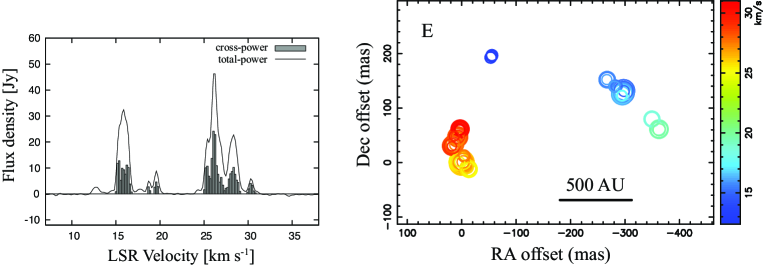
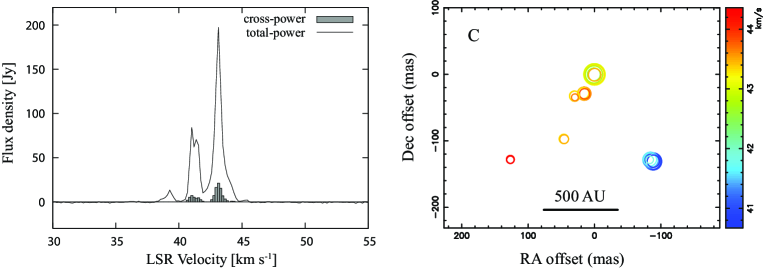
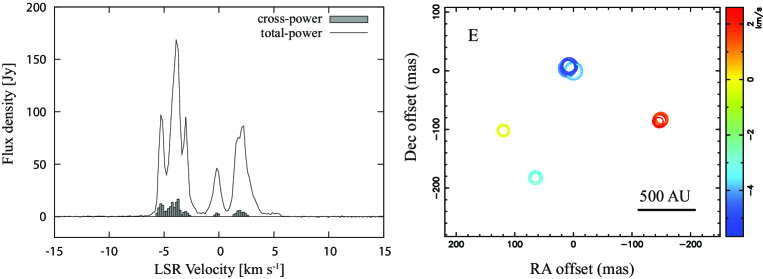
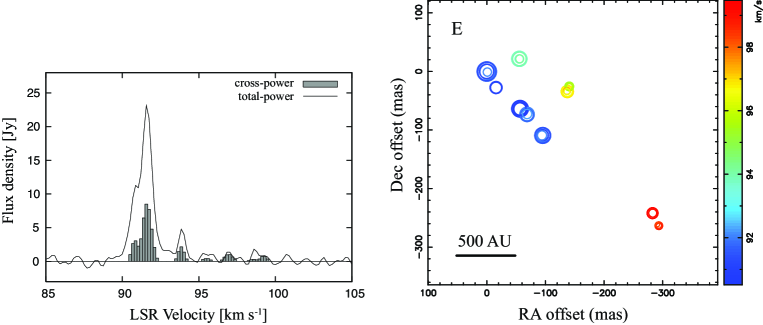
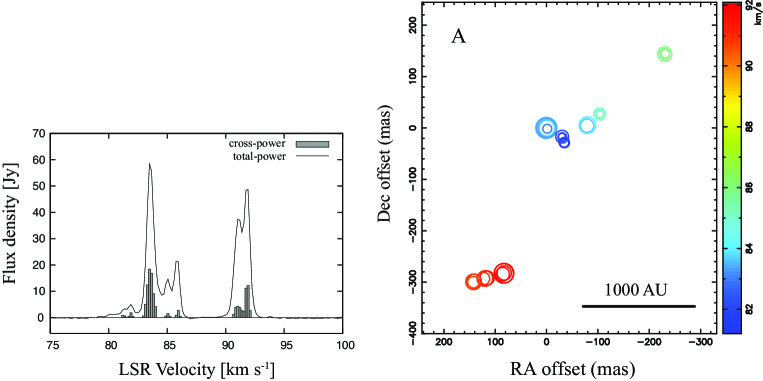
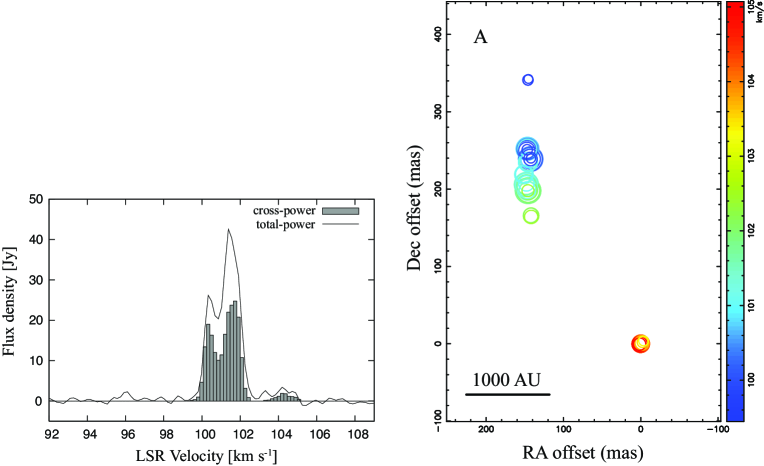
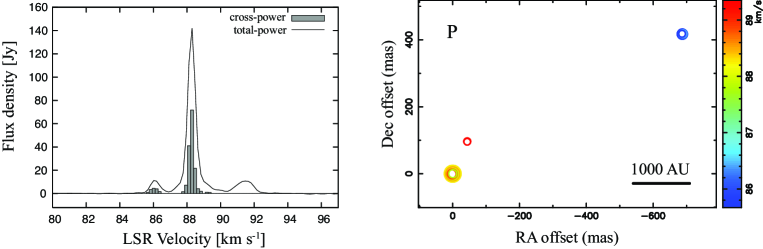
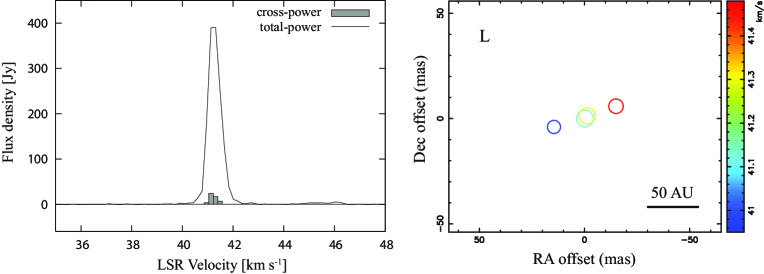
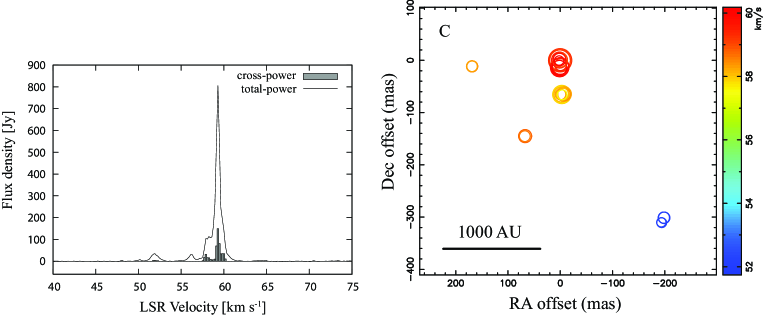
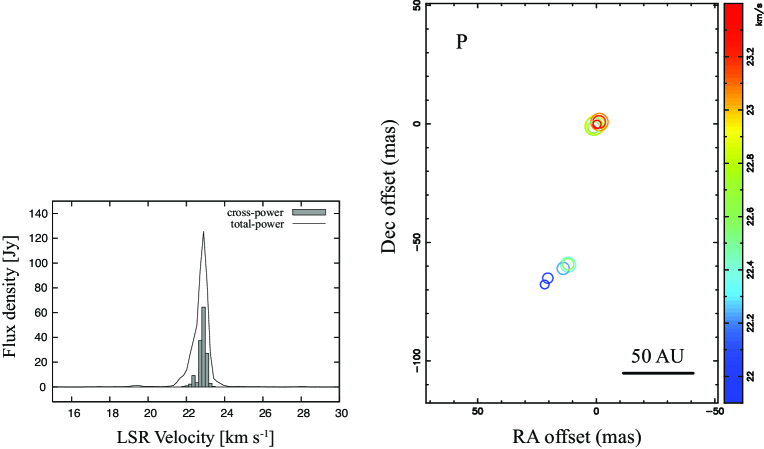
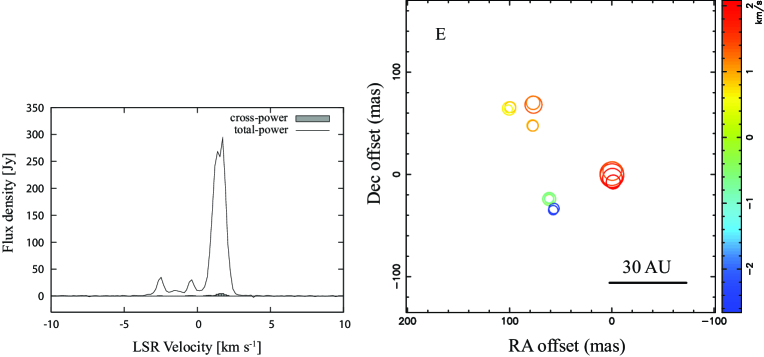
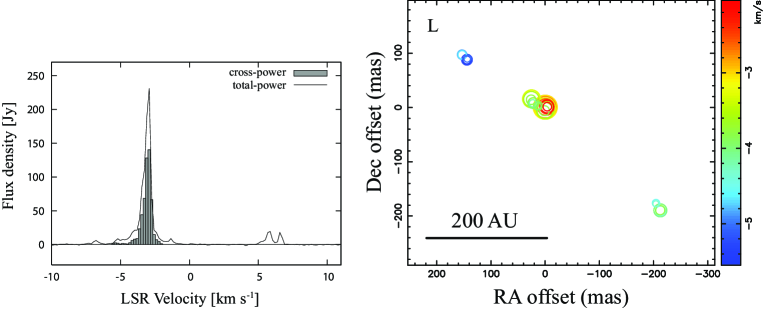
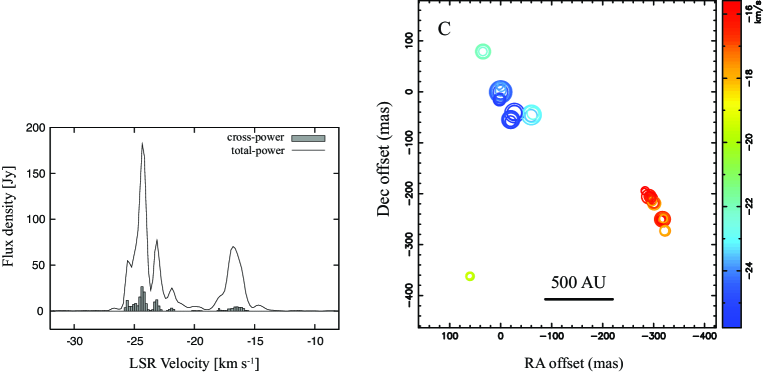
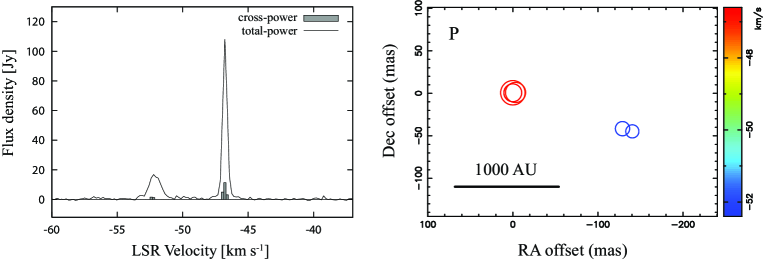
The VLBI images of the 35 sources in addition to their spectra are shown in Figures 2-36. In the source spectra, the solid line and hatched box represent the total- (autocorrelation of the Hitachi 32 m data) and cross-power spectra (integrated over all baselines), respectively. The spot sizes in the VLBI images indicate the peak intensity of the spots on the logarithmic scale. Radial velocities are indicated by the color index of the color bar displayed to the right of each figure. The origin of each map is the absolute source coordinates listed in Table 3. The spatial scale bar is displayed at the bottom corner of each figure.
Besides the coordinates, Table 3 lists the following observational parameters: the radial velocity and flux density of the peak maser spot, number of detected maser spots, spatial scale (in right ascension and declination coordinates), velocity range of the detected spectrum, morphological type, and integrated flux ratio of the correlated to the total-power spectrum of each source. As mentioned in the following subsection, we consider three sources contain two separated star-forming regions in each image, yielding 38 imaged sources. The number of detected spots in each source varies from 3 to 72, with 34 sources (89%) displaying larger than or equal to 10 spots. The spatial scale of the maser distribution is from 9 to 4900 astronomical units (AU).
Following Bartkiewicz et al. (2009), we classified the observed morphologies into the following five types: Elliptical, Arched, Linear, Paired, and Complex, as shown in Table 3. Since the classification was performed by eye, it is not strict, but provides an indication of the morphological structure. In the classification process, we only used the spatial distribution of the spots, the velocity distribution was not considered. The classification process is as follows: First, we recognized that almost all spots form small clusters, where we define a cluster here as a spot group including one or more spots, and the size is roughly one tenth of the total extent. When only two clusters exist in a source, the source is classified as Paired. When three or more clusters exist and all of them are successively and linearly distributed, the source is Linear. When three or more clusters exist and all are distributed successively, but loosely curved ( degree), the source is Arched. When four or more clusters exist and all are applicable to an ellipse, the source is Elliptical. The remaining sources are classified as Complex.
| No. | Source | Session | Coordinates (J2000.0) | Scale | Spatial | ||||||
| RA | Dec | Morph. | |||||||||
| () | () | (km s-1) | (Jy) | (AU2) | (km s-1) | (%) | |||||
| 1 | 000.5400.85 NW | 4 | 17 50 14.38 | 28 54 28.9 | 8.7 | 0.5 | 3 | 9 3 | [8.5, 8.9] | C | 14 |
| 000.5400.85 SE | 17 50 14.56 | 28 54 31.4 | 13.3 | 63.2 | 55 | 3900 4500 | [10.8, 19.6] | E | 35 | ||
| 2 | 000.6400.04 | 5 | 17 47 18.69 | 28 24 25.3 | 49.6 | 6.1 | 17 | 1300 760 | [48.2, 52.4] | C | 11 |
| 3 | 002.5300.19† | 3 | 3.4 | 7.8 | 34 | 750 2100 | [3.0, 19.0] | E | 12 | ||
| 4 | 006.1800.35 | 2 | 18 01 02.17 | 23 47 10.8 | 30.2 | 7.5 | 18 | 1400 1100 | [36.3, 29.6] | C | 4 |
| 5 | 006.7900.25 | 2 | 18 01 57.76 | 23 12 34.2 | 26.1 | 24.2 | 72 | 1400 640 | [15.0, 30.8] | E | 36 |
| 6 | 008.6800.36 | 1 | 18 06 23.48 | 21 37 10.4 | 43.1 | 21.1 | 25 | 970 590 | [40.7, 44.4] | C | 9 |
| 7 | 008.8300.02 | 1 | 18 05 25.66 | 21 19 25.4 | 3.7 | 16.7 | 29 | 1400 990 | [5.7, 2.6] | E | 7 |
| 8 | 009.6100.19 | 6 | 18 06 14.91 | 20 31 43.4 | 5.5 | 8.3 | 31 | 490 120 | [4.9, 6.9] | L | 22 |
| 9 | 009.9800.02 | 6 | 18 07 50.12 | 20 18 56.5 | 42.4 | 18.9 | 58 | 3000 1600 | [40.7, 50.7] | C | 32 |
| 10 | 010.3200.16 | 4 | 18 09 01.47 | 20 05 07.8 | 11.6 | 21.1 | 22 | 490 620 | [4.1, 14.2] | C | 19 |
| 11 | 011.4901.48 | 4 | 18 16 22.13 | 19 41 27.2 | 6.3 | 28.8 | 68 | 290 710 | [4.5, 17.1] | C | 42 |
| 12 | 011.9000.14 | 4 | 18 12 11.45 | 18 41 28.8 | 43.1 | 38.3 | 29 | 1300 480 | [39.6, 44.2] | P | 41 |
| 13 | 012.0200.03 | 3 | 18 12 01.86 | 18 31 55.9 | 108.3 | 22.8 | 25 | 520 1200 | [107.1, 109.0] | A | 18 |
| 14 | 012.6800.18† | 3 | 58.4 | 11.5 | 20 | 310 650 | [52.0, 60.1] | C | 1 | ||
| 15 | 012.8800.48 | 5 | 18 11 51.39 | 17 31 30.1 | 39.2 | 18.0 | 67 | 2600 3800 | [29.9, 40.1] | C | 21 |
| 16 | 014.1000.08† | 5 | |||||||||
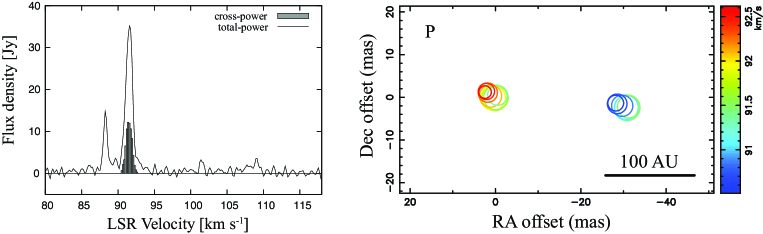
| 17 | 020.2300.06 SW | 5 | 18 27 44.56 | 11 14 54.1 | 71.5 | 3.2 | 12 | 160 280 | [71.1, 73.6] | P | 14 |
| 020.2300.06 NE | 18 27 44.95 | 11 14 47.8 | 60.9 | 1.1 | 14 | 100 10 | [60.2, 71.1] | A | 24 | ||
| 18 | 023.4300.18 MM1 | 1 | 18 34 39.19 | 08 31 25.3 | 96.6 | 5.0 | 10 | 110 110 | [96.3, 98.4] | C | 7 |
| 023.4300.18 MM2 | 18 34 39.27 | 08 31 39.3 | 103.0 | 8.1 | 28 | 1600 550 | [101.4, 107.9] | P | 6 | ||
| 19 | 025.6501.05∗ | 1 | 41.8 | 26.3 | 8 | 90 20 | [41.5, 42.2] | L | 15 | ||
| 20 | 025.7100.04 | 1 | 18 38 03.15 | 06 24 15.0 | 95.5 | 34.1 | 13 | 930 1500 | [89.8, 96.2] | C | 4 |
| 21 | 025.8200.17 | 6 | 18 39 03.63 | 06 24 09.9 | 91.6 | 8.2 | 53 | 1500 1500 | [90.5, 99.5] | E | 29 |
| 22 | 028.8300.25∗ | 2 | 83.5 | 18.4 | 30 | 1700 2000 | [81.2, 92.1] | A | 15 | ||
| 23 | 029.8600.04∗ | 6 | 101.7 | 22.1 | 53 | 1400 3200 | [99.5, 105.1] | A | 56 | ||
| 24 | 030.7000.06∗ | 2 | 88.3 | 71.7 | 14 | 4100 2500 | [85.7, 89.4] | P | 28 | ||
| 25 | 030.7600.05∗ | 5 | 91.7 | 10.6 | 15 | 160 20 | [90.5, 92.6] | P | 29 | ||
| 26 | 030.9100.14∗ | 2 | 101.9 | 3.5 | 10 | 150 320 | [100.1, 103.0] | L | 2 | ||
| 27 | 031.2800.06∗ | 4 | 110.5 | 8.2 | 38 | 3300 2700 | [104.3, 112.4] | C | 11 | ||
| 28 | 032.0300.06∗ | 3 | 92.7 | 27.8 | 28 | 2100 3100 | [92.1, 101.4] | P | 25 | ||
| 29 | 037.4001.52∗ | 3 | 41.1 | 24.0 | 4 | 60 20 | [41.0, 41.5] | L | 4 | ||
| 30 | 049.4900.38 | 3 | 19 23 43.93 | 14 30 35.1 | 59.3 | 134.9 | 21 | 2000 1700 | [51.7, 60.2] | C | 13 |
| 31 | 232.6200.99 | 2 | 07 32 09.78 | 16 58 12.4 | 22.9 | 64.4 | 11 | 40 120 | [21.9, 23.4] | P | 29 |
| 32 | 351.7700.53 | 1 | 17 26 42.54 | 36 09 17.6 | 1.7 | 4.4 | 18 | 40 40 | [2.7, 2.1] | E | 1 |
| 33 | 352.6301.06 | 1 | 17 31 13.93 | 35 44 08.5 | 2.9 | 140.4 | 32 | 330 260 | [-5.6, -2.0] | L | 58 |
| 34 | 353.4100.36 | 2 | 17 30 26.18 | 34 41 45.6 | 20.5 | 72.7 | 16 | 220 460 | [21.5, 19.6] | C | 48 |
| 35 | 354.6100.47 | 2 | 17 30 17.09 | 33 13 55.0 | 24.4 | 26.5 | 63 | 1500 1700 | [25.8, 15.6] | C | 9 |
| 36 | 359.4300.10† | 3 | 46.8 | 11.2 | 5 | 1200 370 | [-52.4, -46.6] | P | 6 | ||
|
Column 1 – ID number (as listed in Table 1);
Column 2 – Source name;
Column 3 – Observational session (corresponding to the sessions listed in Table 2);
Columns 4, 5 – Absolute coordinates obtained by fringe-rate mapping
(for specified sources marked by asterisk or dagger, the absolute coordinates listed in Table 1 are listed here);
Columns 6, 7 – Radial velocity and flux density of the peak maser spot located at the origin of each map, respectively;
Column 8 – Number of detected maser spots;
Columns 9, and 10 – Spatial scale (in RA and Dec coordinates), and velocity range of the detected component, respectively;
Column 11 – Spatial morphology (E: Elliptical; A: Arched; L: Linear; P: Paired; C: Complex).
Column 12 – Ratio of integrated fluxes of correlated- to total-power spectra.
: sources not suitable for fringe-rate mapping because of the equatorial location. : sources not suitable for fringe-rate mapping because of the weak flux or resolved-out. |
|||||||||||

4 Comments on individual sources
000.5400.85
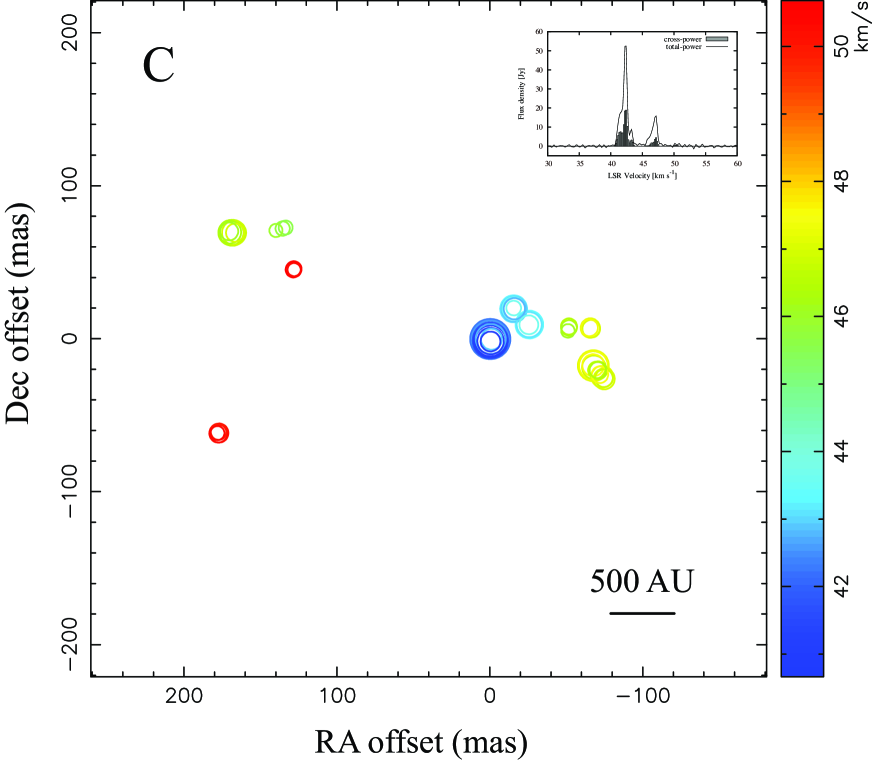
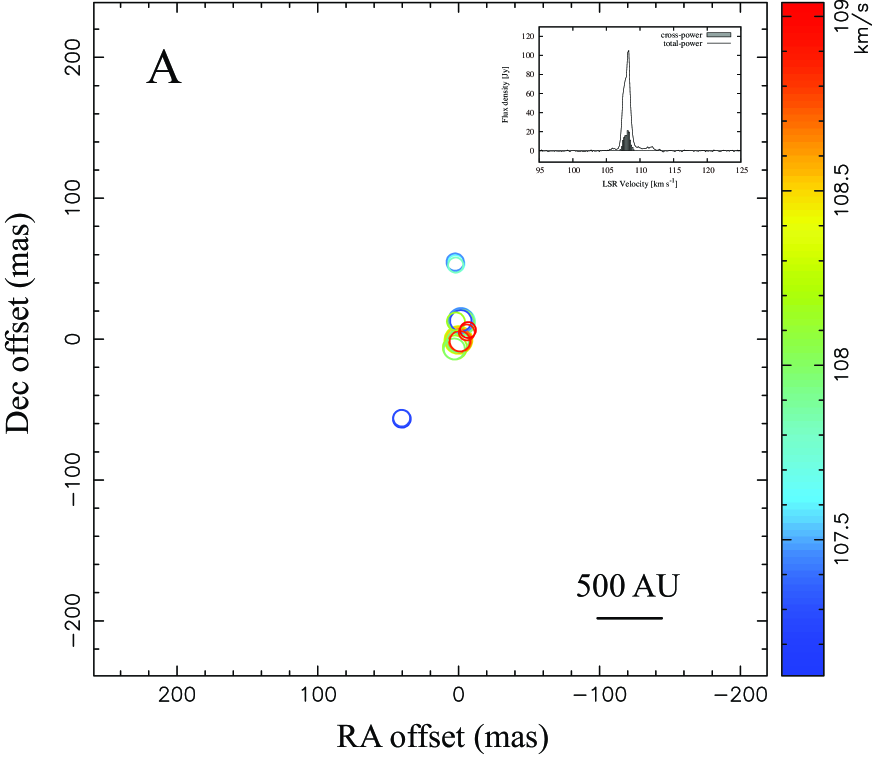
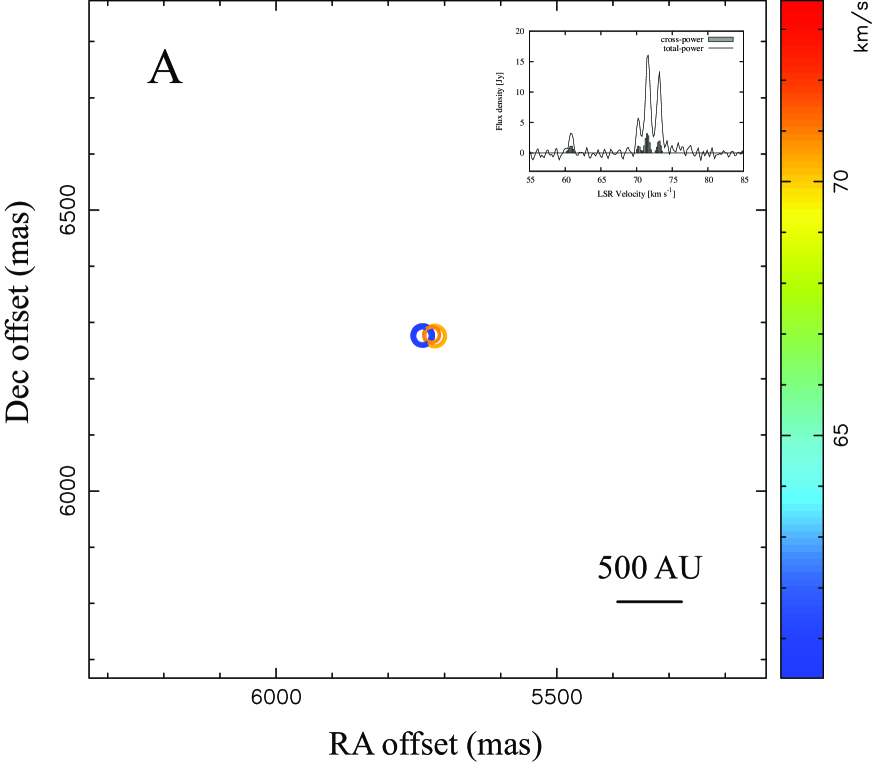
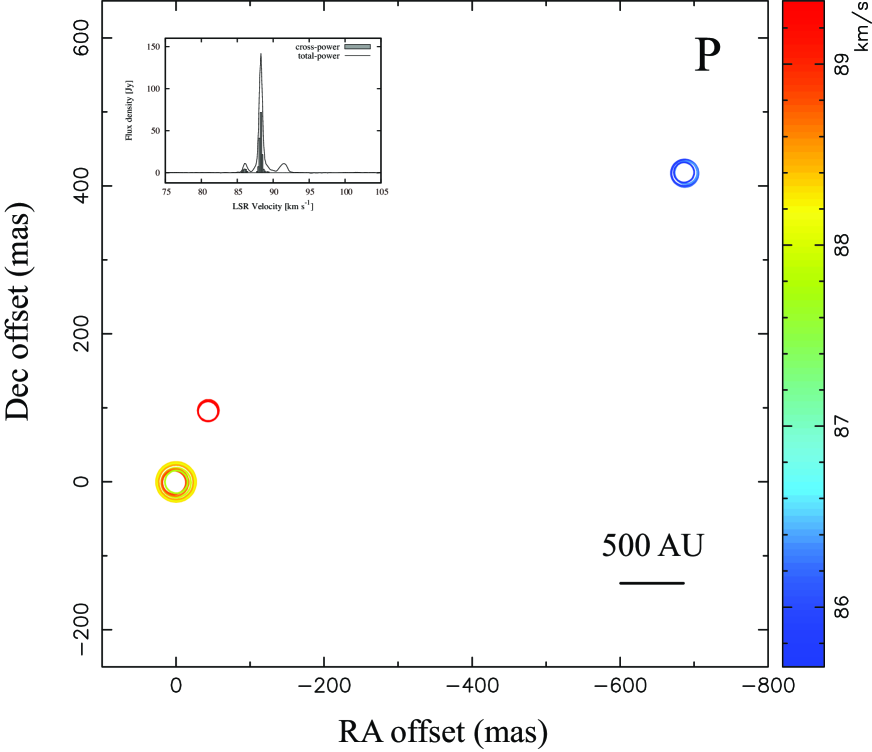
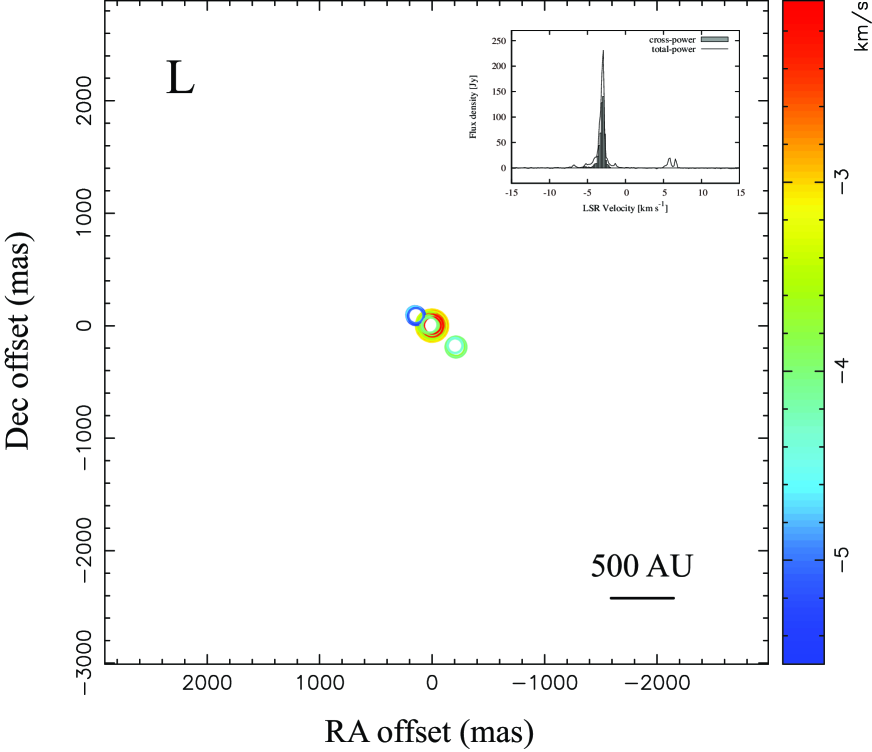
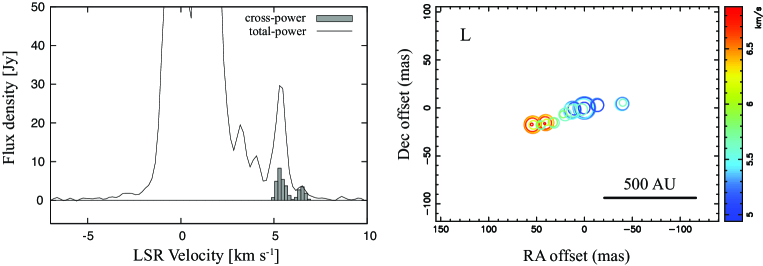
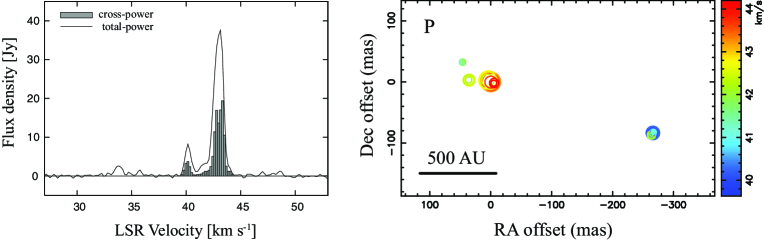
The main cluster (SE) of the 6.7 GHz methanol maser spots of this source are distributed over 540 mas 630 mas, corresponding to 3900 AU 4500 AU, at a near kinematic distance of 7.2 kpc (Figure 2). This source has the largest extention of 4900 AU of all imaged sources. The distance is determined from the radial velocity and the H\emissiontypeI self-absorption (H\emissiontypeISA) spectrum. Isolated spots (NW) located at 3 arcsec ( AU) northwest are probably associated with another excitation source. The distribution of the maser spots of the main cluster is Elliptical, having roughly circular morphology, while that of NW component is Complex. These maser spots correspond to spots labeled AL in the ATCA image (IRAS 174702853, Walsh et al. 1998), while the isolated spots in the EAVN image correspond to spot M in the ATCA image.
000.6400.04
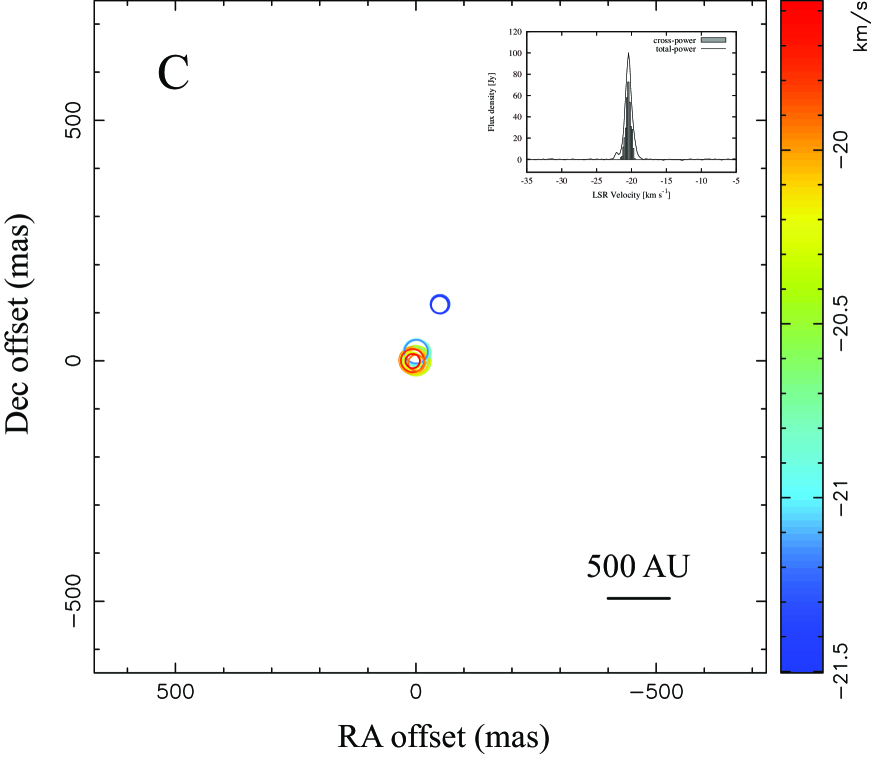
This source is associated with a famous high-mass star-forming region in the Galactic center Sgr B2 located at a trigonometric parallax distance of 7.9 kpc (Reid et al., 2009). The wide absorption trough in the spectrum is remarkable (Menten 1991). The methanol maser spots in this source show Complex spatial distribution over 170 mas 100 mas, corresponding to 1300 AU 760 AU at the source (Figure 3). These maser spots are extended roughly along the east-west direction, although the extension is not clearly linear. The ATCA image (IRAS 174412822, Walsh et al. 1998) extends along the northeast-southwest direction. Apart from the contradicting elongation direction, the EAVN and ATCA images display similar radial velocity gradient trends, from red-shifted at the east to blue-shifted at the west.
002.5300.19
The kinematic distance of this source is 4.2 kpc. Although the north-western part is missing, the spatial distribution is Elliptical (Figure 4). The maser spots are distributed over 180 mas 500 mas, corresponding to a linear area of 750 AU 2100 AU. The millimeter and submillimeter emissions have been previously detected at this maser position (Hill et al 2005; Walsh et al. 2003).
006.1800.35
This source locates at the same line of sight toward the W 28 supernova remnant field. The 6.7 GHz methanol maser source seems to be associated with one of several dense molecular cores previously identified in this region, namely, Core 3 (Nicholas et al. 2011). The radial velocity (33 km s-1) of Core 3 approximates that of the spectral peak of the methanol maser but differs largely from those of other molecular cores. Dame & Thaddeus (2008) suggested that this source locates in the galactic 3 kpc arm approximately 5 kpc from the Sun. Therefore, Core 3 (and hence the methanol maser source) is likely not connected to the gas associated with the W 28 field (Nicholas et al. 2011). We assumed a source distance of 5.1 kpc (Green & McClure-Griffiths 2011). The morphology is Complex (Figure 5). The maser spots are distributed over 280 mas 220 mas, corresponding to 1400 AU 1100 AU.
006.7900.25
This source also locates near the supernova remnant W 28 similar to 006.1800.35 and appears to be associated with Core 1, as defined by Nicholas et al. (2011). The radial velocity of 21 km s-1 of the ammonia line of Core 1 indicates a kinematic distance of 3.8 kpc, although the uncertainty is large. The spatial distribution of the masers is clearly Elliptical, with a clockwise radial velocity gradient (Figure 6). The size of this ellipse is 400 mas from east to west, corresponding to 1400 AU.
008.6800.36
This source locates at a distance of 4.5 kpc (Green & McClure-Griffiths 2011). The spatial distribution of the masers is Complex (Figure 7). The maser spots are distributed over 220 mas 130 mas, corresponding to 970 AU 590 AU. These maser spots coincide well with those labeled A-D in the ATCA image (IRAS 180322137; Walsh et al. 1998). The 6.7 GHz methanol masers are located at the center of the continuum emission and the foot-point of the 12CO () outflow (where the 12CO () and 1.2 mm continuum images were obtained by the SMA; Longmore et al. 2011). The 12CO () and 12CO () line profiles show prominent infall signatures (Ren et al. 2012). The methanol maser is associated with the weaker of two submillimeter continuum cores known to exist in this region (Walsh et al. 2003).
008.8300.02
This source locates at a distance of 5.2 kpc (Green & McClure-Griffiths 2011). The morphology is Elliptical but displays no simple velocity gradient (Figure 8). The maser spots are distributed over 270 mas 190 mas, corresponding to 1400 AU 990 AU.
009.61+00.19
Trigonometric parallax measurements established the distance of this source as 5.2 kpc (Sanna et al., 2009). Various H\emissiontypeII regions at different evolutionary phases exist in this region, labeled AE by Garay et al. (1993). Source 009.6100.19 is associated with D, the ultracompact H\emissiontypeII region. The other component E, located \timeform10” north of D, is a candidate hyper-compact H\emissiontypeII region (Kurtz & Franco, 2002), which is well known as the strongest 6.7 GHz methanol maser, G 9.6210.196. Within this complex region, we imaged only 009.6100.19, although the strongest emission in the peak total-power spectrum arises from G 9.6210.196. The EAVN image reveals a Linear distribution of the methanol maser spots, oriented toward the east-west direction with a linear velocity gradient (Figure 9). The scale distributed over 100 mas 20 mas, corresponding to 490 AU 120 AU at the source. Only two spots appear in the ATCA image (IRAS 180322032, Walsh et al. 1998; Phillips et al. (1998)).
009.9800.02
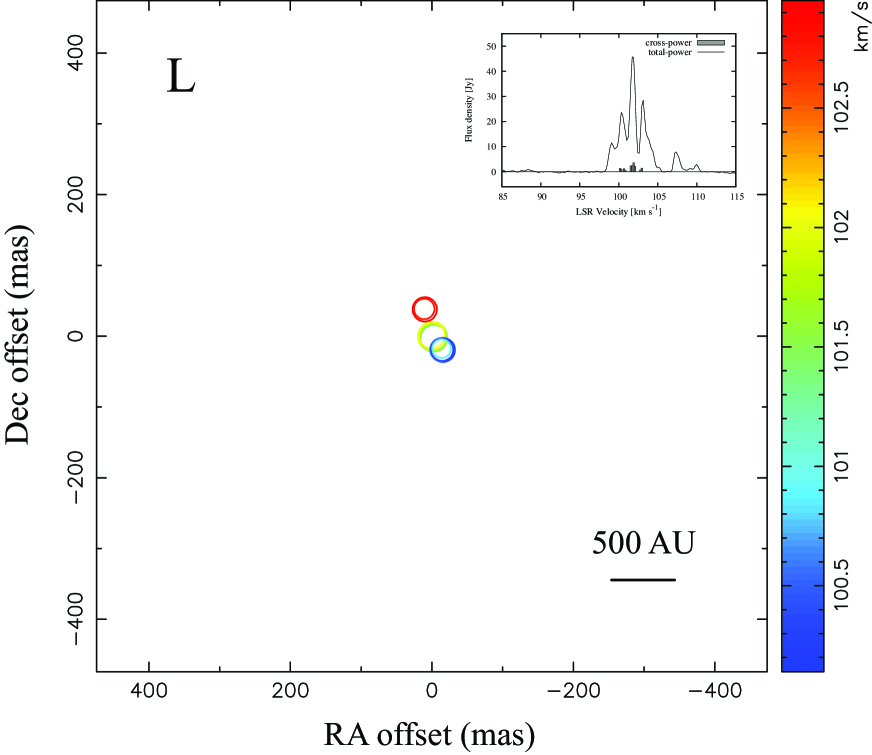
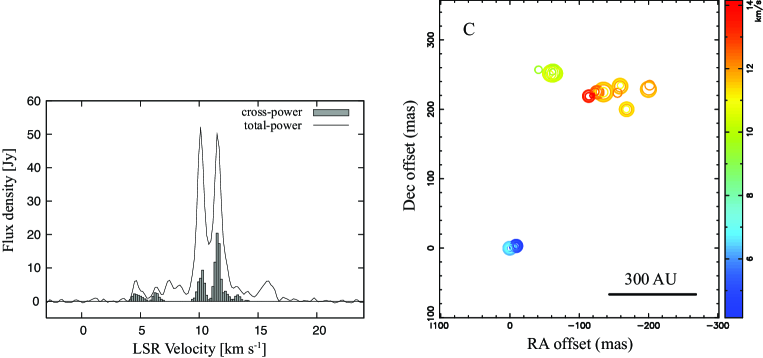
This source locates at a distance of 12.0 kpc (Green & McClure-Griffiths, 2011). The 6.7 GHz methanol maser spots show a Complex spatial distribution with no obvious trend in the velocity distribution (Figure 10). The scale coverage is 250 mas 130 mas, corresponding to 3000 AU 1600 AU at the source. The maser spots correspond to those labeled AF in the ATCA image (IRAS 180482019, Walsh et al. 1998). We detected new maser spots at km s-1, located at () = (130, 45) and (180, 60) mas from the brightest spot at the origin of the image. The flux density of these new spots is 1.5 Jy, which is similar to that observed in the single-dish spectrum obtained by Parkes 64 m (Green et al., 2010).
010.3200.16
The distance of this source is assumed as 2.39 kpc, the measured distance of W31 North (Moisés et al., 2011), with which it is associated. It should be noted that this source distance is disputed among the literatures (Green & McClure-Griffiths (2011), references therein). The 6.7 GHz methanol maser spots show Complex spatial distribution over 200 mas 260 mas, corresponding to 490 AU 620 AU at the source (Figure 11). The maser spots clustered in the northern part of the image correspond to those labeled EH in the ATCA image (IRAS 180602005, Walsh et al. 1998). We detected new maser spots at km s-1, located 220 mas south from the main cluster. The origin of the image is not coincide with the position of the strongest component, but a relatively strong, compact component at km s-1 is selected for the origin of the image.
011.4901.48
This source displays Complex spatial and velocity distributions of its methanol masers (Figure 12). The overall distribution is elongated along the north-south direction over 180 mas 440 mas, corresponding to 290 AU 710 AU at a kinematic distance of 1.6 kpc. These maser spots coincide with those labeled AM in the ATCA image (IRAS 181341942, Walsh et al. 1998). New maser spots at and 6.937.63 km s-1 are detected at () = (18, 409) and (40, 360) mas from the brightest spot, respectively.
011.9000.14
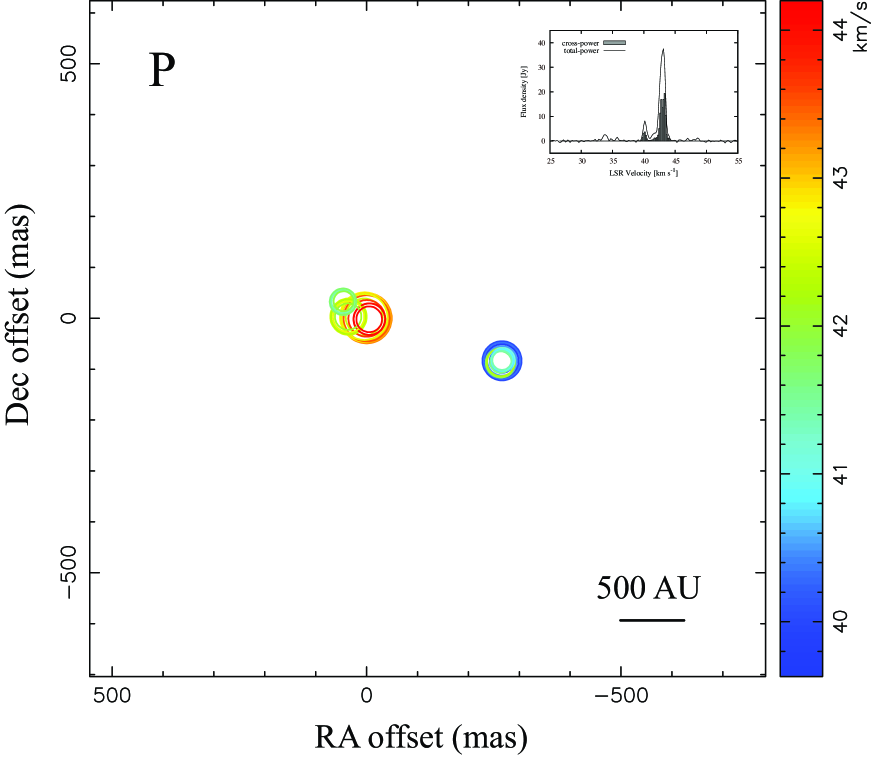
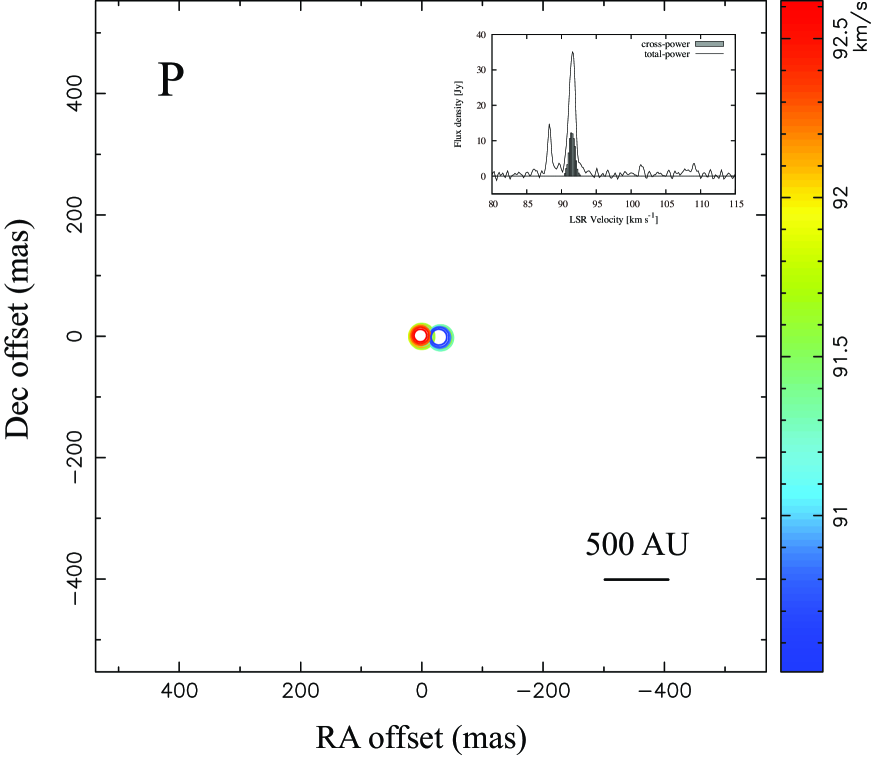
The observed maser spots of this source display a Paired distribution (Figure 13), dividing into two spatially discrete clusters separated by 340 mas, corresponding to 1300 AU at a near kinematic distance of 4.0 kpc (Green & McClure-Griffiths, 2011).
012.0200.03
This source locates at a distance of 11.1 kpc (Green & McClure-Griffiths 2011). The maser spots show an Arched spatial distribution over 50 mas 110 mas, corresponding to 520 AU 1200 AU (Figure 14). A single maser spot was detected in the ATCA image (IRAS 180901832; Walsh et al. 1998), associated with the denser of two submillimeter continuum cores known to exist in this region (Walsh et al. 2003).
012.6800.18
This source, associated with W33B, is located at 2.40 kpc, determined from trigonometric parallax measurements of 22 GHz water masers (Immer et al. 2013). Although the maser spots are roughly distributed along the northwest-southeast direction, we classified the morphology of this source as Complex (Figure 15). The masers are distributed over 130 mas 270 mas, corresponding to 310 AU 650 AU. The associated submillimeter continuum emission is extended along the northeast-southwest direction, perpendicular to the methanol maser distribution (Walsh et al. 2003).
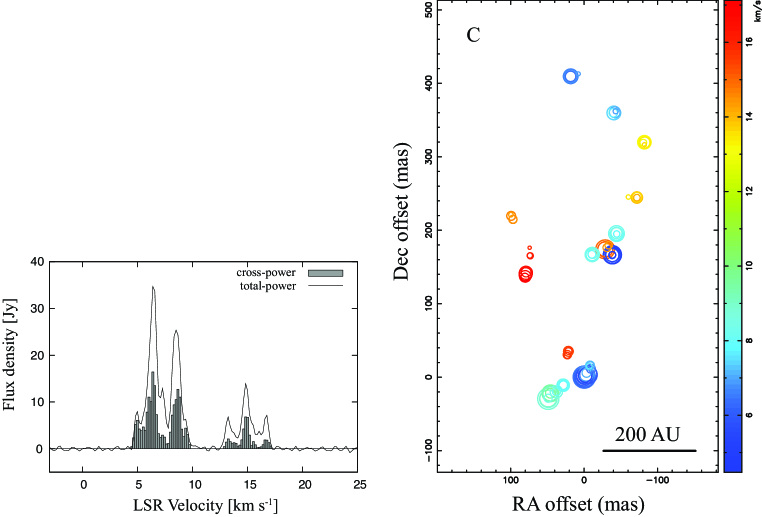
012.88+00.48
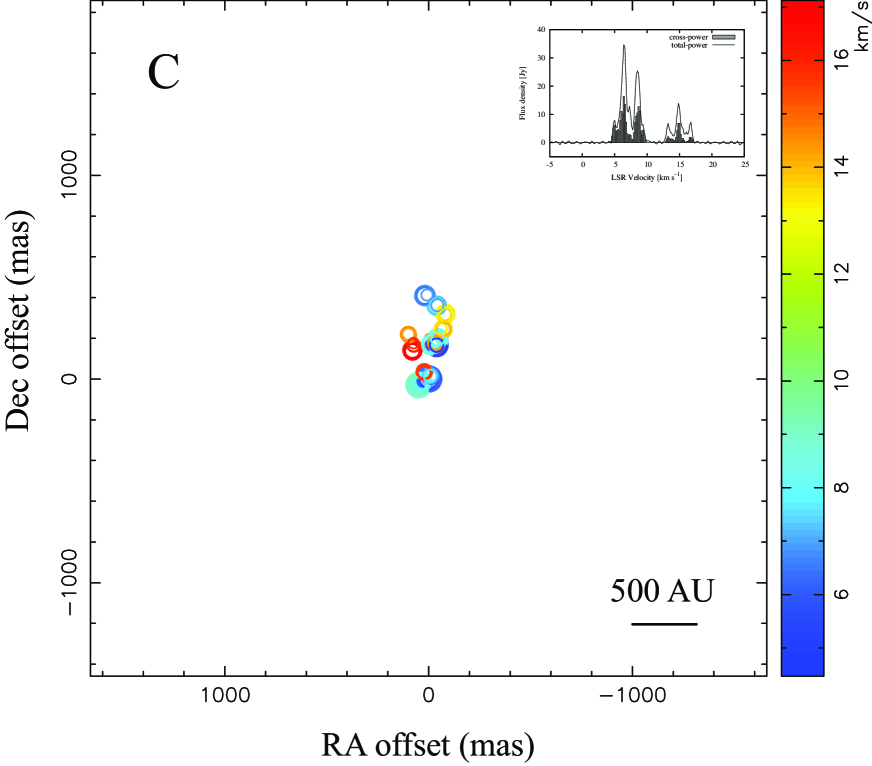
This source locates at the trigonometric parallax distance of 2.34 kpc (Xu et al., 2011). The flux of its methanol maser is known to show a periodic variation with a period of 29.5 days (Goedhart et al., 2009). The 6.7 GHz methanol maser spots are distributed as a main cluster and two separated clusters, constituting Complex morphology (Figure 16). The main cluster is seen in the ATCA image (IRAS 180891732, Walsh et al. 1998) as AE, H, and J. The cluster located at 1.5 arcsec in the northeast direction corresponds to spot F in the ATCA image. While spot G in the ATCA image is absent, EAVN detected new maser spots at 1.9 arcsec northeast from the main cluster, whose km s-1. Additional new maser spots, with km s-1, appear around the origin. The masers are distributed over 1100 mas 1600 mas, corresponding to 2600 AU 3800 AU.
014.10+00.08
This source locates at a distance of 5.4 kpc (Green & McClure-Griffiths 2011). As mentioned in Section 3, 014.1000.08 was detected only by a short baseline between MizusawaHitachi. Therefore, an image of this source is not made.
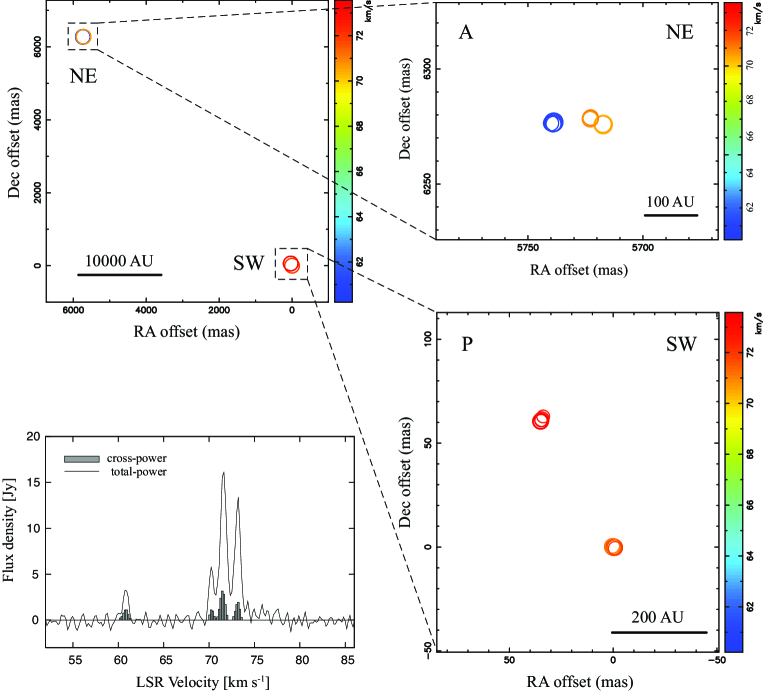
020.23+00.06
This source locates at a kinematic distance of 4.4 kpc (Green & McClure-Griffiths, 2011). Two isolated maser clusters are separated by 8.5 arcsec (equivalently, by AU, Figure 17). The maser spots in each cluster are probably excited by different high-mass YSOs. In the southwestern maser cluster (SW), two isolated clusters are separated by 70 mas (320 AU) at the source. Therefore, the morphology of this cluster is Paired. The velocities of maser spots in the northeastern maser cluster (NE) vary widely (by 11 km s-1), although the spatial coverage is only 100 AU. The morphology of this cluster is Arched.
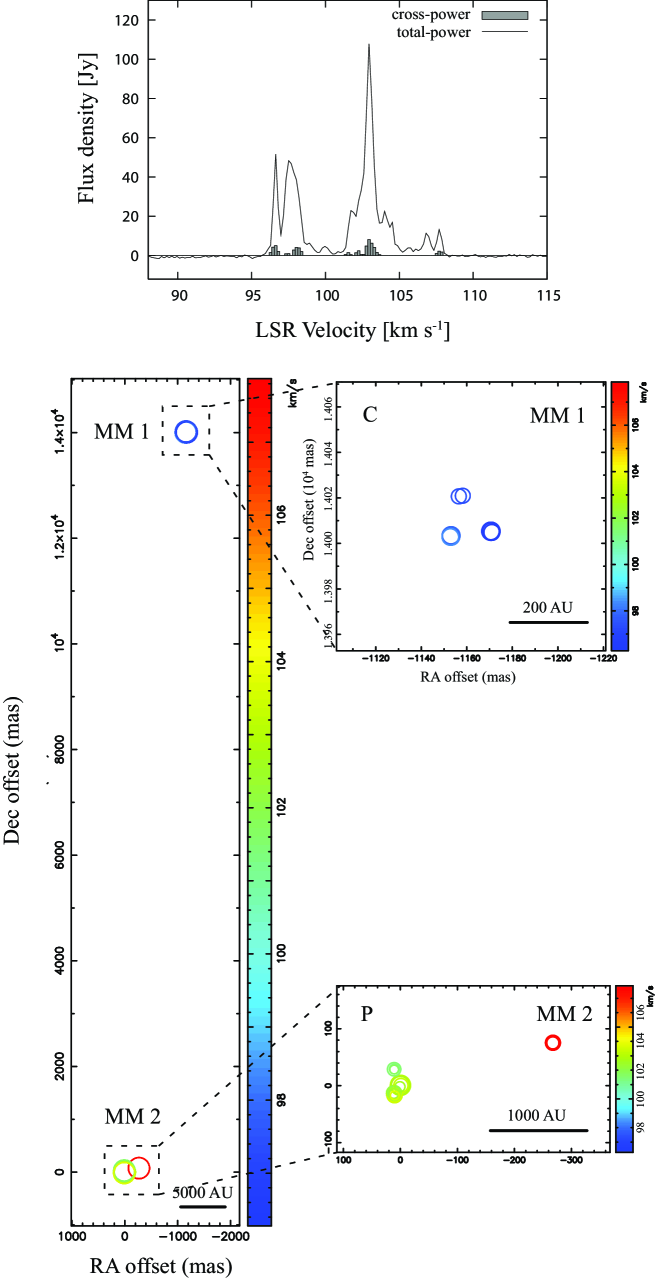
023.4300.18
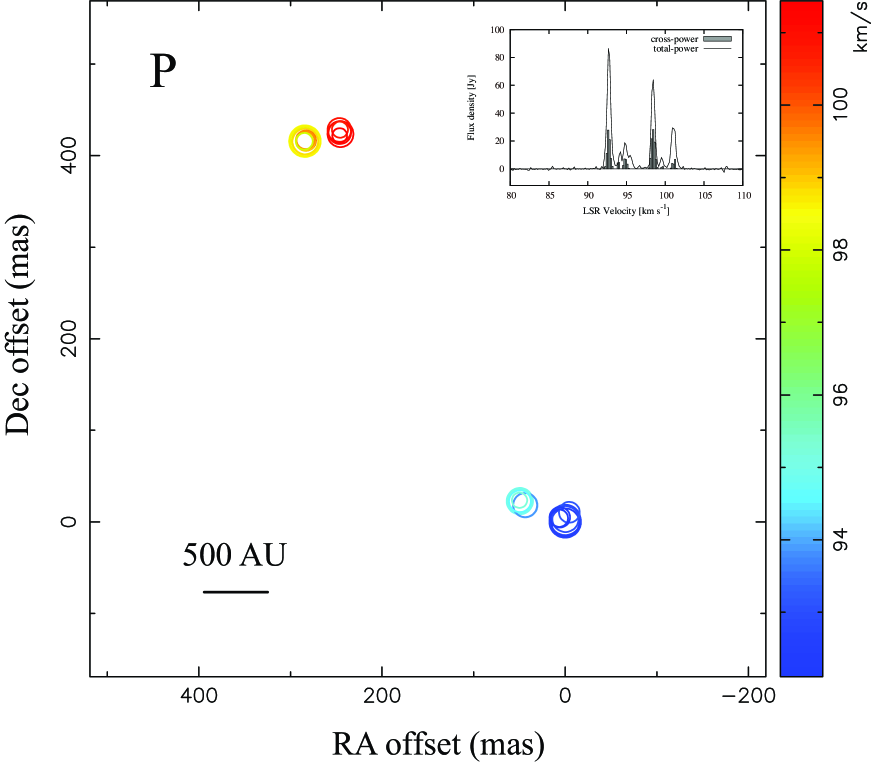
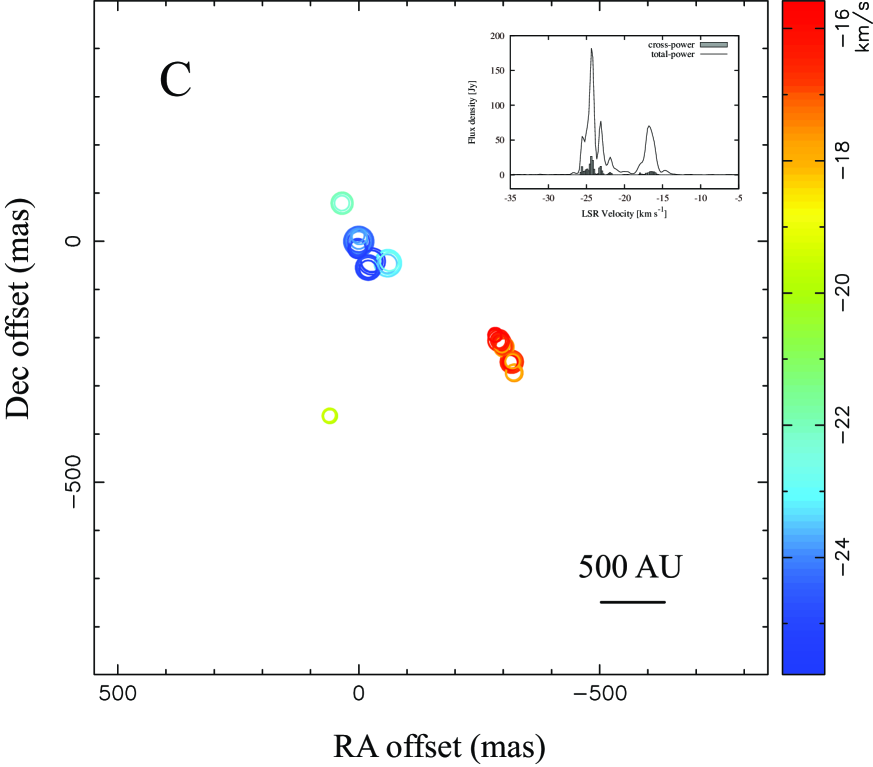
Trigonometric parallax measurements of 12 GHz methanol masers identified this source at 5.9 kpc (Brunthaler et al. 2009). The masers form two clusters separated by approximately 14 arcsec, corresponding to AU (Figure 18). Two millimeter dust continuum cores have been reported to the north (MM1) and south (MM2) of this region (Ren et al. 2011). Each methanol maser cluster is associated with each mm dust core, suggesting that these separated clusters locate in different high-mass star-forming regions. Both maser clusters appear in the ATCA image (IRAS 183190834; Walsh et al. 1998). The maser spots in the MM2 and MM1 regions coincide with those labeled CF and JL in the ATCA image, respectively. The morphology of the northern cluster MM1 is Complex. The maser spots are distributed over 18 mas 18 mas, corresponding to 110 AU 110 AU. The southern cluster MM2 is Paired. The masers in this cluster are distributed over 280 mas 90 mas (1600 AU 550 AU).
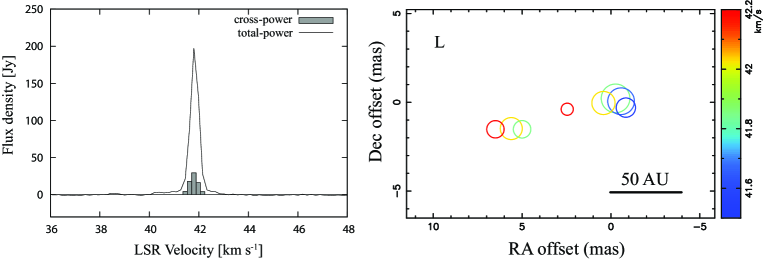
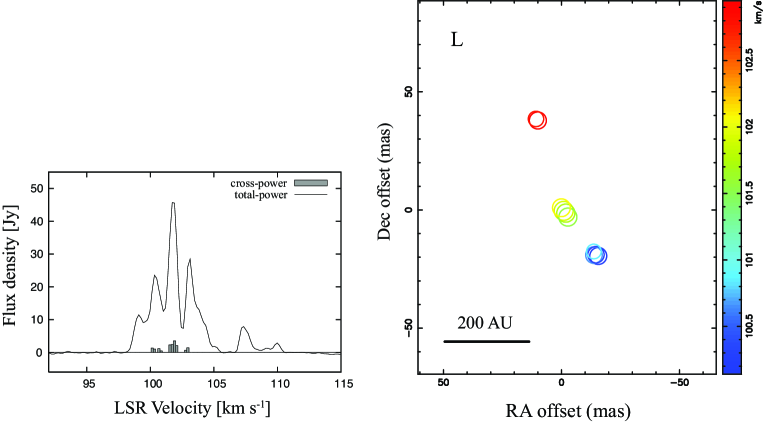
025.65+01.05
This source locates at a kinematic distance of 12.5 kpc (Green & McClure-Griffiths 2011). The morphology of the methanol maser is Linear (Figure 19). The masers are distributed over 7 mas 2 mas, corresponding to 90 AU 20 AU. The radial velocity width is quite narrow (less than 1 km s-1). The ATCA image is elongated approximately 1 arcsec in the north-south direction (IRAS 183160602; Walsh et al. 1998). The spots in the VLBI image coincide with spot B in the ATCA image.
025.71+00.04
This source locates at a kinematic distance of 11.8 kpc (Pandian et al. 2008). The morphology is Complex (Figure 20). The maser spots are distributed over 80 mas 130 mas, corresponding to 930 AU 1500 AU. These spots coincide with those labeled C, D, and J in the ATCA image (IRAS 183530628; Walsh et al. 1998).
025.8200.17
This source locates at a kinematic distance of 5.0 kpc (Green & McClure-Griffiths, 2011). The 6.7 GHz methanol maser spots are distributed in an Elliptical morphology with a clockwise velocity gradient (Figure 21). The scale is 300 mas 300 mas, corresponding to 1500 AU 1500 AU at the source. The EAVN and ATCA images of this source are similarly structured (IRAS 183610627, Walsh et al. 1998).
028.8300.25
This source locates at a kinematic distance of 4.6 kpc (Green & McClure-Griffiths 2011). The spatial distribution is Arched (Figure 22). The maser spots are distributed over 370 mas 440 mas, corresponding to 1700 AU 2000 AU. These spots coincide with those labeled B, D, and G in the ATCA image (IRAS 184210348; Walsh et al. 1998). The EAVN image is similar to the JVLA image presented in Cyganowski et al. (2009).
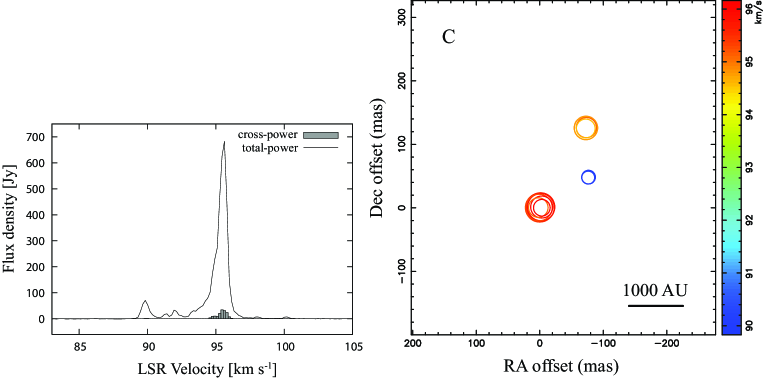
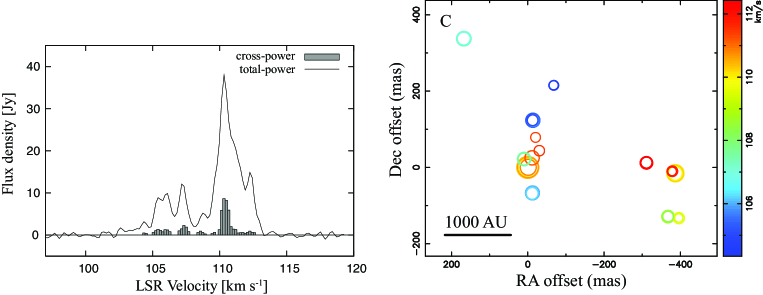
029.8600.04
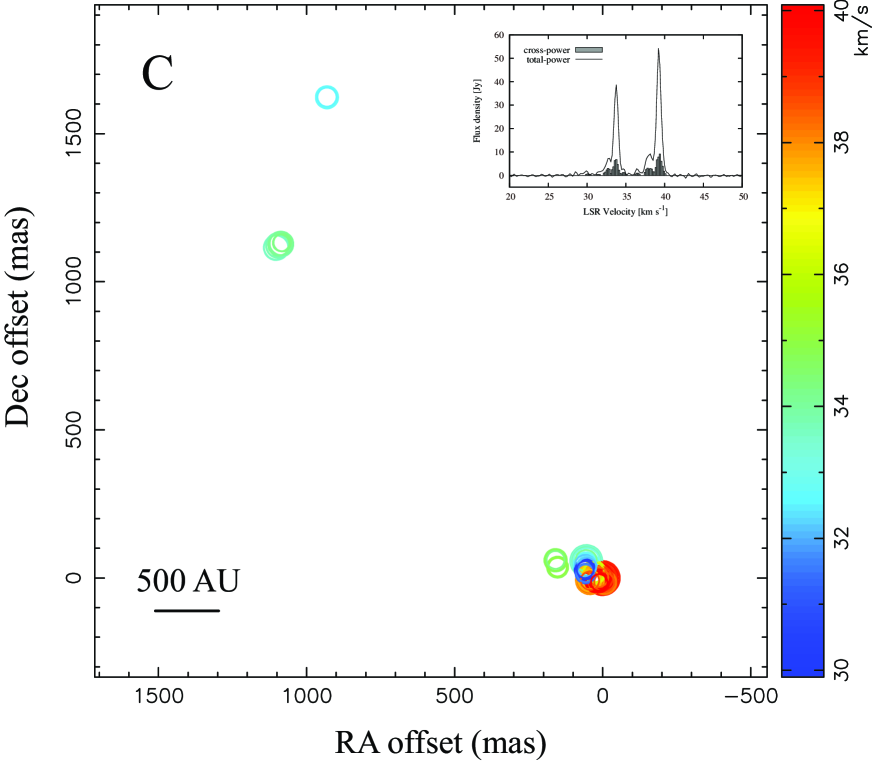
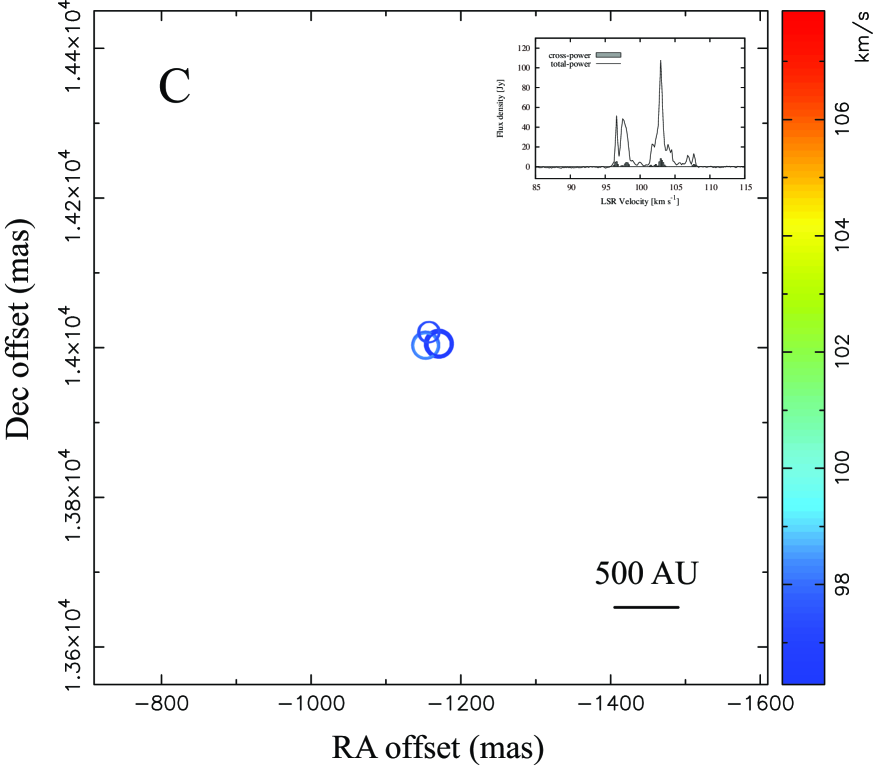
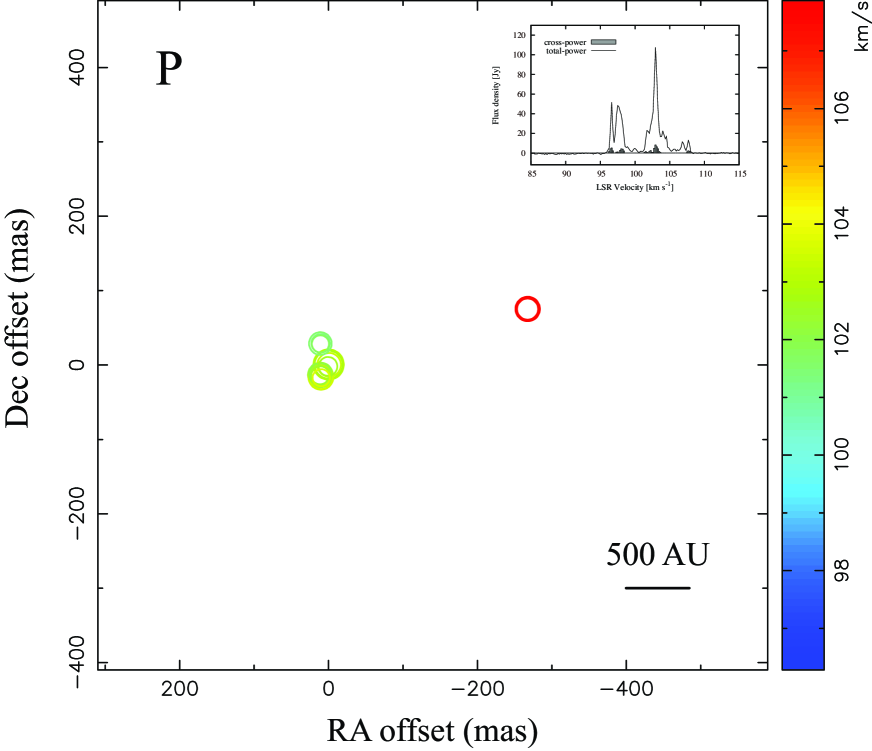
The target source 029.8600.04 is adjacent (7 arcmin) to two H\emissiontypeII regions designated G 029.9500.01 and G 029.9700.04. From H\emissiontypeISA and the formaldehyde absorption line spectrum, the distances of these H\emissiontypeII regions have been measured as 9.3 and 9.2 kpc, respectively (Anderson & Bania (2009); Downes et al. (1980)). Thus, we assume a distance of 9.3 kpc for source 029.8600.04. The 6.7 GHz methanol maser spots reveal an Arched distribution accompanied by a clear velocity gradient (Figure 23). The scale of the distribution is 150 mas 340 mas, corresponding to 1400 AU 3200 AU at the source.
030.7000.06
This source locates in a star-forming region known as the W43 main complex (Motte et al. 2003). The masers are associated with the millimeter dust continuum MM2 (Motte et al. 2003), one of the most massive and luminous cores in the complex. Thus, we assume that 030.7000.06 is located at 5.9 kpc, the measured distance of W43. The morphology of this source is Paired (Figure 24). The maser spots are distributed over 690 mas 420 mas, corresponding to 4100 AU 2500 AU.
030.7600.05
The kinematic distance of this source is 4.8 kpc (Anderson & Bania, 2009). The 6.7 GHz methanol maser spots form two distinct clusters isolated by 34 mas, corresponding to 160 AU; therefore, the morphology of this source is Paired (Figure 25). The maser spots coincide with those labeled DF in the ATCA image (IRAS 184500200, Walsh et al. 1998).
030.91+00.14
This source locates at a kinematic distance of 5.6 kpc (Anderson & Bania 2009). The morphology is Linear with a clear continuous velocity gradient (Figure 26). The maser spots are distributed over 30 mas 60 mas, corresponding to 150 AU 320 AU, and they are associated with submillimeter continuum emission (Hill et al. 2005).
031.28+00.06
The distance of this source is 5.8 kpc (Anderson & Bania, 2009). The 6.7 GHz methanol maser spots form a Complex distribution over 560 mas 470 mas, corresponding to 3300 AU 2700 AU at the source (Figure 27). The maser spots in the VLBI image correspond to those labeled A-K in the ATCA image (IRAS 184560129, Walsh et al. 1998). A VLBI image of this source was also obtained by EVN (Minier et al., 2000). The overall distributions in the EAVN and EVN images are closely matched. However, the maser spot at and 109.87 km s-1 in the EVN image is absent in the EAVN image, while new maser spots appear at and 104.52 km s-1, locating at () = (68, 215) from the brightest spot.
032.03+00.06
From the NIR extinction-distance relationship, the distance of this source has been estimated as 7.2 kpc (Stead & Hoare 2010). The morphology of this source is Paired (Figure 28). The maser spots are distributed over 290 mas 430 mas, corresponding to 2100 AU 3100 AU. The masers are associated with millimeter dust continuum and the 4.5 m extended emission observed by Rathborne et al. (2006) and Chambers et al. (2009).
037.40+01.52
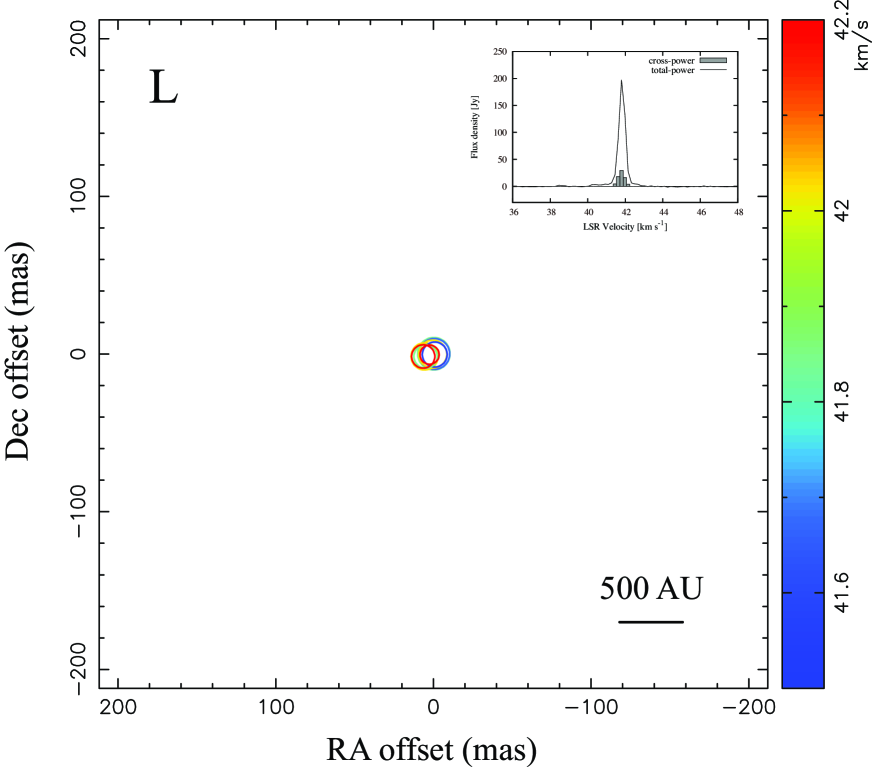
The kinematic distance of this source is 2.1 kpc (Fontani et al. 2011). The morphology is Linear with a clear velocity gradient (Figure 29). The maser spots are distributed over 30 mas 10 mas, corresponding to 60 AU 20 AU. The linear spatial distribution, the size, and the velocity gradient are similar to those of NGC 7538 IRS1 with a linear size of 90 AU (Minier et al. (1998)).
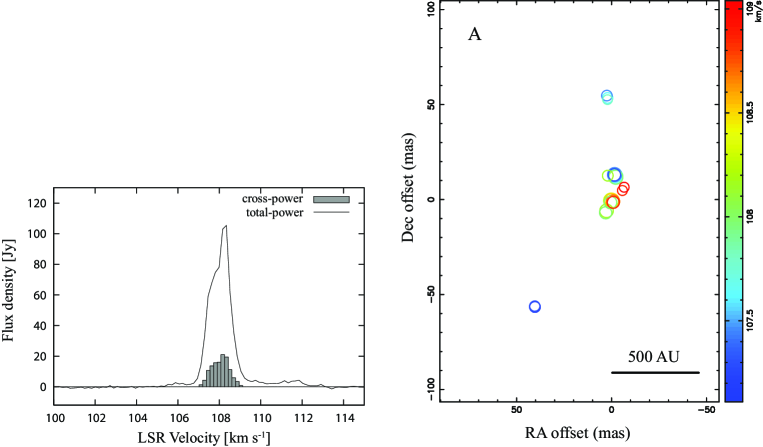
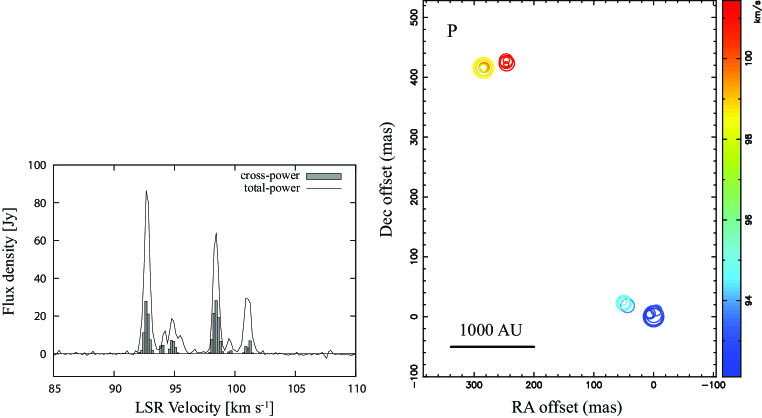
049.4900.38
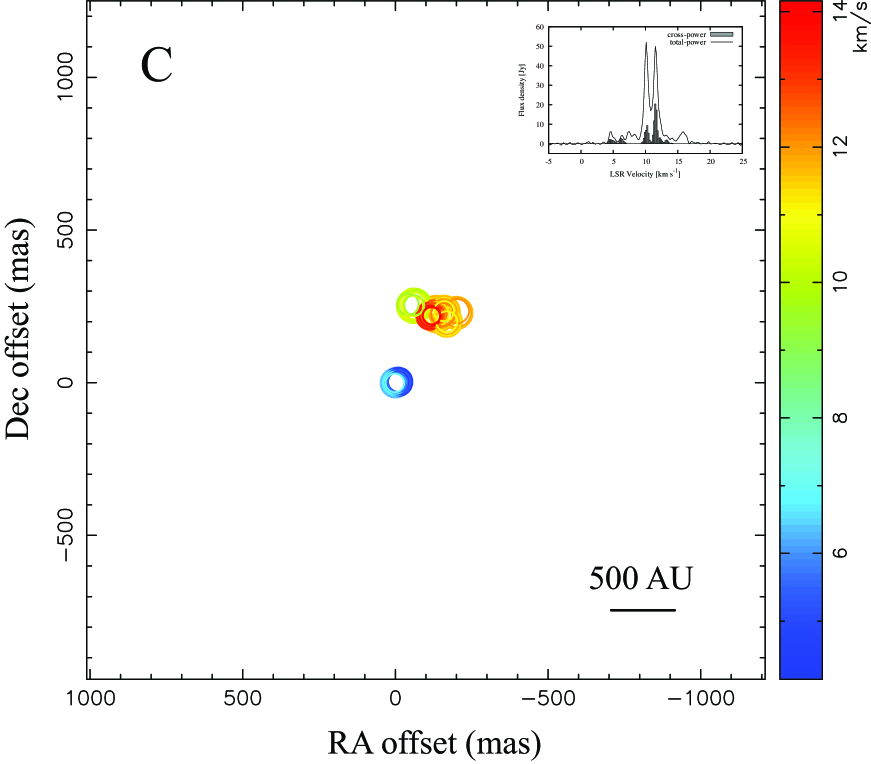
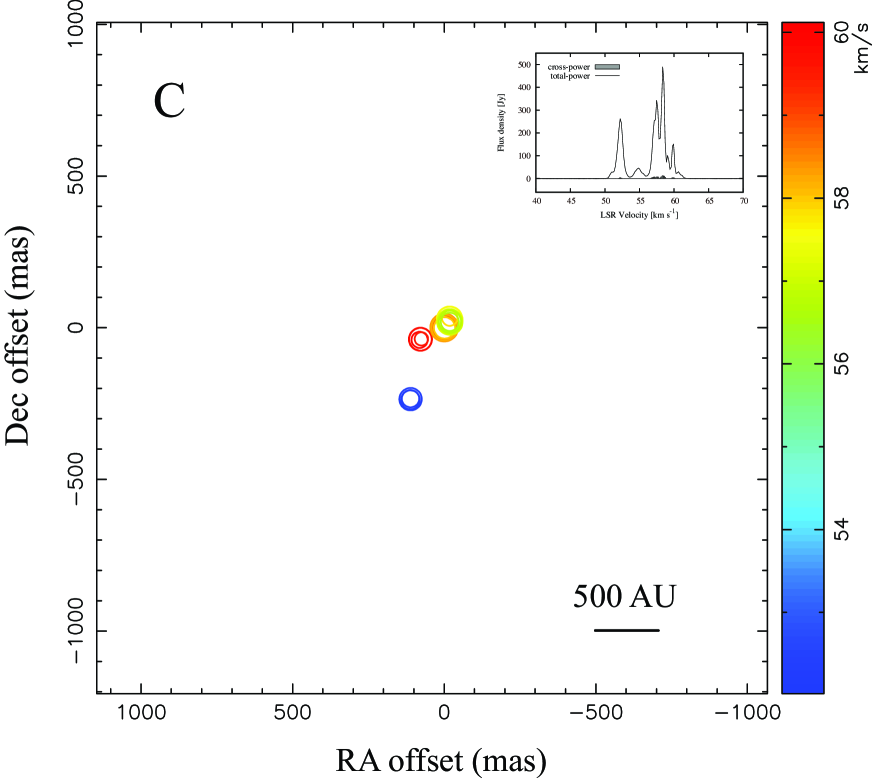
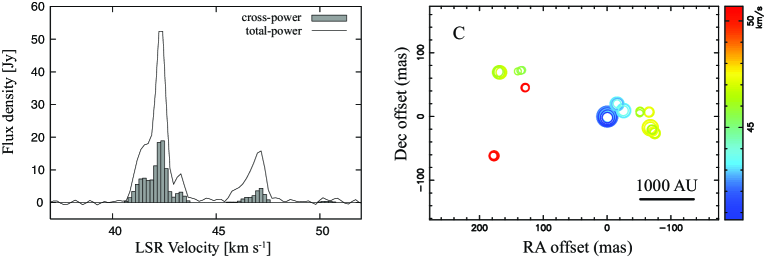
This source locates in the well-known complex high-mass star-forming region W51. From two reported trigonometric parallax distances, namely 5.1 (Xu et al., 2009a) and 5.41 (Sato et al., 2010), we assign a distance of 5.41 kpc to 049.4900.38. Maser emissions have been reported at several sites within an area of 2 arcmin enclosing regions W51 Main and IRS2, but here we concentrate on the target source 049.4900.38 in W51 main. The 6.7 GHz methanol maser spots are distributed in a Complex morphology over 370 mas 310 mas, corresponding to 2000 AU 1700 AU at the source (Figure 30). From MERLIN data, Etoka et al. (2012) showed that the 6.7 GHz methanol maser spots of this source are distributed over an area of arcsec2. The southern spots detected by MERLIN were absent in the EAVN image. The distribution of maser spots of this source was also obtained by EVN (Phillips & van Langevelde (2005); Surcis et al. (2012)) and found to be consistent with that in the EAVN image.
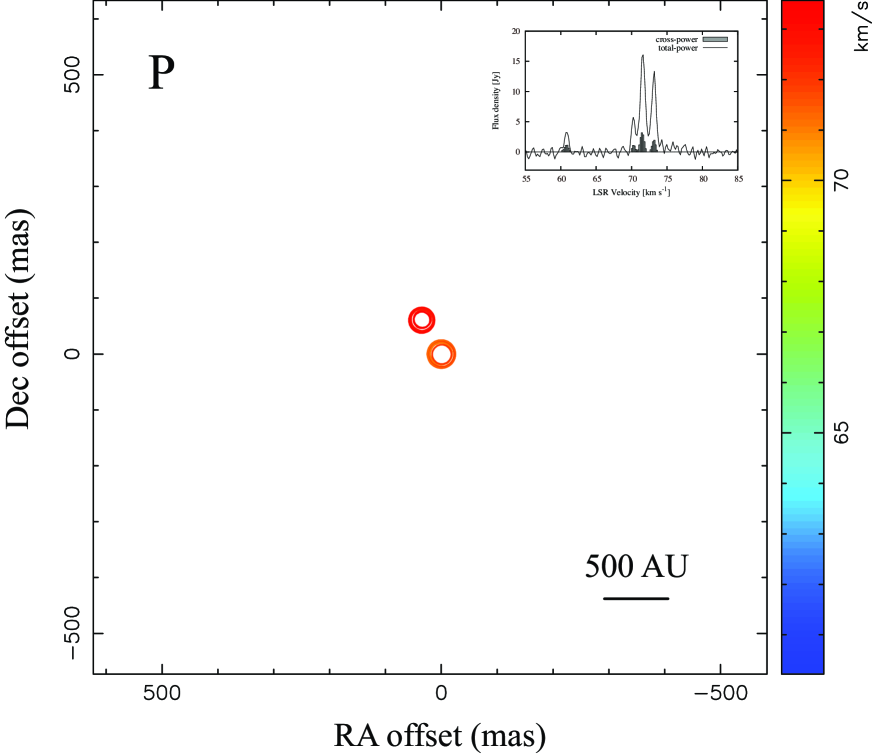
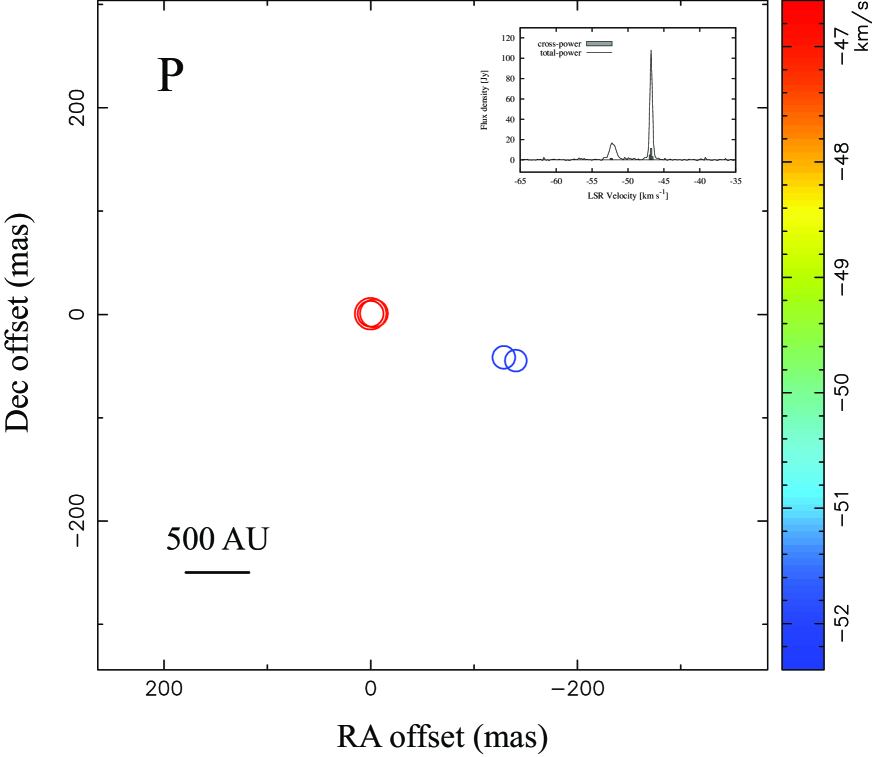
232.62+00.99
This source locates at a distance of 1.68 kpc, estimated from trigonometric parallax measurements of the 12 GHz methanol maser (Reid et al. 2009). The morphology of this source is Paired (Figure 31). The maser spots are distributed over 20 mas 70 mas, corresponding to 40 AU 120 AU. These spots coincide with the spots labeled B and C in the ATCA image (IRAS 072991651; Walsh et al. 1998).
351.7700.53
The distance of this source is 0.4 kpc with a large uncertainty (Green & McClure-Griffiths 2011). The morphology of this source is Elliptical (although the south-western section is missing in the image) with a counter-clockwise velocity gradient (Figure 32). The maser spots are distributed over 100 mas 100 mas (40 AU 40 AU) and coincide with those labeled AD in the ATCA image (IRAS 172333606; Walsh et al. 1998). A strong 12CO bipolar outflow and OH maser outflow have been reported in this region (Leurini et al. 2008).
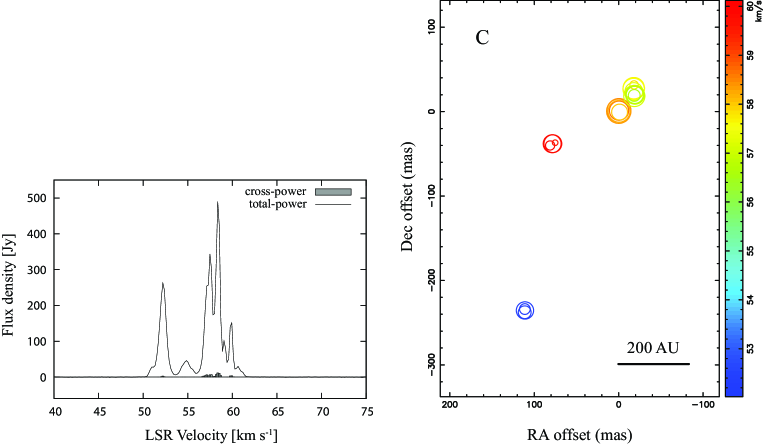
352.6301.06
This source locates at a kinematic distance of 0.9 kpc, with a large uncertainty (Green & McClure-Griffiths 2011). The morphology is Linear, but the velocity distribution is complex (Figure 33). The maser spots are distributed over 370 mas 290 mas, corresponding to 330 AU 260 AU. These maser spots coincide with those labeled D and F in the ATCA image (IRAS 172783541; Walsh et al. 1998). New maser spots are detected at (, ) = (210, 190) from the brightest maser spot. The 6.7 GHz methanol masers locate at a peak of the 1.2 mm dust continuum emission (Faúndez et al. 2004).
353.4100.36
The kinematic distance of this source is 3.8 kpc (Caswell et al. 2011). The morphology is Complex (Figure 34). The maser spots are distributed over 60 mas 120 mas, corresponding to 220 AU 460 AU, and they coincide with those labeled AC in the ATCA image (IRAS 172713439; Walsh et al. 1998). The 6.7 GHz methanol maser is associated with a peak of the millimeter dust continuum and centimeter radio continuum sources (Garay et al. 2006, 2007). From radio continuum observations, the exciting star is thought to be of spectral type O9.5. SiO and CH3CCH lines have also been detected in this region (Miettinen et al. 2006).
354.61+00.47
This source locates at a kinematic distance of 3.8 kpc (Green & McClure-Griffiths 2011). The morphology is Complex, formed by three clusters (Figure 35). The scale of the maser distribution is 380 mas 440 mas, corresponding to 1500 AU 1700 AU. The 6.7 GHz methanol masers locate close to a peak of the millimeter dust continuum emission (Faúndez et al. 2004).
359.43-00.10
5 Discussions
5.1 Spatial Distribution of Maser emissions
The distributions of the 6.7 GHz methanol maser spots vary widely in size and structure similar to the results of previous studies by Bartkiewicz et al. (2009) and Pandian et al. (2011). The whole size of the spatial distribution is from 9 to 4900 AU. The 6.7 GHz methanol maser is excited by infrared radiation when its dust temperature is 100200 K (Cragg et al. 2005). The spatial scale of the maser distribution can be estimated from the luminosity of the emitting source. Assuming a luminosity from to and a suitable dust temperature of 100 K, the maser is predicted to appear at 5005000 AU from the excited star, consistent with observation.
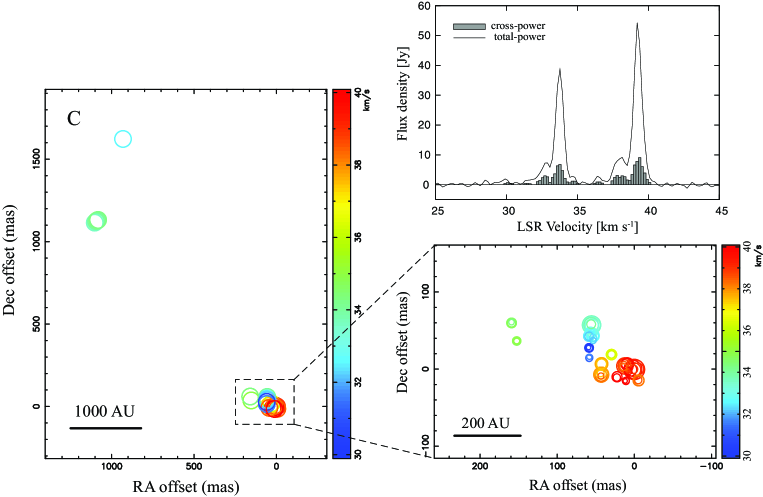
On the other hand, the maser distribution of some sources deviate from their expected range. The three sources 000.5400.85 NW/SE, 020.23+00.06 SW/NE, and 023.43-00.18 MM1/2 cannot be attributed to excitation of a single central source of luminosity to because the separation of their masers exceeds AU, indicating that each source likely involves at least two exciting sources. In the following discussion, we assume that these largely separated clusters associate with individual exciting sources, i.e., these are independent sources. Hence we use 38 as the number of the imaged sources, hereafter.
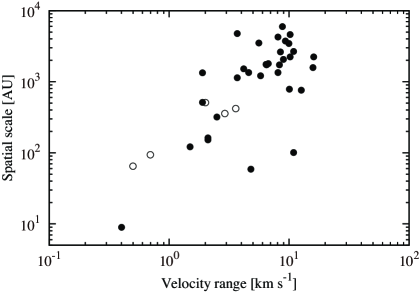
The spatial scale of the maser distribution is plotted as a function of observed radial velocity range in Figure 37. The spatial scale of each source is defined as the largest extent of spot distribution in the celestial sphere, while the velocity range is the difference between the smallest and largest velocities of the maser spots detected by VLBI (see Table 3). Open circles denote sources with Linear morphology, and the filled circles represent other morphologies (Elliptical, Arched, Paired, and Complex). A positive correlation is observed between the spatial scale and radial velocity range, as previously reported by Pandian et al. (2011). Note, however, that sources of Linear morphology are the main contributors to this correlation. The spatial distribution of all Linearly distributed sources is below 600 AU, and their radial velocity range is smaller than 4 km s-1, below those of other sources. If the Linearly distributed sources are excluded from Figure 37, the correlation between size and radial velocity range becomes much weaker. This tendency toward small radial velocity range and spatial extent in sources of Linear distribution has been similarly seen in the result by Pandian et al. (2011). As discussed in the following subsection, we consider that sources of such restricted size and velocity range are the observable parts of larger structures that are not completely revealed.
5.2 Morphology and the spreading structure of each spot
Table 4 summarizes the number of sources satisfying each morphology, as absolute values and as fractions of the total number of sources. For comparison, 27 sources observed by EVN and classified into the five types are also listed (these have been previously reported in Bartkiewicz et al. (2009)). The number of Elliptical sources, which is expected to trace the gas disk around YSOs, is six (16%), small as compared with that (33%) in Bartkiewicz et al. (2009). Our samples contain relatively high numbers of Paired (21%) and Complex (39%) distributions, which contain no apparent systematic spatial distribution or radial velocity structures.
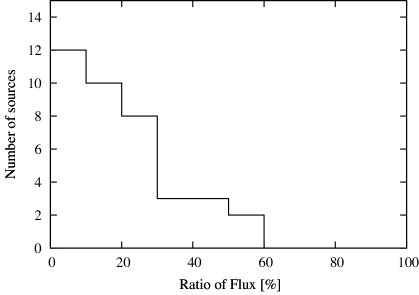
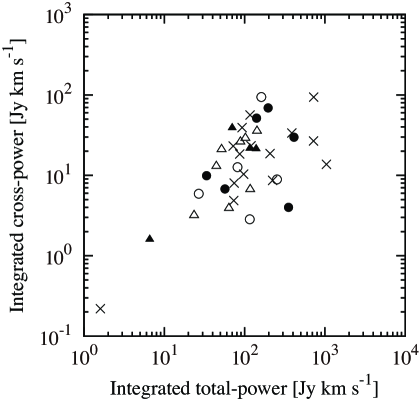
Since structures of low intensity are not detected by VLBI, sources with Paired or Complex morphology may in fact possess low-brightness Elliptical, or other systematic structures. The ratio of the integrated flux of CLEAN components to the total flux is listed in Table 3. To investigate the fraction of maser radiation detectable by VLBI, a histogram of these ratios is presented in Figure 38. The detectability is from 1% to 58%, averaging around 20%. Similarly, Bartkiewicz et al. (2009) noted that, for most sources, 1030% of the total flux was detected by EVN. Our result suggests that 80% of the maser emissions spread spatially into a diffuse structure. Distribution of total-power versus correlated flux is shown in Figure 39 with different symbols for each morphology. This is for testing if the detectability differs with the morphology, but no clear tendency of distribution is seen for different morphology.
Minier et al. (2002) mentioned that some of the 6.7 GHz methanol maser emission consists of compact core and spreading halos with sizes of a few (tens) astronomical units and a few hundred or larger astronomical units, respectively. Pandian et al. (2011) also reported that some maser spots possess no compact core. The spatial distribution of such dispersed maser emissions cannot be determined by VLBI observation. Therefore, as discussed for the Linearly distributed sources, we consider that the exact spatial distributions or morphological classes of maser emissions are difficult to deduce from VLBI observations alone.
When interpreting the proper motion of the maser spot and its associated site, any non-observed parts must be identified. To avoid the resolved-out problem, the diffuse structure should be observed. Assuming that the emission component spreads into a halo with a size of 300 AU and the distance to the source is 3 kpc, the angular size of the spread emission is 0.1 arcsec. To detect this structure, an interferometric observation of spatial resolution approximately arcsec is required. We have observed 24 sources among the sources in our sample by ATCA, whose typical spatial resolution is arcsec2. The observed images, which contain the whole emission of the 6.7 GHz masers, will assist in VLBI image interpretation and obtaining the internal proper motion of the maser spots. The ATCA results will be published elsewhere. High-resolution observations by ALMA will be important for determining the gas and dust distributions within the sources. In a future study, these distributions could be compared with the distribution of the masers.
| Array | Spatial Morphology | ||||
|---|---|---|---|---|---|
| Elliptical∗ | Arched | Linear | Paired | Complex | |
| EAVN | 6 | 4 | 5 | 8 | 15 |
| (percentage) | (16) | (11) | (13) | (21) | (39) |
| EVN | 9 | 3 | 5 | 1 | 9 |
| (percentage) | (33) | (11) | (19) | (4) | (33) |
|
The EVN data are taken from Bartkiewicz et al. (2009).
Note that 27 sources, classified into the five morphologies,
are included in this table.
“Elliptical” is defined as “Ring” in Bartkiewicz et al. (2009). |
|||||
5.3 Future Prospect for Proper Motion Measurements
Despite being limited by the resolved-out problem, VLBI detects 158% of the maser emission, implying that the emission is concentrated in sufficiently compact spots. The number of detected spots in each source is from 3 to 72, with an average of 29. In 34 of the sources, the spot number is larger than or equal to 10, which is sufficient for investigating the three-dimensional velocity field. The relatively long lifetime of the 6.7 GHz maser spot (Goedhart et al. 2004, Ellingsen 2007) has enabled us to observe spots at three epochs over 2 years. The relative position of the maser spot in each map was measured at an accuracy higher than 0.1 mas, although in practice, the accuracy depends on the signal-to-noise ratio of each component. Three repeats of this monitoring observation, planned over two years, will allow us to determine the internal proper motion to an accuracy of mas yr-1. At a typical distance of 3 kpc, this accuracy of proper motion corresponds to a tangential velocity of 1.5 km s-1. Since the average radial velocity width of the maser is 6.5 km s-1, the internal proper motion is detectable at sufficiently high signal-to-noise ratio. In fact, from these previous JVN observations, we measured the internal proper motions of the spots for four sources (Matsumoto et al. 2011; Sugiyama et al. 2011, 2013; Sawada-Satoh et al. 2013).
6 Conclusion
To study the associated site of the 6.7 GHz methanol maser and the gas dynamics around high-mass YSOs, we have monitored the internal proper motion of the maser. For these purposes, 36 selected sources were studied by multi-epoch VLBI observations using EAVN. We present 35 VLBI images successfully obtained from the first epoch observation. Three sources contain two separated star-forming regions in each image, yielding 38 imaged sources. The distribution of the detected maser spots was from 9 to 4900 AU and displayed a range of morphologies. The flux detected by VLBI was 158% of the total flux, suggesting that a large fraction of the radiation is dispersed into an extended structure invisible to VLBI. To investigate the associated site and motion of the maser, shorter baselines are required to recover the distribution of this extended emission. Of the 38 imaged sources, we detected 10 or more spots in 34. The accuracy of the spot position was approximately 0.1 mas. Therefore, the internal proper motions could be measured with sufficient accuracy following 2 years of monitoring observation. From these results, we can statistically investigate the three-dimensional velocity field around high-mass YSOs. Since most of the observed sources are located in the southern hemisphere, they can be observed with the Atacama Large Millimeter/Submillimeter Array (ALMA) in future.
The authors wish to thank the JVN team for observational assistance and support. The JVN project is led by the National Astronomical Observatory of Japan (NAOJ) that is a branch of the National Institutes of Natural Sciences (NINS), Hokkaido University, Ibaraki University, The University of Tsukuba, Gifu University, Osaka Prefecture University, Yamaguchi University, and Kagoshima University, in cooperation with Geospatial Information Authority of Japan (GSI), the Japan Aerospace Exploration Agency (JAXA), and the National Institute of Information and Communications Technology (NICT). This work was financially supported in part by Grant-in-Aid for Scientific Research (KAKENHI) from the Japan Society for the Promotion of Science (JSPS), No. 24340034. This work is partly supported by China Ministry of Science and Technology under State Key Development Program for Basic Research (2012CB821800), the National Natural Science Foundation of China (grants 10625314, 11121062, and 11173046), the CAS/SAFEA International Partnership Program for Creative Research Teams, and the Strategic Priority Research Program on Space Science, the Chinese Academy of Sciences (Grant No. XDA04060700).
References
- Anderson & Bania (2009) Anderson, L. D., & Bania, T. M. 2009, ApJ, 690, 706
- Bartkiewicz et al. (2009) Bartkiewicz, A., Szymczak, M., van Langevelde, H. J., Richards, A. M. S., & Pihlström, Y. M. 2009, A&A, 502, 155
- Brunthaler et al. (2009) Brunthaler, A., Reid, M. J., Menten, K. M., et al. 2009, ApJ, 693, 424
- Caswell et al. (1995) Caswell, J. L., Vaile, R. A., Ellingsen, S. P., & Norris, R. P. 1995, MNRAS, 274, 1126
- Caswell (2009) Caswell, J. L. 2009, PASA, 26, 454
- Caswell et al. (2010) Caswell, J. L., Fuller, G. A., Green, J. A., et al. 2010, MNRAS, 404, 1029
- Caswell et al. (2011) Caswell, J. L., Fuller, G. A., Green, J. A., et al. 2011, MNRAS, 417, 1964
- Chambers et al. (2009) Chambers, E. T., Jackson, J. M., Rathborne, J. M., & Simon, R. 2009, ApJS, 181, 360
- Cragg et al. (2005) Cragg, D. M., Sobolev, A. M., & Godfrey, P. D. 2005, MNRAS, 360, 533
- Cyganowski et al. (2009) Cyganowski, C. J., Brogan, C. L., Hunter, T. R., & Churchwell, E. 2009, ApJ, 702, 1615
- Dame & Thaddeus (2008) Dame, T. M., & Thaddeus, P. 2008, ApJ, 683, L143
- De Buizer (2003) De Buizer, J. M. 2003, MNRAS, 341, 277
- De Buizer et al. (2009) De Buizer, J. M., Redman, R. O., Longmore, S. N., Caswell, J., & Feldman, P. A. 2009, A&A, 493, 127
- Dodson et al. (2004) Dodson, R., Ojha, R., & Ellingsen, S. P. 2004, MNRAS, 351, 779
- Doi et al. (2006) Doi, Akihiro, Fujisawa, K., Harada, K., et al. Proceedings of the 8th European VLBI Network Symposium. September 26-29, 2006,Torun, Poland. Editorial Board: Baan Willem, Bachiller Rafael, Booth Roy, Charlot Patrick, Diamond Phil, Garrett Mike, Hong Xiaoyu, Jonas Justin, Kus Andrzej, Mantovani Franco, Marecki Andrzej (chairman), Olofsson Hans, Schlueter Wolfgang, Tornikoski Merja, Wang Na, Zensus Anton., p.71
- Downes et al. (1980) Downes, D., Wilson, T. L., Bieging, J., & Wink, J. 1980, A&AS, 40, 379
- Ellingsen (2007) Ellingsen, S. P. 2007, MNRAS, 377, 571
- Etoka et al. (2012) Etoka, S., Gray, M. D., & Fuller, G. A. 2012, MNRAS, 423, 647
- Faúndez et al. (2004) Faúndez, S., Bronfman, L., Garay, G., et al. 2004, A&A, 426, 97
- Fish et al. (2003) Fish, Vincent L., Reid, Mark J., Wilner, David J., Churchwell, Ed 2003, ApJ, 587, 701
- Fontani et al. (2011) Fontani, F., Palau, A., Caselli, P., et al. 2011, A&A, 529, L7
- Fujisawa et al. (2002) Fujisawa, K., Mashiyama, H., Shimoikura, T., Kawaguchi, N. The Proceedings of the IAU 8th Asian-Pacific Regional Meeting, Volume II, held at National Center of Sciences, Hitotsubashi Memorial Hall, Tokyo, July 2 - 5, 2002, Edited by S. Ikeuchi, J. Hearnshaw, and T. Hanawa, the Astronomical Society of Japan, 2002, p. 3-4.
- Garay et al. (1993) Garay, G., Rodriguez, L. F., Moran, J. M., & Churchwell, E. 1993, ApJ, 418, 368
- Garay et al. (2006) Garay, G., Brooks, K. J., Mardones, D., & Norris, R. P. 2006, ApJ, 651, 914
- Garay et al. (2007) Garay, G., Mardones, D., Brooks, K. J., Videla, L., & Contreras, Y. 2007, ApJ, 666, 309
- Goddi et al. (2011) Goddi, C., Moscadelli, L., & Sanna, A. 2011, A&A, 535, 8
- Goedhart et al. (2004) Goedhart, S., Gaylard, M. J., & van der Walt, D. J. 2004, MNRAS, 355, 553
- Goedhart et al. (2009) Goedhart, S., Langa, M. C., Gaylard, M. J., & van der Walt, D. J. 2009, MNRAS, 398, 995
- Green et al. (2010) Green, J. A., Caswell, J. L., Fuller, G. A., et al. 2010, MNRAS, 409, 913
- Green & McClure-Griffiths (2011) Green, J. A., & McClure-Griffiths, N. M. 2011, MNRAS, 417, 2500
- Green et al. (2012) Green, J. A., Caswell, J. L., Fuller, G. A., et al. 2012, MNRAS, 420, 3108
- Greisen (2003) Greisen, E. W. 2003, Information Handling in Astronomy - Historical Vistas, 285, 109
- Hill et al. (2005) Hill, T., Burton, M. G., Minier, V., et al. 2005, MNRAS, 363, 405
- Immer et al. (2013) Immer, K., Reid, M. J., Menten, K. M., Brunthaler, A., & Dame, T. M. 2013, arXiv:1304.2041
- Kurtz & Franco (2002) Kurtz, S., & Franco, J. 2002, Revista Mexicana de Astronomia y Astrofisica Conference Series, 12, 16
- Leurini et al. (2008) Leurini, S., Hieret, C., Thorwirth, S., et al. 2008, A&A, 485, 167
- Longmore et al. (2011) Longmore, S. N., Pillai, T., Keto, E., Zhang, Q., & Qiu, K. 2011, ApJ, 726, 97
- Matsumoto et al. (2011) Matsumoto, N., Honma, M., Isono, Y., et al. 2011, PASJ, 63, 1345
- Menten (1991) Menten, K. M. 1991, ApJ, 380, L75
- Miettinen et al. (2006) Miettinen, O., Harju, J., Haikala, L. K., & Pomrén, C. 2006, A&A, 460, 721
- Minh et al. (2003) Minh, Y. C., Roh, D.-G., Han, S.-T., Kim, H.-G. New technologies in VLBI, Proceedings of a symposium of the International VLBI Service for Geodesy and Astrometry held in Gyeong-ju, Korea, 5-8 November 2002. Edited by Y.C. Minh. ASP Conference Series, Vol. 306. San Francisco, CA: Astronomical Society of the Pacific, 2003., p.373
- Minier et al. (1998) Minier, V., Booth, R. S., & Conway, J. E. 1998, A&A, 336, 5
- Minier et al. (2000) Minier, V., Booth, R. S., & Conway, J. E. 2000, A&A, 362, 1093
- Minier et al. (2002) Minier, V., Booth, R. S., & Conway, J. E. 2002, A&A, 383, 614
- Minier et al. (2003) Minier, V., Ellingsen, S. P., Norris, R. P., & Booth, R. S. 2003, A&A, 403, 1095
- Moisés et al. (2011) Moisés, A. P., Damineli, A., Figuerêdo, E., et al. 2011, MNRAS, 411, 705
- Moscadelli et al. (2011) Moscadelli, L., Cesaroni, R., Rioja, M. J., Dodson, R., & Reid, M. J. 2011, A&A, 526, A66
- Motte et al. (2003) Motte, F., Schilke, P., & Lis, D. C. 2003, ApJ, 582, 277
- Nicholas et al. (2011) Nicholas, B., Rowell, G., Burton, M. G., et al. 2011, MNRAS, 411, 1367
- Norris et al. (1993) Norris, R. P., Whiteoak, J. B., Caswell, J. L., Wieringa, M. H., & Gough, R. G. 1993, ApJ, 412, 222
- Pandian et al. (2007) Pandian, J. D., Goldsmith, P. F., & Deshpande, A. A. 2007, ApJ, 656, 255
- Pandian et al. (2008) Pandian, J. D., Momjian, E., & Goldsmith, P. F. 2008, A&A, 486, 191
- Pandian et al. (2011) Pandian, J. D., Momjian, E., Xu, Y., Menten, K. M., & Goldsmith, P. F. 2011, ApJ, 730, 55
- Pestalozzi et al. (2005) Pestalozzi, M. R., Minier, V., & Booth, R. S. 2005, A&A, 432, 737
- Phillips et al. (1998) Phillips, C. J., Norris, R. P., Ellingsen, S. P., & McCulloch, P. M. 1998, MNRAS, 300, 1131
- Phillips & van Langevelde (2005) Phillips, C., & van Langevelde, H. J. 2005, Future Directions in High Resolution Astronomy, 340, 342
- Rathborne et al. (2006) Rathborne, J. M., Jackson, J. M., & Simon, R. 2006, ApJ, 641, 389
- Reid et al. (2009) Reid, M. J., Menten, K. M., Zheng, X. W., Brunthaler, A., & Xu, Y. 2009, ApJ, 705, 1548
- Ren et al. (2011) Ren, J. Z., Liu, T., Wu, Y., & Li, L. 2011, MNRAS, 415, L49
- Ren et al. (2012) Ren, Z., Wu, Y., Zhu, M., et al. 2012, MNRAS, 422, 1098
- Rygl et al. (2010) Rygl, K. L. J., Brunthaler, A., Reid, M. J., et al. 2010, A&A, 511, A2
- Sanna et al. (2009) Sanna, A., Reid, M. J., Moscadelli, L., et al. 2009, ApJ, 706, 464
- Sanna et al. (2010a) Sanna, A., Moscadelli, L., Cesaroni, R., et al. 2010a, A&A, 517, A71
- Sanna et al. (2010b) Sanna, A., Moscadelli, L., Cesaroni, R., et al. 2010b, A&A, 517, A78
- Sato et al. (2010) Sato, M., Reid, M. J., Brunthaler, A., & Menten, K. M. 2010, ApJ, 720, 1055
- Sawada-Satoh et al. (2013) Sawada-Satoh, S., Fujisawa, K., Sugiyama, K., Wajima, K., & Honma, M. 2013, PASJ, 65, 79
- Shen et al. (2004) Shen, Z., Yang, J., Hirabayashi, H., Inoue, M., Kim, H.-G. & Han, S.-T. 2004, Asia-Pacific Radio Science Conference Proceedings (eds. Tang Keyun and Liu Dayong), p401-402.
- Shibata et al. (1998) Shibata, K. M., Kameno, S., Inoue, M., & Kobayashi, H. 1998, ASP Conf. Ser. 144: IAU Colloq. 164: Radio Emission from Galactic and Extragalactic Compact Sources, 144, 413
- Stead & Hoare (2010) Stead, J. J., & Hoare, M. G. 2010, MNRAS, 407, 923
- Sugiyama et al. (2008) Sugiyama, K., Fujisawa, K., Doi, A., et al. 2008, PASJ, 60, 23
- Sugiyama et al. (2011) Sugiyama, K., Fujisawa, K., Doi, A., et al. 2011, PASJ, 63, 53
- Sugiyama et al. (2013) Sugiyama, K., Fujisawa, K., Doi, A., et al. 2013, submitted to A&A
- Surcis et al. (2012) Surcis, G., Vlemmings, W. H. T., van Langevelde, H. J., & Hutawarakorn Kramer, B. 2012, A&A, 541, A47
- Walsh et al. (1998) Walsh, A. J., Burton, M. G., Hyland, A. R., & Robinson, G. 1998, MNRAS, 301, 640
- Walsh et al. (2003) Walsh, A. J., Macdonald, G. H., Alvey, N. D. S., Burton, M. G., & Lee, J.-K. 2003, A&A, 410, 597
- Xu et al. (2008) Xu, Y., Li, J. J., Hachisuka, K., et al. 2008, A&A, 485, 729
- Xu et al. (2009a) Xu, Y., Reid, M. J., Menten, K. M., et al. 2009a, ApJ, 693, 413
- Xu et al. (2009b) Xu, Y., Voronkov, M. A., Pandian, J. D., et al. 2009b, A&A, 507, 1117
- Xu et al. (2011) Xu, Y., Moscadelli, L., Reid, M. J., et al. 2011, ApJ, 733, 25
- Ye et al. (1991) Ye, Shuhua, Wan, Tongshan, Qian, Zhihan Radio interferometry: Theory, techniques, and applications: Proceedings of the 131st IAU Colloquium, Socorro, NM, Oct. 8-12, 1990 (A92-56376 24-89). San Francisco, CA, Astronomical Society of the Pacific, 1991, p. 386-389.
- Yonekura et al. (2013) Yonekura, Y., Saito, Y., Saito, T., et al. 2013, ASP Conf. Ser. 476: New Trends in Radio Astronomy in the ALMA Era: The 30th Anniversary of Nobeyama Radio Observatory (eds. R. Kawabe, N. Kuno, S. Yamamoto), 415
- Zinnecker & Yorke (2007) Zinnecker, H., & Yorke, H. W. 2007, ARA&A, 45, 481
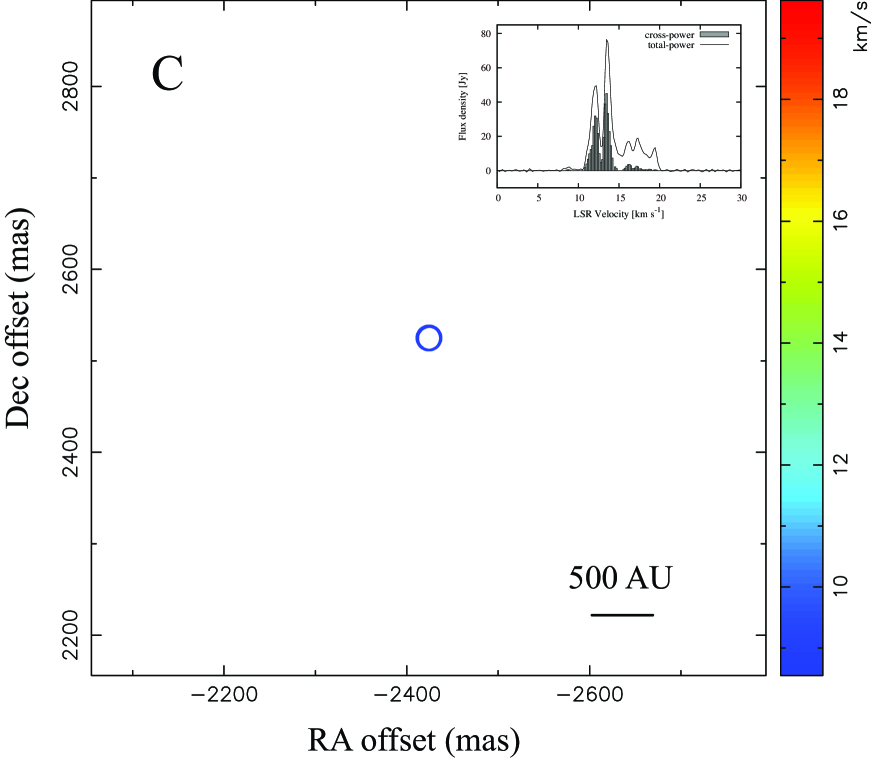
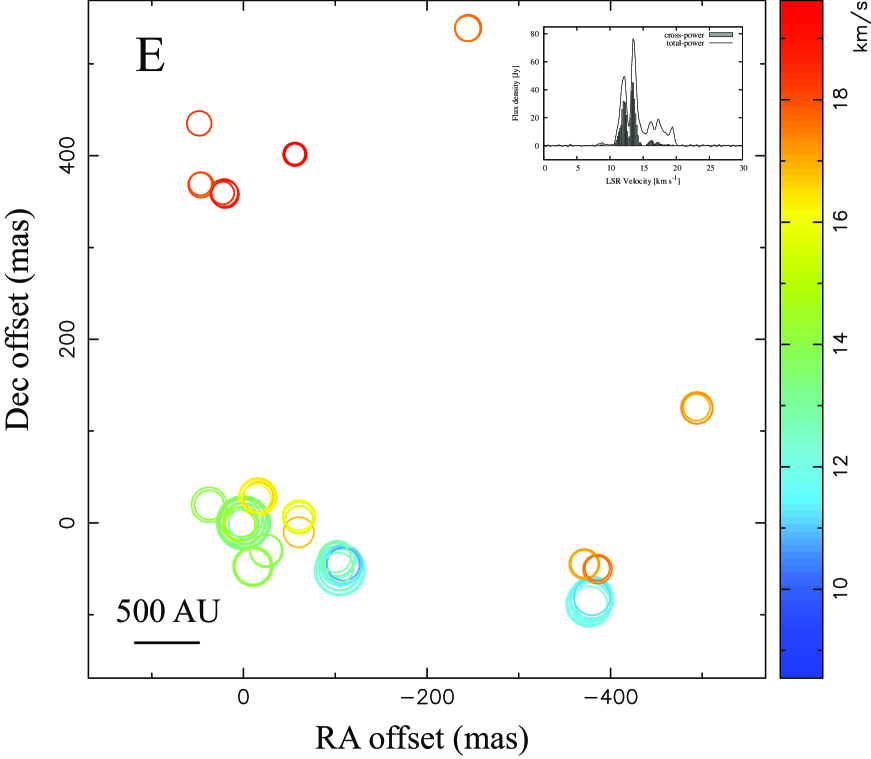
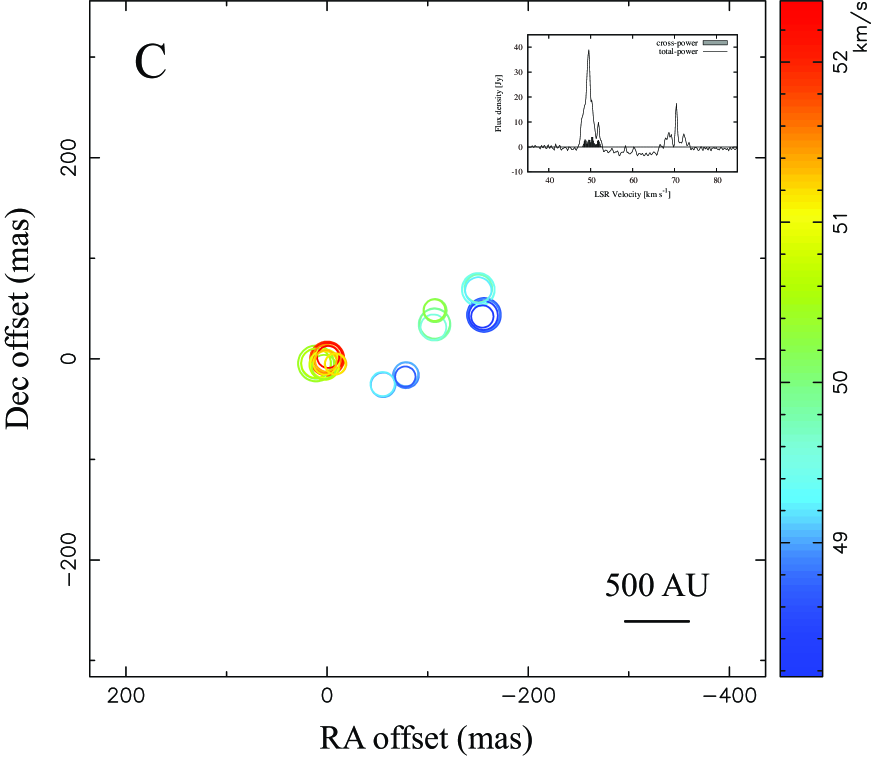
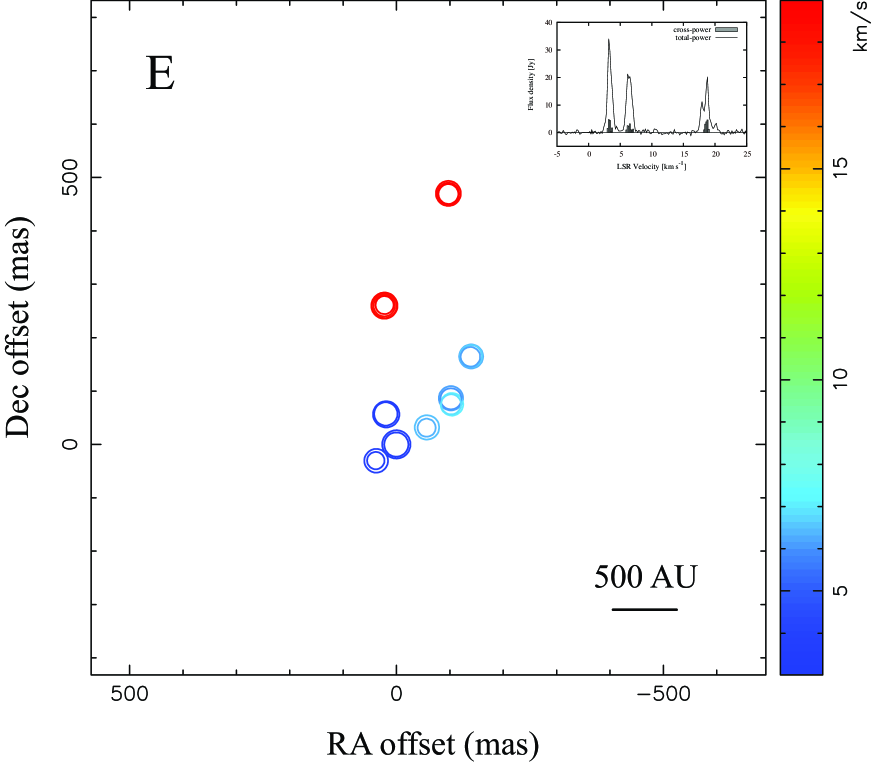
Spatial Distribution in Unified Scale
VLBI images of 38 sources are shown in the figures 40-77 in the same spatial scale (5310 AU in each RA and Dec) for all sources. These figures correspond to figures 2-36. A 500 AU scale bar and the spectrum are shown in the corner of each figure.