11email: HTM@x-astro.net,TL@x-astro.net
(2) Division of Astronomy, Department of Physics, P.O. Box 3000, FI-90014 University of Oulu, Finland
(3) Centro de Astrofísica and Faculdade de Ciências, Universidade do Porto, Rua das Estrelas, 4150-762 Porto, Portugal
What will blue compact dwarf galaxies evolve into?
We present and analyse the photometric properties of a nearly
complete sample of blue compact dwarf (BCD) and irregular
galaxies in the Virgo cluster from multi-band SDSS images. Our study intends to
shed light on the ongoing debate of whether a structural evolution
from present-day star-forming dwarf galaxies in a cluster
environment into ordinary early-type dwarf galaxies is possible
based on the structural properties.
For this purpose, we decompose the surface brightness
profiles of the BCDs into
the luminosity contribution of the starburst component
and that of their underlying low surface brightness (LSB)
host. The latter dominates the stellar mass of the BCD. We find
that the LSB-components of the Virgo BCDs are structurally
compatible with the more compact half of the Virgo early-type
dwarfs, except for a few extreme BCDs. Thus, after termination of
starburst activity, the BCDs will presumably fade into galaxies
that are structurally similar to ordinary early-type dwarfs. In
contrast, the irregulars are more diffuse than the BCDs and are
structurally similar to the more diffuse half of the Virgo
early-type dwarfs. Therefore, the present-day Virgo irregulars are
not simply non-starbursting BCDs.
If starbursts in cluster BCDs are transient phenomena with a
duration of 100 Myr or less, during which the galaxies could
not travel more than 100 kpc, then a substantial number of
non-starbursting counterparts of these systems must populate the
same spatial volume, namely the Virgo cluster outskirts. The
majority of them would have to be early-type dwarfs, based on the
abundance of different galaxy types with similar colours and
structural parameters to the LSB-components of the BCDs. However,
most Virgo BCDs have redder LSB-host colours and a less prominent
starburst than typical field BCDs, preventing a robust conclusion
on possible oscillations between BCDs and early-type dwarfs.
Key Words.:
Galaxies: dwarf – Galaxies: evolution – Galaxies: photometry – Galaxies: starburst – Galaxies: clusters: individual: Virgo1 Introduction
Galaxy clusters like the Virgo cluster are characterised by a wide variety in galaxy morphology. This morphological variety depends on the local galaxy density, and therefore shows a clear trend with the clustercentric distance, as was first revealed by Dressler (1980) and confirmed by many subsequent studies (e.g. Binggeli et al., 1990; Jerjen, 2012). At low clustercentric distances the dominant galaxy types are early-type galaxies (ETGs): elliptical (E) and lenticular (S0), dwarf elliptical (dE), dwarf lenticular (dS0), and dwarf spheroidal (dSph) galaxies, spanning a range from high to low luminosities. Traditionally, ETGs are associated with a smooth, regular appearance and no signs of star formation. However, the structural characteristics of early-type dwarfs have recently been shown to be unexpectedly complex (Janz et al., 2012, 2013). Furthermore, they comprise a particular subclass of galaxies with relatively blue cores, which indicate recent or still ongoing low-level star formation at very low star formation rates (e.g. Lisker et al., 2006b).
Studies of ETGs have shown that they have the oldest luminosity-weighted stellar ages among galaxies in clusters, resulting in red colours. On the other hand, dynamically young galaxy clusters (e.g. the Virgo galaxy cluster) also contain late-type galaxies, which in contrast to the ETGs, are located at greater clustercentric distances. At low luminosities, these comprise star-forming dwarf galaxies such as blue compact dwarfs (BCDs) and irregulars. As shown by Vilchez (1995), the H equivalent width (EW) of late-type galaxies in the Virgo cluster increases with increasing distance from the center, echoeing the strong impact of the cluster environment on galaxy evolution. For this and other reasons, it has become a common hypothesis that late-type galaxies may be environmentally transformed to early-type dwarf galaxies (e.g. Kormendy, 1985; Boselli & Gavazzi, 2006).
Tempting questions in this respect are i) how could the morphology-density relation be explained, ii) which mechanisms are responsible for the gradual transformation of late-type galaxies into ETGs as one approaches the cluster center, and iii) are the descendants of today’s low-mass late-type galaxies structurally compatible with early-type dwarfs in the Virgo cluster? In the literature several mechanisms have been proposed as drivers of galaxy transformations within the dense cluster environment, most notably ram pressure stripping (Gunn & Gott, 1972), tidal stirring (Mayer et al., 2001) and harassment (Moore et al., 1996; Mastropietro et al., 2005), all of which have the removal of gas in common (see e.g. Hensler, 2012, for a recent review).
Dwarf galaxies with a low central stellar density , such as irregulars, are expected to be particularly prone to gas removal when they plunge into the hot intracluster medium (ICM), whereas high- systems, such as BCDs (e.g. Papaderos et al., 1996b), might be able to retain some fraction of their gaseous reservoir down to a lower clustercentric distance. But what would these dwarfish late-type galaxies in the cluster periphery look like after some billion years, once their gas has been removed, in the course of one or several passages through the dense ICM core and their ensuing long passive photometric evolution? Addressing this question is fundamental to understanding the morphological diversity of the dwarf galaxy population in clusters. Another issue of special interest is what impact the initial contact of late-type dwarfs with the cluster periphery has on their star formation activity and whether, for certain conditions, starbursts can be ignited, transforming them into BCDs. If so, then how do these cluster-BCDs differ from the main population of field BCDs in their recent star formation history and the morphological properties of their star-forming component?
BCDs are low-luminosity galaxies () with a compact optical appearance and blue integral colours (Thuan & Martin, 1981). Many studies over the past decades have shown that BCDs are metal deficient with a median oxygen abundance of (see e.g. Kunth & Östlin, 2000, for a compilation of literature data) and a low percentage of systems with a gas-phase metallicity as low as (Searle & Sargent, 1972; Izotov et al., 1999; Kunth & Östlin, 2000; Kniazev et al., 2004; Papaderos et al., 2008). Various lines of evidence consistently suggest that these systems (XBCDs111The X indicates the extreme properties of these BCDs.) have formed most of their stellar mass at late cosmic epochs. They are therefore the best nearby analogues of young low-mass galaxies in the early Universe (see e.g. the discussion in Papaderos et al., 2008). Apart from their low metallicity, BCDs also exhibit strong bursts of star formation, which are fed by a relatively large amount of gas (Thuan & Martin, 1981; Staveley-Smith et al., 1992; van Zee et al., 1998). Various arguments suggest, in line with evolutionary synthesis models, that starbursts in typical field BCDs do not last longer than yr (Thuan, 1991; Krüger et al., 1995; Mas-Hesse & Kunth, 1999; Thornley et al., 2000) and have to be separated by long (1 Gyr) quiescent phases. Dwarf irregulars, on the other hand, are characterised by prolonged low-level star formation that lasts 450 Myr up to 1.3 Gyr, as shown by, e.g., McQuinn et al. (2010) through colour-magnitude studies of 20 of these systems.
The seminal study by Loose & Thuan (1986a) has shown that BCDs are composed of two main stellar components. The first one comprises the region of the ongoing star formation where young OB-stars dominate, and which therefore has a low stellar mass-to-light ratio (M/L). Due to the simultaneous formation of new massive stars in the starburst and their death within a few Myr, metal-enriched galactic winds driven by multiple supernova explosions are expected to influence the chemical evolution of BCDs. However, studies have shown that in most cases starburst-driven feedback is insufficient for the expulsion of the entire ISM from a BCD (e.g. Silich & Tenorio-Tagle, 1998; Ferrara & Tolstoy, 2000; Tajiri & Kamaya, 2002; Recchi & Hensler, 2006).
The starburst component contributes, on average, 50% of the optical emission of a BCD and, in some cases, up to % (Papaderos et al., 1996b; Noeske, 1999; Cairós et al., 2001b; Amorín et al., 2009). Quite importantly, in several XBCDs nebular emission has been determined to be extraordinarily intense ( Å) and to contribute 30–50% of their total optical luminosity (Papaderos et al., 1998, 2002), in line with theoretical predictions for young starbursts (e.g. Krüger et al., 1995).
The second component of BCDs is dominated by an old population of low-mass stars. This component is referred to in the following as the host galaxy or low-surface brightness (LSB)222Note: The LSB-component of BCDs should not be mixed up with the galaxy type commonly called “Low Surface Brightness galaxies”. To the contrary, a high central surface brightness (22 mag/arcsec2) has been found to be a characteristic property of the LSB-host of BCDs (Papaderos et al., 1996a; Gil de Paz & Madore, 2005) implying a higher central mass density than in typical irregulars, and the more so, in dSphs and genuine ( mag/arcsec2) LSB galaxies. component and is characterised by a high stellar M/L. Various studies indicate that the LSB-component dominates the baryonic-, and in some cases even the virial mass of BCDs within their Holmberg radius.333The Holmberg radius defines the radius where mag/arcsec2. Therefore, it has to have a significant influence on the gas collapse characteristics and the starburst activity in these systems (e.g. Papaderos et al., 1996a; Östlin et al., 1999; Elmegreen et al., 2012; Lelli et al., 2012; Micheva et al., 2013).
| Subtype | Description |
|---|---|
| nE | nuclear star-forming region and |
| elliptical LSB-component | |
| iE | irregular star-forming region(s) |
| and elliptical LSB-component | |
| iI | irregular star-forming region(s) |
| and LSB-component | |
| iI,C | iI with cometary shape |
| i0 | no detected LSB-component |
According to Loose & Thuan (1986a, b), BCDs can be classified in four main subtypes, based on the morphology of their star-forming and LSB-component (Table 1; see Salzer et al. 1989, Telles et al. 1997, Cairós et al. 2001a and Sung et al. 2002 for alternative classification schemes.). Nuclear-elliptical (nE) and irregular-elliptical (iE) BCDs are both characterised by an extended circular or elliptical LSB-component, while BCDs with an irregular LSB-component are classified “iI”. A recent study by Zhao et al. (2013) found that iI-type BCDs are on average more gas-rich and metal-poor than nE/iE-type BCDs. Interestingly, the cometary (iI,C) subtype (see e.g. Noeske et al., 2000, for two nearby examples) is remarkably common among XBCDs (Papaderos et al., 2008), a fact pointing to a connection between gas-phase metallicity, morphology and evolutionary status. This is also indirectly suggested by the high frequency of cometary galaxies (also referred to as tadpoles) among comparatively unevolved high-z galaxies (e.g. Elmegreen & Elmegreen, 2010).
Cometary morphology in field XBCDs has been proposed to result from unidirectional sequential star formation activity with a typical velocity of the sound speed in the warm ISM (20 km/sec, Papaderos et al., 1998, 2008). This scenario is supported by stellar age gradients along the “comet’s tail” (e.g. Guseva et al., 2003). In the cluster periphery, however, cometary morphology may arise from extranuclear star formation that is triggered through the interaction with the ICM (see Hensler, 2012, for a recent review), as, e.g. the impressive cases of two star-forming dwarf galaxies in Abell 1367 (Gavazzi et al., 2001) demonstrate.
The evolution of star-forming dwarf galaxies like BCDs to “red and dead” early-type galaxies is still under debate and there is no satisfying answer yet. Early studies by Thuan (1985) and Davies & Phillipps (1988) introduced the idea of a possible evolution of irregulars to BCDs in several bursts and finally, after reaching a higher metallicity and the depletion of gas, the fading to early-type dwarfs. Thuan (1985) concluded that the metallicities of BCDs and early-type dwarfs are very different and that only periods of three to ten bursts over the Hubble time could be able to produce the metallicity range of early-type dwarfs. The study of Marquart et al. (2007) on the BCD He 2-10 showed that the stars in this galaxy have random motions and show signatures of a merger. They concluded that, due to the velocity dispersion of the stars, in the future this BCD may evolve into a nucleated early-type dwarf. In comparison to this, the simulations of Bekki (2008) showed that dwarf-dwarf mergers are able to produce BCDs, but the further evolution of these BCDs into gas-free dwarfs would require additional influence to remove the extended gas discs of the simulated BCDs.
In contrast to BCDs, early-type dwarf galaxies typically show almost no evidence for ongoing star formation. However, several studies (e.g. Vigroux et al. 1984, Gu et al. 2006, Lisker et al. 2006b) found early-type dwarfs with blue colours in their central region, indicating recent or ongoing star formation, partly with post-starburst spectra that may hint at a population of recent arrivals to the cluster environment (Gavazzi et al., 2010). Among 476 early-type dwarfs in the Virgo cluster, Lisker et al. (2006b) identified 23 galaxies with blue centers and classified them as “dE(bc)”. Since the debate of the evolutionary connection of early-type dwarfs and BCDs is still ongoing, it is worth comparing the structural properties of BCDs to those of early-type dwarfs and in particular to those of dE(bc)s. Can BCDs in the periphery of the Virgo cluster evolve into objects similar to the present-day early-type dwarfs? Would this be different for field BCDs?
This paper is structured as follows: Section 2 defines our sample of cluster BCDs and the classification criteria used. In Section 3 we outline our photometric measurements, with particular emphasis on the decomposition methodology for BCDs. Our results on the structural properties of BCDs and the comparison to early-type dwarfs and irregulars are presented in Section 4. In Section 5, we discuss the results and conclude with an assessment of possible evolutionary connections between the different dwarf types.
2 Sample selection and SDSS data
Our sample is based on the Virgo Cluster Catalog (VCC) by Binggeli et al. (1985), which includes galaxies of all types within the Virgo cluster area. Due to incomplete velocity information for the VCC galaxies, the VCC includes certain and possible cluster members (updated by Binggeli et al., 1993), apart from background galaxies. Since new velocities have become available in the meantime, largely due to the Sloan Digital Sky Survey (SDSS, Adelman-McCarthy et al., 2007), the membership was revised by one of us (T. Lisker, see appendix of Weinmann et al. 2011) using the NASA/IPAC Extragalactic Database444The NASA/IPAC Extragalactic Database (NED) is operated by the Jet Propulsion Laboratory, California Institute of Technology, under contract with the National Aeronautics and Space Administration.. If a galaxy is listed as certain or possible member in the VCC, but has a velocity above 3500 km/s, it is considered as a background galaxy. We do not change possible to certain members or vice versa.
Here we consider both certain and possible members to a magnitude limit of mag, to which the VCC was found to be complete (Binggeli et al., 1985). When applying a constant distance modulus of mag ( Mpc; Mei et al., 2007) to all galaxies, this corresponds to an absolute magnitude limit of mag.
| Amount | Type |
|---|---|
| 38 | “BCD”, “BCD?”, “BCD:”,“BCD or merger” |
| 1 | “pec” “BCD?” |
| 10 | “Im / BCD”, “Im III / BCD”, “Im III / BCD:” |
| “Im III / BCD?”, “Im III,pec / BCD” | |
| 2 | “?” “Im / BCD” |
| 3 | “Spec / BCD”, “Spec,N / BCD” |
| 3 | “Sm III / BCD”, “SBm III / BCD” |
| 1 | “dS? / BCD?” |
| 1 | “Sd / BCD?” |
| 1 | “dS0 or BCD” |
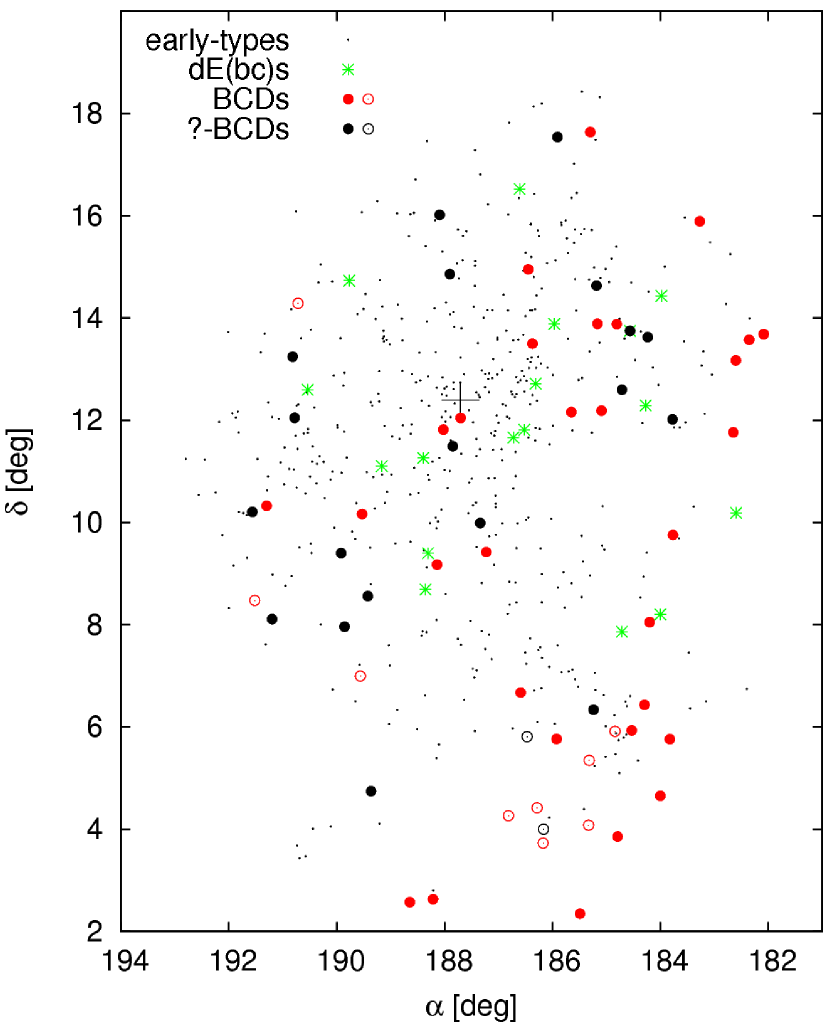
Within these limits, the VCC contains 57 galaxies which have the term “BCD” included in their morphological type, 38 of them with BCD as the only or primary class (Tab. 2). Among the galaxies whose class was “?” and “pec” in the VCC, a visual inspection of the SDSS images666Using the online Image List Tool of the SDSS, http://skyserver.sdss3.org/dr8/en/tools/chart/list.asp . suggests a reclassification of VCC 0429 and VCC 1713 to the mixed type “Im / BCD”, and of VCC 1411 to a possible “BCD?”, thus adding up to 60 galaxies, and 39 with BCD as primary class (Tab. 2). Since the VCC photographic plates were more sensitive in the blue, it needs to be kept in mind that this could have partly influenced the classification, as any underlying red stellar population would appear less prominent in the blue. Therefore, the galaxies with primary class BCD are chosen as the working sample for our analysis, whereas the uncertain BCD candidates are treated as a separate sample that is compared to the BCDs in Section 4.4. Figure 1 shows the distribution of both samples within the Virgo cluster.
Five of the 39 BCDs (VCC 0464, 0468, 0741, 0772, and 0985) were not covered by the SDSS Data Release Five (DR5, Adelman-McCarthy et al. 2007), two were excluded because of a nearby other galaxy (VCC 0340 and 1944), and two were excluded because of a nearby bright star (VCC 1750 and 2033). Our primary working sample thus consists of 30 galaxies. Two of the 21 uncertain BCD candidates (VCC 0737 and 0848) were not covered by the SDSS DR5, leaving us with 19 such objects.
Our photometric study relies on the SDSS DR5 images in u, g, r, i and z, each with an exposure time of 54 s. Due to insufficient sky subtraction of the SDSS pipeline for nearby galaxies of large apparent size (Lisker et al., 2007), we used the sky-subtracted images provided by Lisker et al. (2007). All images were flux calibrated and corrected for Galactic extinction following Schlegel et al. (1998).
3 Surface photometry and BCD decomposition
3.1 Global photometry of late-type and early-type galaxies
The analysis of the sample of ETGs (classes E, S0, dS0, and dE, including dE(bc) ) was performed by Lisker et al. (2007) and Janz & Lisker (2008). In order to obtain global photometric charateristics for the irregulars and for the uncertain BCD candidates, we closely followed the procedure of Lisker et al. (2007), as outlined below, but using the co-added , , and images (Lisker et al., 2006a) to benefit from a higher signal-to-noise ratio. While we also applied this procedure to our primary BCD working sample – yielding global characteristics that include the light from the starburst region – we then proceeded to perform a thorough decomposition of their light profile, as outlined in the following sections. We point out that we did not consider it appropriate to apply a similar decomposition to the irregulars, since these are not clear multi-component objects like the BCDs.
We first determined the circular Petrosian radius (Petrosian, 1976) on the co-added image, using a visual estimate of the galaxy center777Lisker et al. (2007) used so-called asymmetry centering for the early-type dwarfs instead. that aims to reflect the overall light distribution, not only the inner light peak(s) that an irregular may exhibit. We then computed an elliptical shape, i.e. position angle and axis ratio, from the image moments of the enclosed light. This is used to determine a “Petrosian semi-major axis” on elliptical apertures. At , we let the IRAF task ellipse (Jedrzejewski, 1987) determine the isophotal position angle, axis ratio, and centre. With these values, we performed another iteration on deriving as well as position angle and axis ratio . In this process, contaminating objects that do not belong to the galaxy were masked.
We obtained total magnitudes from the flux within on the -band image, which also yielded the values of the half-light semi-major axis and the average surface brightness within . In our figures we show the effective radius,
| (1) |
Colours were obtained from the flux within on the images of the different bands. Photometric errors were derived using equations (3) and (4) in Lisker et al. (2008), based on the signal-to-noise ratio and on estimations of the uncertainties in the sky subtraction and determination of Petrosian radii.
3.2 BCD surface brightness profiles
The luminosity contribution of the starburst in field BCDs amounts, on average, to of the band emission, and in some extreme cases reaches up to (Papaderos et al., 1996b; Noeske, 1999; Salzer & Norten, 1999; Amorín et al., 2009). On the other hand, the starburst component is almost negligible, in terms of its fraction by mass, as its stellar M/L is several times lower than that of the LSB-component. An adequate separation of its emission via 1D or 2D decomposition is clearly necessary for isolating the emission and studying the structural properties of the host galaxy. Indeed, the composite surface brightness profile of a BCD holds little insight into the photometric structure prior to decomposition. For example, Papaderos et al. (1996b) have pointed out that the profile of a nE-type BCD can closely resemble the steep inner profile of a giant elliptical, whereas a typical feature of iE-type BCDs is an extended plateau. Similarly, the effective radius can vary by up to a factor 3 depending on the starburst luminosity fraction (cf. Papaderos et al., 2006).
For galaxies with a smooth appearance like elliptical galaxies the easiest way to obtain surface brightness profiles is to use elliptical apertures and sum up the enclosed flux. Due to the irregular morphology of BCDs, however, such an approach is impractical, on the one hand because the choice of the ’galaxy centre’ is subjective and wavelength-dependent, and, on the other hand, because profiles derived in this way show, in the case of iE- and iI-BCDs, discontinuous jumps. In some cases, the latter can significantly affect the profile of the LSB-component, thereby biasing studies of the photometric structure of BCDs. 2D axisymmetric models to BCDs other than those falling into the nE class also yield systematic residuals, unless one carefully masks out and avoids fitting of the star-forming component, as was done in e.g. Amorín et al. (2009).
With these considerations in mind, we therefore applied method iv of Papaderos et al. (2002), which was also used by Noeske et al. (2006) under the name LAZY. This method, which has as input a set of co-aligned multi-band images of the same pixel scale (SDSS: 0.396 arcsec/pix) and point spread function (PSF), does not require a choice for the ’centre’ of a galaxy. In our study, an average FWHM of the PSF of 4 pix (1.584 arcsec) was applied to smooth the input images with a Gaussian convolution kernel. From these co-aligned images a S/N weighted average image (called reference frame) is created, which is used to calculate a mask for each intensity interval within the range to . Pixels outside the intensity interval of are set to zero, while pixels within the interval are given full consideration. To apply LAZY, it was necessary to remove contaminating sources by replacing their flux with the median flux of the immediate environment.
In the next step, the mask of a given object and intensity interval is multiplied by the image in a given band, and the product’s total flux is computed. The corresponding photometric radius is calculated as
| (2) |
where and are the areas with intensities above and . In the case of multiple star-forming regions the derived in this way corresponds to the sum of their area, a concept which translates into a monotonous increase in radius with decreasing intensity threshold.
3.3 LSB-component: exponential model
To distinguish the starburst from the LSB-component in the galaxies of our primary BCD sample, we use (g-i)-colour profiles. At smaller the (g-i)-colour profile is due to the superposition of the contribution of the young population and the old population of the LSB-component, which results in relatively blue values. At larger the contribution of the starburst component vanishes and the old LSB-component dominates, which results in relatively constant red colours. The radius beyond which the colour index levels off to a red, nearly constant value is referred to as transition radius (Papaderos et al., 1996b; Cairós et al., 2003; Noeske et al., 2003). We used this characteristic radius to define the minimum for fitting an exponential law of the form
| (3) |
to the LSB-component. In units of mag/arcsec2 Equation 3 reads as
| (4) |
where and are the central intensity and central surface brightness of the LSB-component, and is its exponential scale length.
3.4 LSB-component: inner flattening
In some cases the extrapolation of the exponential fit to =0 arcsec exceeds the intensity observed at intermediate and small radii. This implies that the exponential law is not applicable in the central part of the LSB-component and must flatten to a central surface brightness that is fainter than the extrapolated value of the fit for . This type of outer exponential profile with a flat core was noticed by Binggeli & Cameron (1991) for early-type dwarfs, who have called them type V. Papaderos et al. (1996b) introduced a modified exponential law to approximate such profiles, motivated by two considerations: Firstly, a Sérsic law with cannot fit type V profiles without producing systematic residuals (see Noeske et al. 2003 for a detailed discussion of this subject). Secondly, as shown by radiation transfer models by Papaderos et al. (1996b), a Sérsic law with implies an extended ’hole’ in the intrinsic luminosity density of a spherically symmetric emitter, if radiation isotropy, and a uniform M/L ratio and intrinsic extinction are assumed. As these authors considered the evacuation of the dwarf galaxy centres to be improbable, they introduced an intensity profile for which the intrinsic luminosity density increases monotonously with decreasing radius (for small flattening parameters; see below) and has a finite central value. This modified exponential fitting law (modexp) has the form
| (5) |
where
| (6) |
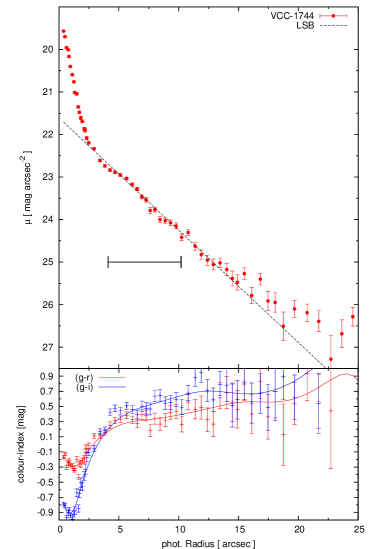
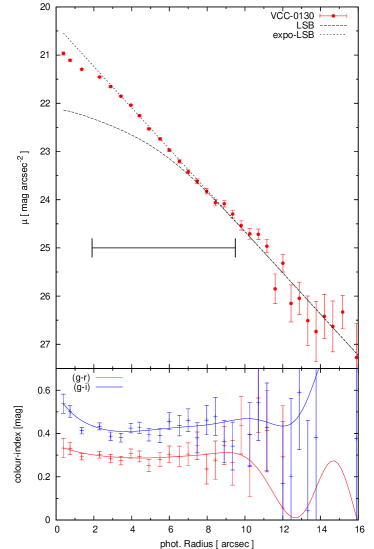
with the typical ratio b/q being of the order of three (Papaderos et al., 1999 and Papaderos & Östlin, 2012). The parameter b is a measure of the radial extent of the central core in units of the exponential scale length , and describes the attenuation of the modexp fit, as compared to the central intensity predicted by the pure exponential fitting law. Due to the poor knowledge of the structure of the LSB-component in its central part it is not clear at the moment which parameter combination of (b,q) satisfactorily describes the original shape. Therefore, the choice of (b,q) is not a straightforward task and has to rely on plausibility considerations (cf. Noeske et al., 2003). In this study we chose , by which the total magnitude of the LSB-component becomes mag fainter and is reduced by as compared to the purely exponential LSB-component. Since this magnitude offset is applied to all filter bands, the integrated colours of the LSB-components are not affected. We apply such a flattening only when exceeds the total central surface brightness and the spectrum shows clear signs of star formation. This is only the case for three BCDs (VCC 0074, 0130, and 0641), and is exemplified in Fig. 2 for VCC 0130.
3.5 LSB-component: outer tail
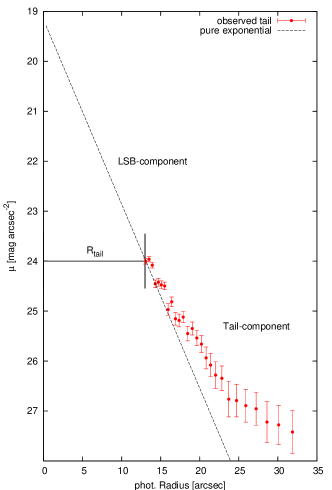
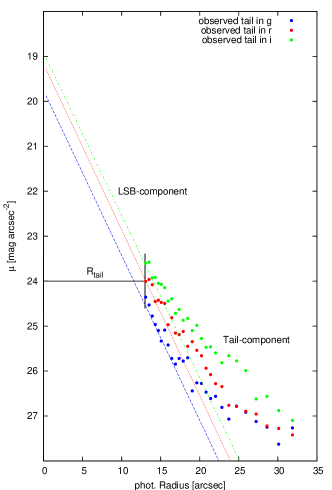
The inspection of the surface brightness profiles of our BCD sample reveals that in many cases the profile of the LSB-component flattens out at large radii. This is illustrated in Fig. 3 for VCC 0001, and is also clearly visible in Fig. 2 for VCC 1744 for radii arcsec. We note that such a flattening has been reported in the outskirts of some BCDs, e.g. II Zw 71 and Mrk 178, where it was found to contribute no more than 3% of the total luminosity Papaderos et al. (2001) and Papaderos et al. (2002). For some of our sample galaxies, however, already a quick estimate based on the surface brightness profile reveals a significant contribution (10% for VCC 1744, see Fig. 2). Since this leads to an increase in the derived effective radius, and since we will discuss in Section 4 whether BCDs are smaller in size than early-type dwarfs, we cannot neglect this systematic effect on the radius.
In the following, we will call the radius where the observed profile of the LSB-component starts deviating from a pure exponential slope tail radius (Fig. 3). The exponentially fitted LSB-component was integrated up to and was then continued with the observed data points of the tail. From this LSB+tail profile – also taking the possible inner flattening into account – we derive the Petrosian radius (Petrosian, 1976; Graham & Driver, 2005), where the intensity drops to a fifth of the mean intensity within that radius (Blanton et al., 2001; Yasuda et al., 2001).
LAZY, just like all surface photometry codes, is very sensitive to the quality of the sky subtraction and the objective selection and removal of fore/background sources. Especially in the faint extended outskirts of a galaxy, this can be difficult and may introduce additional uncertainties. To overcome this problem the parameters of the LSB-component were derived with LAZY only for , and were subsequently corrected for the missing flux. The latter was estimated by integrating the SDSS images from out to two Petrosian radii, using elliptical apertures (see Section 3.1), masking contaminating sources, and correcting for the missing flux of these masked patches. This analysis resulted in a correction value for the missing flux, such that the total flux of the LSB-component becomes
| (7) |
The colours of the LSB-components were determined from the corrected total flux in the different bands. The effective radius was derived in the -band by the integration of the combined LSB profile (inner flattening, exponential section, outer tail) to the radius within which half of the total flux is enclosed. The mean effective surface brightness was calculated as
| (8) |
3.6 LSB-component: error estimation
The errors in our determination of magnitude and effective radius of the LSB component were estimated from a set of artificial BCD images, which we created based on the parameter range of the observational sample. These images consist of LSB-components with various profile shapes and a superposed starburst component with various strengths. They were analysed in the same manner as the Virgo BCDs, allowing us to compare input and output parameters. Details are given in Appendix A.
The analysis of the artificial images reveals statistical errors of mag in , in , and mag/arcsec2 for . For the fainter BCDs of our sample, the radii derived with our method are somewhat smaller (11%) than the true values, and the magnitudes are systematically brighter ( mag). These add up to a systematically brighter effective surface brightness by mag/arcsec2 for the fainter BCDs. In the following figures we indicate the statistical errors with representative error bars and the systematic offsets with arrows pointing from the center of these error bars to the true value.
3.7 Decomposition examples
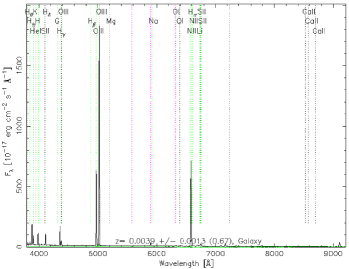
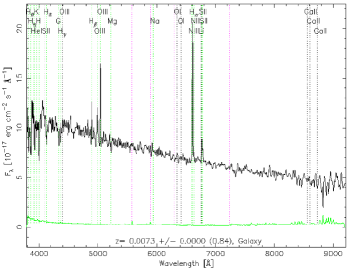
We illustrate our decomposition with two examples in Fig. 2. VCC 1744 (left) shows a very strong star-forming region, which is off-centred. On the other hand, the star-forming regions in VCC 0130 (right) spread over the entire galaxy, resulting in an irregular LSB-component. The SDSS spectrum of VCC 1744 shows very strong emission lines, as is typical for BCDs. VCC 0130 also shows emission lines and a rising blue continuum, but these emission lines are not as strong as in VCC 1744.
The transition radius of VCC 1744 – where the colours are becoming roughly constant, or the slope of the colour profile changes – is (see the colour profile). At smaller radii the starburst region starts to dominate. By extrapolating the exponential slope of VCC 1744 to arcsec one obtains a central surface brightness of , two magnitudes fainter than the value when including the starburst region.
In contrast, the profile of VCC 0130 shows that a pure exponential approximation of the LSB-component would overestimate the central surface brightness of the LSB-component. Therefore, we assume a central flattening and obtain , which by construction (see the modexp fitting function in Section 3.4) is mag/arcsec2 fainter than the unmodified profile. Since the optical image of VCC 0130 does show several star-forming regions, we consider the application of an inner flattening for separating the LSB and starburst component to be justified, even though the galaxy’s colour profile is rather flat.
4 Results
| VCC | ms | LSB | Flattening | D [Mpc] | |||||||||
|---|---|---|---|---|---|---|---|---|---|---|---|---|---|
| 0001 | 2 | nE | 0 | 0.881 | 0.873 | -16.32 | -16.27 | 0.38 | 0.40 | 20.16 | 20.30 | 32.0 | -17.75 |
| 0010 | 1 | iE? | 0 | 0.735 | 0.754 | -16.09 | -15.87 | 0.37 | 0.42 | 20.36 | 20.84 | 32.0 | -17.52 |
| 0022 | 1 | nE | 0 | 0.638 | 0.734 | -15.45 | -15.30 | 0.39 | 0.42 | 21.07 | 21.42 | 32.0 | -16.89 |
| 0024* | 2 | nE | 0 | 0.695 | 0.765 | -16.24 | -16.01 | 0.36 | 0.42 | 20.12 | 20.69 | 32.0 | -17.68 |
| 0074 | 1 | nE | 1 | 0.736 | 0.765 | -15.23 | -14.71 | 0.59 | 0.77 | 22.22 | 23.29 | 17.0 | -15.30 |
| 0130 | 1 | iI | 1 | 0.417 | 0.400 | -14.65 | -14.24 | 0.36 | 0.44 | 21.73 | 22.56 | 17.0 | -14.72 |
| 0144 | 2 | iE | 0 | 0.149 | 0.249 | -16.51 | -15.97 | 0.25 | 0.34 | 19.08 | 20.26 | 32.0 | -17.94 |
| 0172 | 1 | iI | 0 | 0.489 | 0.743 | -16.82 | -16.30 | 0.84 | 1.07 | 21.39 | 22.42 | 32.0 | -18.25 |
| 0207 | 1 | iI | 0 | 0.271 | 0.215 | -14.57 | -14.19 | 0.21 | 0.26 | 20.67 | 21.50 | 32.0 | -16.01 |
| 0223 | 1 | nE? | 0 | 0.623 | 0.758 | -15.37 | -15.01 | 0.32 | 0.41 | 20.74 | 21.63 | 32.0 | -16.81 |
| 0274 | 1 | iI | 0 | 0.473 | 0.622 | -14.40 | -14.34 | 0.55 | 0.60 | 22.87 | 23.13 | 32.0 | -15.84 |
| 0324 | 1 | i? | 0 | 0.476 | 0.630 | -17.46 | -17.25 | 0.96 | 1.17 | 21.03 | 21.68 | 17.0 | -17.52 |
| 0334* | 2 | iE | 0 | 0.526 | 0.698 | -16.02 | -15.72 | 0.43 | 0.54 | 20.74 | 21.53 | 17.0 | -16.08 |
| 0410 | 2 | iI,C | 0 | 0.294 | 0.460 | -14.42 | -14.31 | 0.30 | 0.31 | 21.53 | 21.70 | 17.0 | -14.48 |
| 0428 | 2 | iI | 0 | -0.049 | 0.164 | -14.41 | -14.32 | 0.42 | 0.44 | 22.30 | 22.47 | 17.0 | -14.47 |
| 0459 | 2 | iI | 0 | 0.489 | 0.636 | -16.75 | -16.20 | 0.53 | 0.67 | 20.47 | 21.51 | 17.0 | -16.81 |
| 0513 | 1 | iI | 0 | 0.823 | 0.770 | -16.48 | -16.51 | 0.49 | 0.56 | 20.55 | 20.83 | 17.0 | -16.54 |
| 0562 | 2 | iI | 0 | 0.316 | 0.399 | -15.50 | -15.45 | 0.64 | 0.53 | 22.12 | 21.76 | 17.0 | -15.56 |
| 0641 | 2 | iI | 1 | 0.329 | 0.406 | -15.51 | -15.03 | 0.48 | 0.60 | 21.49 | 22.44 | 23.0 | -16.23 |
| 0802 | 2 | iI,C | 0 | 0.630 | 0.726 | -14.99 | -14.96 | 0.68 | 0.68 | 22.76 | 22.80 | 17.0 | -15.05 |
| 0841* | 2 | iE | 0 | 0.761 | 0.853 | -16.46 | -16.19 | 0.91 | 1.14 | 21.92 | 22.67 | 17.0 | -16.53 |
| 0890* | 1 | iE? | 0 | 0.531 | 0.819 | -15.07 | -14.81 | 0.31 | 0.39 | 20.98 | 21.72 | 23.0 | -15.79 |
| 1141 | 2 | nE | 0 | 0.733 | 0.738 | -15.50 | -15.34 | 0.40 | 0.46 | 21.08 | 21.57 | 23.0 | -16.22 |
| 1313 | 2 | iI | 0 | -0.263 | 0.058 | -14.50 | -13.66 | 0.18 | 0.26 | 20.33 | 22.03 | 17.0 | -14.56 |
| 1411 | 2 | iE | 0 | 0.650 | 0.768 | -16.19 | -16.20 | 0.98 | 1.09 | 22.34 | 22.58 | 17.0 | -16.25 |
| 1437* | 2 | nE | 0 | 0.715 | 0.801 | -16.74 | -16.40 | 0.37 | 0.50 | 19.69 | 20.70 | 17.0 | -16.80 |
| 1459 | 1 | iE? | 0 | 0.762 | 0.820 | -15.22 | -15.21 | 0.65 | 0.72 | 22.44 | 22.67 | 17.0 | -15.28 |
| 1572 | 1 | iE | 0 | 0.769 | 0.914 | -15.79 | -15.57 | 0.91 | 1.06 | 22.58 | 23.14 | 17.0 | -15.86 |
| 1744 | 2 | iI,C | 0 | 0.204 | 0.598 | -14.80 | -14.59 | 0.49 | 0.60 | 22.23 | 22.87 | 17.0 | -14.87 |
| 2015 | 1 | nE? | 0 | 0.655 | 0.771 | -15.49 | -15.36 | 0.60 | 0.66 | 21.99 | 22.33 | 17.0 | -15.55 |
The results of the photometric analysis are summarised in Tab. 3. For each BCD values for the entire galaxy and for the underlying LSB-component are given (column [5] to [12]). The membership (ms, column [2]) to the Virgo cluster was adapted from the VCC and later updates (see Section 2). The BCD-classification according to Tab. 1 is given in column [3]. Column [4] indicates whether a flattening towards smaller radii was applied (see Section 3 for more details). Column [14] shows the total absolute magnitude of the entire BCD when applying the distance (column [13]) given by the GOLDMine database999http://goldmine.mib.infn.it/ (Gavazzi et al., 2003). The differences between a distance of 16.5 Mpc and the GOLDMine distance are discussed in detail in Section 5.1.
The structural and colour properties of the BCDs are illustrated in Fig. 4 for the entire galaxies, and in Figs. 5 through 7 for only the LSB-components. As a result of the decomposition, the LSB-components are less compact and redder than the entire galaxies.
4.1 Colour-magnitude diagrams
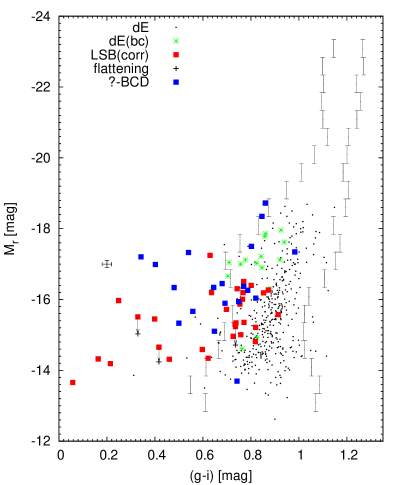
Figure 5 shows the colour-magnitude diagram (CMD)101010This should not be confused with the colour-magnitude diagrams used in the studies of resolved stellar populations. We refrain from using the common term “colour-magnitude relation” (CMR) for Fig. 5, as it may not be clear a priori whether an actual relation exists. of the LSB-components (red squares) of our BCD sample. Galaxies with a profile flattening toward smaller radii are indicated with a black cross and the corresponding change in the magnitude is described by a vector. As mentioned in Section 3.4 the profile flattening parameters are uncertain; therefore, the vector is to be regarded as an aid to the eye, pointing to the locus of the diagram where the true values are expected to be.
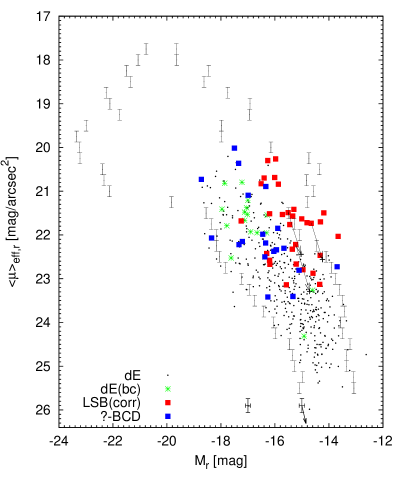
Blue squares show the results for galaxies with an uncertain morphological classification (see also Section 4.4). Additionally, we plot with black dots the early-type galaxies of the Virgo cluster (Janz & Lisker, 2009). According to the VCC these can be divided into the early-type dwarf (dE/dS0) and giant (E/S0) galaxies, based mainly on surface brightness and central concentration of light (Sandage & Binggeli, 1984; Binggeli et al., 1985). In Figs. 5 through 7 the early-type dwarfs are shown in the left panels, while all early types are shown in the right panels. The horizontal -region of all early types is indicated in magnitude or surface brightness intervals by the vertical bars. The green asterisks correspond to dE(bc)s, i.e. early-type dwarfs with a blue core in the centre, taken from Lisker et al. (2006b).
On average the LSB-components of the BCDs are still bluer than the ETG population. The LSB-components of the BCDs show a large interval in colour with an average colour and -scatter of , in contrast to the early-type dwarfs with .
There is a very blue BCD (VCC 1313) at . Such an extremely blue -colour can naturally arise from extended nebular emission, as is the case for the XBCDs SBS 0335-052 E (Papaderos et al., 1998) and I Zw 18 (Papaderos et al., 2002). Extended nebular emission could diminish morphological asymmetries; the structure of VCC 1313 thus needs to be interpreted with some caution. In distant, poorly resolved starburst galaxies, extended emission can easily be mistaken for a stellar disc (Papaderos et al., 2002; Papaderos & Östlin, 2012).
From Fig. 5 it can be seen that the dE(bc)s are slightly offset from all early-type dwarfs on the CMD plot, showing bluer colours with an average value of . The majority of them is brighter than the LSB-components of the BCDs. While focusing on dE(bc)s, Lisker et al. (2006b) also analysed an additional sample of galaxies, which includes some BCDs of our study presented here (marked with “*” in Tab. 3). Due to the sample selection, all BCDs in the sample of Lisker et al. (2006b) show regular elliptical isophotes, corresponding to the nE type.
| Subtype | [kpc] | [kpc] | ||||||
|---|---|---|---|---|---|---|---|---|
| ETG | 0.944 | 0.702 | -16.252 | 2.042 | 1.192 | 0.831 | 22.501 | 1.844 |
| dE | 0.887 | 0.106 | -15.732 | 1.295 | 1.079 | 0.432 | 22.883 | 1.286 |
| dE(bc) | 0.814 | 0.084 | -16.812 | 0.925 | 1.096 | 0.343 | 21.885 | 0.878 |
| BCDs (total) | 0.535 | 0.243 | -15.684 | 0.816 | 0.534 | 0.215 | 21.357 | 0.978 |
| BCDs (LSB) | 0.647 | 0.217 | -15.488 | 0.796 | 0.613 | 0.264 | 21.841 | 0.900 |
| nE (LSB) | 0.760 | 0.051 | -15.637 | 0.548 | 0.545 | 0.144 | 21.562 | 0.787 |
| iE (LSB) | 0.711 | 0.213 | -15.806 | 0.490 | 0.684 | 0.331 | 21.701 | 1.165 |
| iI (LSB) | 0.521 | 0.264 | -15.142 | 0.892 | 0.598 | 0.258 | 22.127 | 0.792 |
| Im | 0.694 | 0.217 | -15.166 | 0.977 | 1.239 | 0.695 | 23.598 | 0.999 |
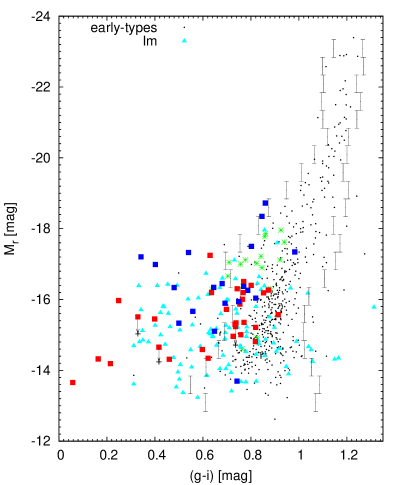
The right hand side of Fig. 5 shows the same CMD but additionally the Virgo irregulars are plotted. No obvious separation between BCDs or irregulars can be found, since they cover nearly the same region in the CMD, also shown by their average colours (Tab. 4; see also Roediger et al. 2011). However, the irregulars tend to have redder colours at fainter magnitudes, with colours comparable to the early-type dwarfs. For the different subtypes of BCDs, the average colours show a tendency for BCDs with regular LSB-components (nE or iE) to be redder than irregular shaped LSB-components (see Tab. 4).
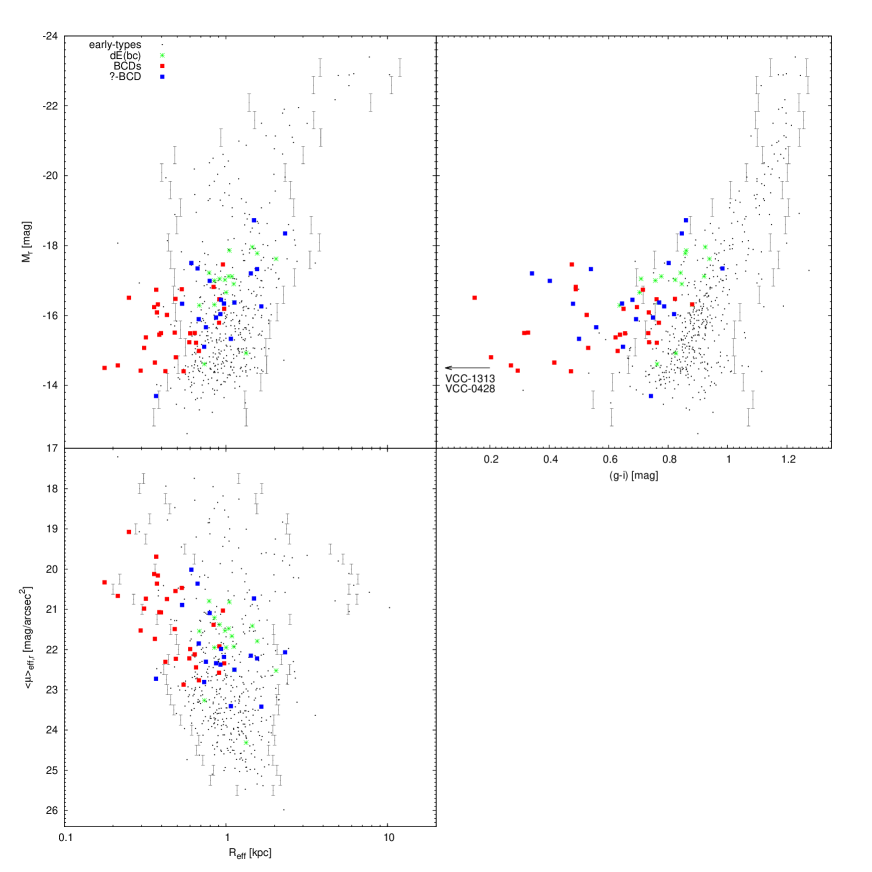
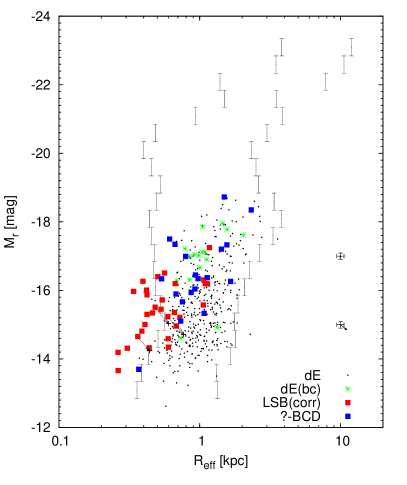
4.2 Sizes of BCDs
Figure 6 shows the effective radius vs. the absolute magnitude (top panels) and the mean effective r-band surface brightness (bottom panels) of the LSB-components and the ETGs. The LSB-components are small in size when compared to the total early-type dwarf population, but partly cover the same region as the compact half of it, and mostly lie within the -region of all early types. Towards brighter the LSB-components become more compact. However, compensating for the systematic errors of the derived parameters would move the fainter LSB-components slightly further towards the early-type dwarf region (black arrow centered on the error bars in the left-hand panels of Fig. 6).
Table 4 summarises the average values of the different subtypes of dwarf galaxies, showing that there are no significant morphological differences between the BCD subtypes. Since nE-BCDs have similarities to the dE(bc)s it could have been expected that their sizes are comparable. However, we find that the nE-BCDs, as well as the other BCD subtypes, are more compact than the dE(bc)s. The difference would be even slightly larger, if the (central) star-forming component of the dE(bc)s was also excluded for the derivation of their photometric parameters. The effect of this exclusion would, however, be much smaller in the dE(bc)s, since their central star-forming regions contribute less significantly to the total light of the galaxies than is the case for the BCDs. Comparing the LSB-components and the dE(bc)s in the -plane (Fig. 6), one may conclude that dE(bc)s fall into the linear extension of the LSB-components toward larger and brighter magnitudes.
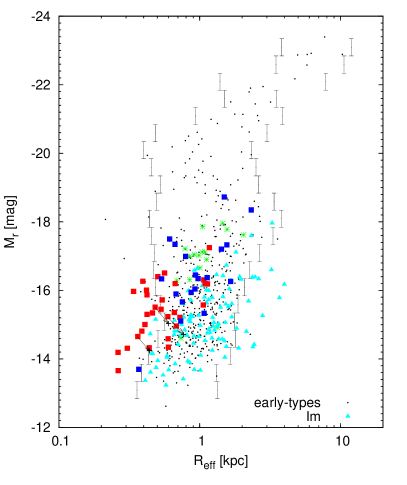
The right hand side of Fig. 6 shows additionally the irregular galaxies. In both diagrams one finds a clear offset of the overall location of LSB-components and irregulars, with a transition region where both types can be found. At a given the LSB-components of BCDs tend to be brighter and have a higher .
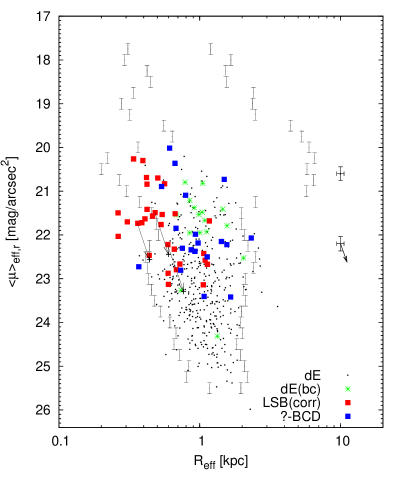
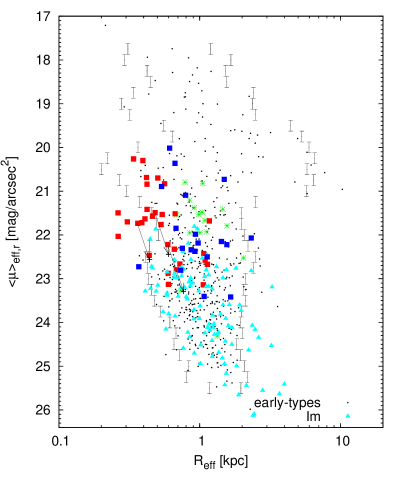
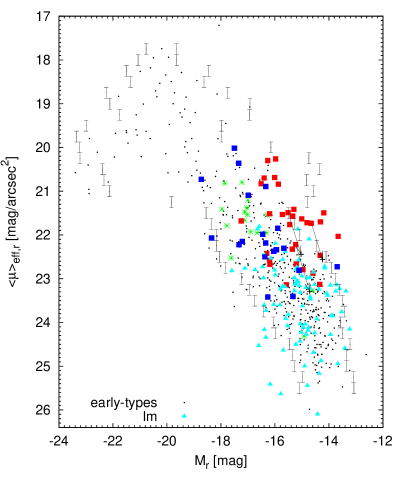
Figure 7 shows the mean surface brightness as a function of the absolute magnitude for the LSB-components and early-type dwarfs on the left-hand side and additionally for the irregulars and all early types on the right-hand side. The BCDs and irregulars show a different average location in this diagram, but both overlap with the early-type dwarfs. Still, several LSB-components are outside the -region of the early-type dwarfs.
4.3 Apparent axis ratio of the LSB-component
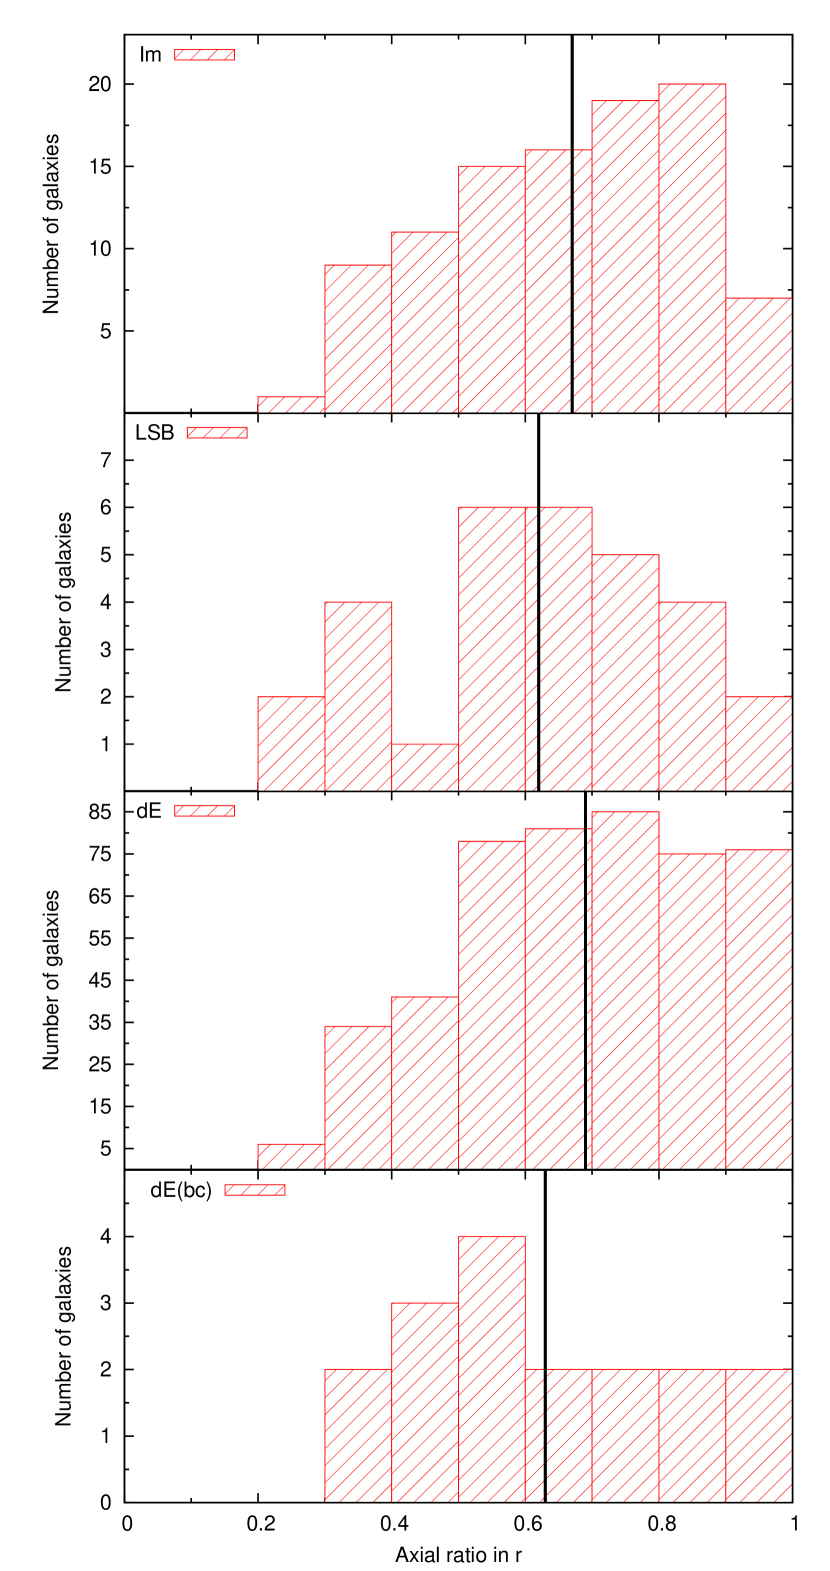
The axis ratios of the LSB-components have a mean value and standard deviation of , compatible with the mean value of BCDs from Sung et al. (1998) () and very similar to the dE(bc)s (). The mean value of the early-type dwarfs is slightly larger – i.e. they are slightly rounder – with . Similarly, the irregulars have .
Figure 8 shows the distribution of axis ratios of the LSB-components and additionally the distribution of irregulars, early-type dwarfs, and specifically dE(bc)s. While the distribution of the dE(bc)s comes closest to what would be expected from the intrinsic shape of a (thick) disc, i.e. an oblate flattened galaxy, none of the distributions shown differ significantly from each other. In addition to what is displayed in the figure, no noticeable trend with magnitude is found. Thus, no evolutionary connections can be ruled out based solely on the overall shape of the galaxy types.
4.4 Galaxies with uncertain morphological classification
| VCC | Type | new Type | ||||
|---|---|---|---|---|---|---|
| 0135 | Spec / BCD | - | -17.34 | 0.67 | 20.36 | 0.98 |
| 0213 | dS? / BCD? | - | -17.50 | 0.61 | 20.01 | 0.80 |
| 0281* | dS0 or BCD | - | -16.37 | 1.13 | 22.50 | 0.77 |
| 0309 | Im / BCD | Im | -15.33 | 1.07 | 23.41 | 0.50 |
| 0429 | ? | Im / BCD | -15.10 | 0.73 | 22.81 | 0.65 |
| 0446 | Im / BCD: | - | -15.94 | 0.87 | 22.34 | 0.75 |
| 0655 | Spec,N: / BCD | - | -18.73 | 1.49 | 20.73 | 0.86 |
| 1179 | ImIII / BCD | - | -16.34 | 0.97 | 22.18 | 0.64 |
| 1356 | SmIII / BCD | BCD | -16.34 | 0.54 | 20.89 | 0.48 |
| 1374 | ImIII / BCD | - | -16.99 | 0.79 | 21.09 | 0.40 |
| 1427 | Im / BCD: | - | -16.45 | 0.93 | 21.98 | 0.68 |
| 1713 | ? | Im / BCD | -15.66 | 0.75 | 22.30 | 0.56 |
| 1725 | SmIII / BCD | - | -17.33 | 1.56 | 22.22 | 0.54 |
| 1791 | SBmIII / BCD | - | -17.20 | 1.43 | 22.15 | 0.34 |
| 1804 | ImIII / BCD | - | -16.04 | 0.92 | 22.37 | 0.82 |
| 1955 | Spec / BCD | dE(bc)? | -18.35 | 2.33 | 22.07 | 0.85 |
| 1960 | ImIII / BCD? | - | -13.70 | 0.37 | 22.73 | 0.74 |
| 2007 | ImIII / BCD: | - | -15.89 | 0.68 | 21.85 | 0.69 |
| 2037 | ImIII / BCD | Im | -16.26 | 1.66 | 23.42 | 0.79 |
As outlined in Section 2, in addition to our primary working sample there are 21 uncertain BCD candidates in the VCC, 19 of which are covered by the SDSS DR5 (Tab. 5). Using the parameter space () of the BCDs described in the previous sections, as well as the visual inspection of images, we are able to assess whether these galaxies should be reclassified as genuine BCDs or not.
VCC 1374, classified as “Im/BCD”, falls within the and values of the primary BCDs, but is brighter than nearly all of them. It is also not far from the bright end of the irregular galaxies’ locus. However, its appearance is indeed that of an irregular or Sm-type galaxy with strong star-forming regions, hence appropriately described by “Im/BCD”. The relatively small effective radius of kpc is merely a result of its very elongated shape (axis ratio ) implying an edge-on view — the half-light semimajor axis is kpc instead.
For the galaxies VCC 0309 and VCC 2037, also classified as “Im/BCD”, we found that their parameters are in the same region where the irregular galaxies are located, which is also consistent with their visual appearance. We thus suggest to reclassify both as “Im”. For the rest of the galaxies classified as “Im/BCD”, a clear distinction between BCDs and irregulars is not possible, because they are located in the overlap zone between these two types. Their class thus remains unchanged.
There are three galaxies initially classified as “Sm / BCD” and “SBm / BCD”, respectively. VCC 1356 is located in the same parameter region as the BCDs, consistent with its visual appearance. We thus suggest to reclassify it to “BCD”. VCC 1725 and VCC 1791 do not show a clear alikeness or separation from the BCDs; their class remains unchanged.
The galaxy VCC 0281 was taken from the early-type sample of Janz & Lisker (2009) and was classified in the VCC as “dS0 or BCD”. It was also described by Lisker et al. (2006b) as a dE(bc). In the -plane, VCC 0281 falls into the same region as several of the brighter BCDs. However, it lies at the edge of the structural parameter range of the BCDs, and well inside the early-type dwarf regime. We thus refrain from a reclassification.
The classification of VCC 0135, 0655, and 1955 (“Spec/BCD”), as well as VCC 0213 (“dS?/BCD?”), implies the presence of hints for spiral structure. Indeed, VCC 0213 shows spiral structure in the SDSS image, and also for VCC 0135, a weak spiral-like feature is visible. For VCC 0655, an inner ring or spiral-like structure is mimicked by several star-forming knots. No spiral structure can be seen for VCC 1955. In the classification scheme of Sung et al. (2002), they reported that the “Postmerger” BCDs of their sample sometimes showed “spiral structures with a compact off-centred core”. However, to the knowledge of the authors, there is no detailed study about BCDs with spiral structure visible at optical wavelengths. HI observations of BCDs by van Zee et al. (2001) revealed rotation in BCDs, but the optical morphology of the used sample has smooth, symmetrical isophotes.
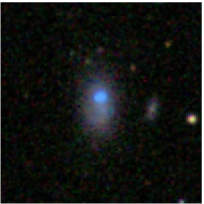
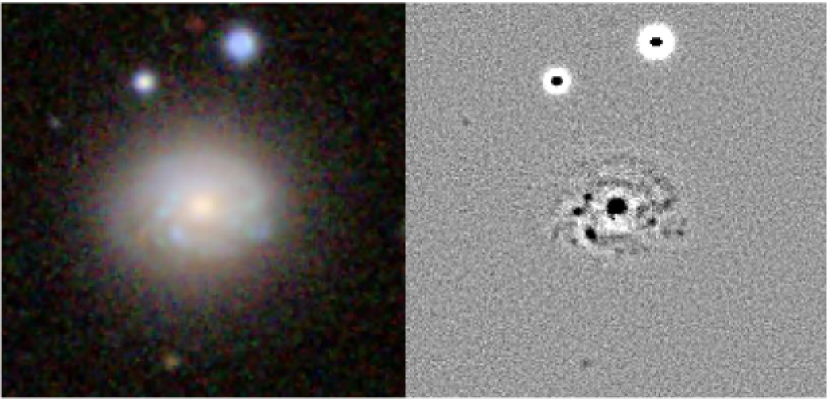
VCC 0213 is located at the bright and red end of the BCD region. In terms of structure, it has similar parameters as the BCDs. Its red core (Fig. 9) seems to contradict the classification as a BCD. The spiral structure, together with the red core – which appears similar to a bulge – might hint at a spiral galaxy with a greater distance than the one of the GOLDMine data base of 17.0 Mpc. However, the heliocentric velocity according to GOLDMine is , which is consistent with being a Virgo member (cf. Fig. 10) and makes it unlikely that the galaxy is a background object. We thus decide to leave its classification unaltered.
VCC 0135 lies at the edge of the structural locus of the brighter BCDs. However, its (g-i)-colours are too red, and its image looks like that of a low-luminosity lenticular or early-type spiral galaxy. The spectrum shows strong emission lines in the center, where blue features can be seen upon detailed inspection of the “core-region”. Therefore, we refrain from changing its classification.
VCC 0655 seems to be too bright ( mag) and too large ( kpc) compared to the BCDs. However, the image displays several star-forming regions in the central part of the galaxy, which are surrounded by a redder stellar host, typical for BCDs. Furthermore, VCC 0655 has some similarities to the well-known BCD NGC 2537 (Mrk 86, “Bear’s Paw Galaxy”). The sample of BCDs in Papaderos et al. (2008) also shows a wide spread in radius from very compact objects up to objects with . Thus, it cannot be ruled out that VCC 0655 is a bright BCD. We refrain, however, from reclassifying it, since deeper observations are needed to undoubtedly judge whether spiral structure is present.
At first glance, VCC 1955 appears similar to VCC 0655, except that its star-forming region is more centrally concentrated. However, its surface brightness is much lower, and in turn it has an even larger effective radius, too large compared to the other BCDs. Given its overall red colour and regular shape, VCC 1955 would qualify as a large-sized dE(bc), i.e. an early-type dwarf with a blue core. We therefore reclassify this object as “dE(bc)?”, but remark that deeper observations might reveal further structural features.
Finally, as mentioned in Section 2, visual inspection of VCC 0429 and VCC 1713 (classified as “?”) suggests a reclassification to “Im / BCD”. Indeed, their parameters fall in the overlap region of BCDs and irregulars. VCC 1411 was reclassified from “pec” to “BCD?” based on visual inspection.
The newly determined morphological types of the galaxies are listed in Tab. 5. For one galaxy (VCC 1356) we suggest a reclassification to a primary BCD class. For three other objects (VCC 309, 1955, and 2037), a unique type could be assigned, instead of a mixed type. All other galaxies indeed show complex properties that can only be described with a combination of two types.
5 Discussion
| Parameter | Certain | Possible | ||
|---|---|---|---|---|
| [mag] | -15.68 | 0.84 | -15.58 | 0.88 |
| [mag] | 0.44 | 0.32 | 0.60 | 0.16 |
| [kpc] | 0.49 | 0.22 | 0.54 | 0.24 |
| 21.15 | 1.10 | 21.47 | 0.83 |
From Tab. 6 it is apparent that various photometric parameters of certain and possible Virgo cluster members agree within . Therefore, in the following discussion no differentiation based on Virgo membership was applied.
5.1 Distance dependence of the results
| Distance | Location in Virgo cluster | m [mag] | |
|---|---|---|---|
| to d=16.5 Mpc | to d=16.5 Mpc | ||
| 17 | E-, N-, S-cloud, A-cluster | 0.06 | 1.03 |
| 23 | B-cluster | 0.72 | 1.39 |
| 32 | M-, W-cloud | 1.44 | 1.94 |
The GOLDMine data base provides individual distances to the BCDs, which can be found in column [13] in Tab. 3. The distances are based on their association with various substructures in the projected Virgo cluster area (Gavazzi et al., 1999). These were defined based on the Tully-Fisher relation (Tully & Fisher, 1977) for a sample of spiral galaxies and the Fundamental Plane (Djorgovski & Davis, 1987) for E/S0 galaxies, revealing separate regions in the parameter space of velocity and distance. Table 7 shows the different distances and the resulting magnitude offsets when adopting the GOLDMine distances instead of Mpc () mag. The factor by which [kpc] changes due to different distances is given by .
Since the allocation of the BCDs to the different substructures of the Virgo cluster only depends on the projected location of the galaxies, the GOLDMine distances can not be taken for granted. For instance, the column depth of the different substructures – and of the main cluster itself – cannot be taken into account.
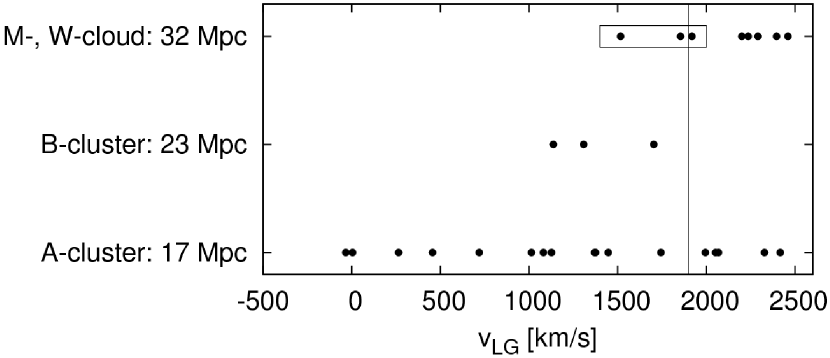
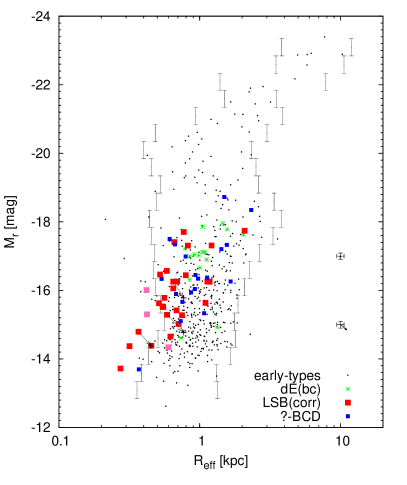
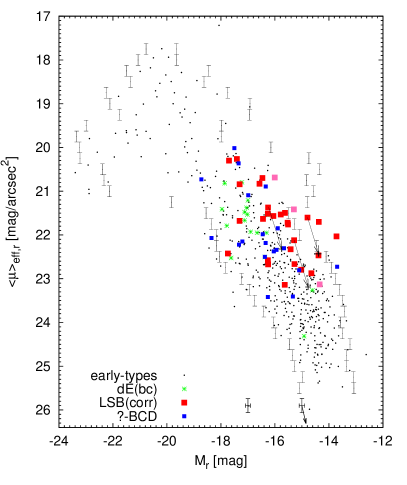
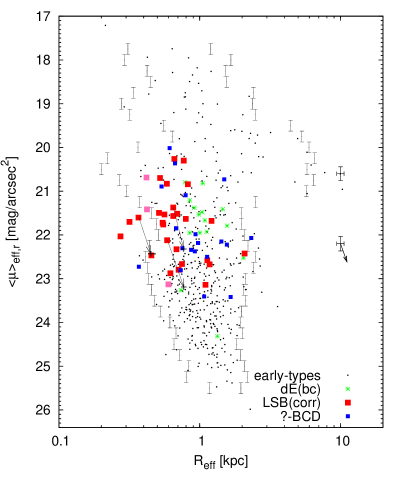
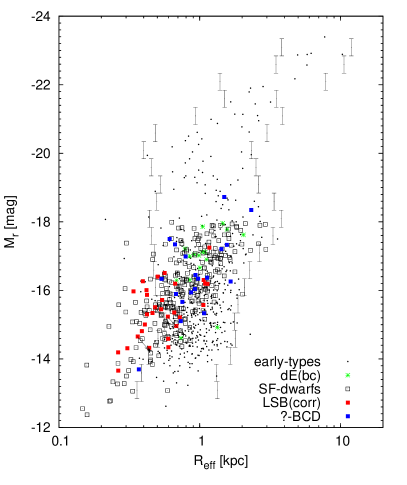
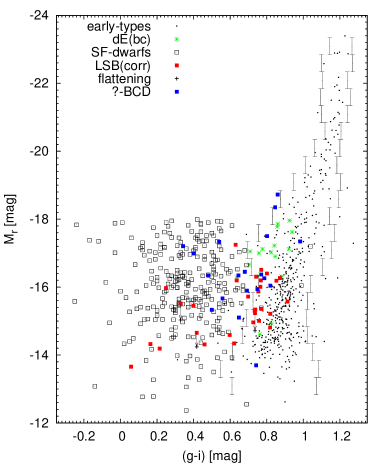
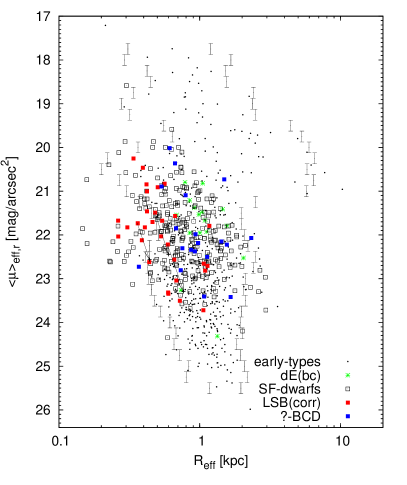
Figure 10 shows the distance of the Virgo BCDs against the velocity with respect to the Local Group (cf. Fig. 5 of Gavazzi et al. 1999), calculated via . The heliocentric velocity was given by GOLDMine. According to Gavazzi et al. (1999) galaxies with belong to the M or W cloud with a distance of 32 Mpc. As one can see, three BCDs (VCC 0022, 0024, and 0274) have a GOLDMine distance of 32 Mpc, but have velocities either below or roughly at . Therefore, we do not assume a distance of 32 Mpc for these galaxies, but instead a distance of 16.5 Mpc.
Figure 11 shows the ()-plots of the analysed galaxies with the GOLDMine distances. Interestingly, there are only three LSB-components of the BCDs that do not fall into the ETGs’ -plane, and these BCDs are classified as “iI” and “iI,C”. One of these three BCDs shows a profile flattening of the LSB-component, shifting it more to the -region of the early types. In the -diagram, there are two additional BCDs outside the -region of early-type dwarfs, for which the above velocity criterion was not fulfilled and thus no greater distance was assigned.
The comparison of the late-type dwarfs (BCD(-LSB) and irregular) and the early-type dwarfs reveals another interesting result. The LSB-components of the BCDs and the irregular galaxies form a continuous sequence, which together shares the same location as the early-type dwarf galaxies. This implies that, structurally, the Virgo BCDs could evolve into early-type dwarfs with small radii once star formation ceases in them. Additionally, Virgo irregulars could form the progenitor population of future early-type dwarfs with large radii. Moreover, it should be pointed out that these findings are dependent on the distance of the galaxies. As seen in Fig. 6, there are more BCDs outside the -region when a constant distance of 16.5 Mpc is adopted. We point out that we have applied the individual GOLDMine distances only to the LSB-components of the primary BCD sample, in order to illustrate the effect on their values. In contrast, this would only have a weak effect on the population of early types: firstly, the vast majority of them are not located in the projected substructure regions that contain galaxies at significantly greater distances, and secondly, those that are located there would be shifted largely along the region that they already populate (cf. Table 7).
5.2 Comparison with other BCDs
| Galaxy | D | ||||||||
|---|---|---|---|---|---|---|---|---|---|
| [arcsec] | [Mpc] | [kpc] | [kpc] | ||||||
| J0133+1342 | 17.9 | -15.0 | 22.1 | 34.7 | 23.22 | 4.63 | 37.8 | 0.85 | 0.89 |
| J1044+0353 | 17.2 | -16.3 | 19.9 | 35.3 | 21.02 | 2.32 | 51.2 | 0.58 | 0.61 |
| J1201+0211 | 17.4 | -13.3 | 22.2 | 32.5 | 23.32 | 6.10 | 14.0 | 0.41 | 0.44 |
| J14140208 | 18.1 | -13.7 | 21.6 | 33.6 | 22.72 | 3.35 | 23.0 | 0.37 | 0.39 |
| J22300006 | 17.0 | -15.0 | 19.8 | 33.8 | 20.92 | 2.43 | 24.9 | 0.29 | 0.31 |
| J2302+0049 | 18.6 | -17.0 | 20.8 | 37.4 | 21.92 | 1.84 | 134.6 | 1.20 | 1.26 |
Table 8 shows the values for a sample of BCDs from Papaderos et al. (2008) (hereafter P08) from the SDSS. All given values of P08 were measured in the SDSS g-band and for a first order approximation we assume that is equal in the g and r filters. As one can see, the effective radii of the P08 sample are also very compact with an average of , but with a large scatter.
Since the BCDs of our study are located in the Virgo cluster, one may ask whether they deviate from BCDs in field and group environments. To investigate this question a large sample of emission-line galaxies in various environments (unpublished study by H. T. Meyer, R. Kotulla, P. Papaderos, Y. Izotov, N.G. Guseva and K.J. Fricke) was used. The galaxies were spectroscopically selected, therefore, also non-dwarf galaxies are included in the initial sample. To include only star-forming dwarf galaxies, a g-band magnitude cutoff of mag was applied, resulting in the sample that we use here for comparison. This sample includes BCDs as well as other types of star-forming (dwarf)141414The applied distances were simply converted from SDSS spectroscopic redshifts, which therefore do not account for possible peculiar velocities, and thus cause uncertainties in the absolute magnitudes and radii. galaxies.
To all galaxies of this comparison sample the same photometric analysis (derivation of profiles and decomposition) was applied. The CMD of the LSB-components of the Virgo BCDs and the comparison sample is shown in Fig. 12. The LSB-components of the Virgo BCDs tend to be redder than those of the comparison galaxies. This could indicate an influence of the denser cluster environment on the Virgo BCDs, making them redder due to the removal of gas. In the structural diagrams of Fig. 12, one can see that the locus of the Virgo BCDs nearly completely overlaps with that of the comparison sample of star-forming dwarf galaxies in the field. The fact that the latter extends to larger effective radii and brighter magnitudes than the Virgo sample may reflect a selection effect. An increase in the sample size of cluster BCDs would therefore be desirable for future investigations.
5.3 Evolutionary connection between different galaxy types
Various observational and theoretical lines of evidence suggest that the evolutionary pathways of late-type dwarfs in a cluster environment have to significantly differ from those in the field. Several mechanisms for starburst ignition in the initial stages of the interaction of a dwarf with the ICM can be envisaged, for example triggered gas collapse by the external ICM pressure (as opposed to gas collapse driven by self-gravity), or strong dissipation and gas cooling in large-scale shocks, followed by collective star formation. For such reasons, it is not even sure that the compact structure of the LSB-component – a typical characteristic of field BCDs – has to be common in systems classified as BCDs in galaxy clusters. For example, external agents (see above) could ignite a BCD-typical starburst in a genuine (that is, relatively diffuse) irregular. Alternatively, an externally triggered destabilisation and inflow of gas could eventually lead to an adiabatic contraction of the LSB-component (Papaderos et al., 1996a), and the opposite may happen after complete removal of the dwarf gas halo, as it sinks deeper into the hostile ICM environment.
Even in the cluster periphery, late-type dwarfs have undergone interaction with the hot ICM and other nearby galaxies for a few hundreds of Myr, a time span on the order of their dynamical timescale. In summary, in a late-type dwarf plunging into the ICM, the starburst that makes it appear as BCD may have a different origin than starbursts in the general population of field BCDs. Consequently, one should be cautious when comparing structural and integral photometric properties of cluster-BCDs with literature data for ordinary BCDs.
As our understanding of the early interaction of late-type dwarfs with the cluster environment is still poor, it would be speculative to generalise conclusions drawn from our Virgo BCD sample to the BCD population as a whole. Nevertheless, the following discussion concentrates on a nearly complete and well-selected sample of cluster BCDs, thereby minimising the potential dilution of any trends that could be caused when combining objects from different environments.
The evolutionary scenario of Davies & Phillipps (1988) describes how a dwarf irregular galaxy can ignite a starburst and become a BCD due to infalling gas from a surrounding reservoir. After several starburst phases and non-starbursting irregular-phases, the galaxy evolves to a passive dwarf galaxy. If this evolution was possible in the Virgo cluster outskirts, we should observe a similar structure of BCDs (the starburst phase) and early-type dwarfs (the end product). While this may serve as a possible evolutionary path from the faint end of the late-type sequence of Kormendy & Bender (2012) to the faint end of the early-type sequence, we note that early-type and late-type galaxies in today’s clusters have spent, on average, a large fraction of their lifetime in different environments (Lisker et al., 2013).
Observational studies of BCDs by Drinkwater & Hardy (1991)151515It should be pointed out that the findings of Drinkwater & Hardy (1991) were based on a particular sample of the most compact BCDs in Virgo. and Papaderos et al. (1996a) reported that BCDs are very compact objects as compared to the early-type dwarfs. They concluded that only the most compact of the latter may be related to the BCDs. An even more extreme conclusion is reached by Drinkwater et al. (1996), who state that “no blue star-forming progenitors of dE galaxies” exist in the Virgo cluster down to an absolute -magnitude of M mag. At first view, these findings seemed to be supported by our photometric measurements for the galaxies’ entire light: Fig. 4 (top left panel) shows that the majority of BCDs are more compact than even the -region of early-type dwarfs at a given magnitude.
However, if the gas reservoir that is immediately available to a BCD’s starburst region is limited, thus restricting the starburst phase to a duration of some 100 Myr or less (Thuan, 1991; Thornley et al., 2000), a population of non-starbursting counterparts must exist within the same spatial volume. Assuming a velocity of 1000 km/s, a BCD could only move some 100 kpc during the starburst phase, i.e. some tenths of the Virgo cluster’s virial radius — which would mean that the outskirts of the Virgo cluster should hold a substantial number of non-starbursting counterparts to BCDs.161616This does not necessarily apply to BCDs that are located at greater distances than the main cluster, which, however, is the minority (Fig. 10). How do these look like?
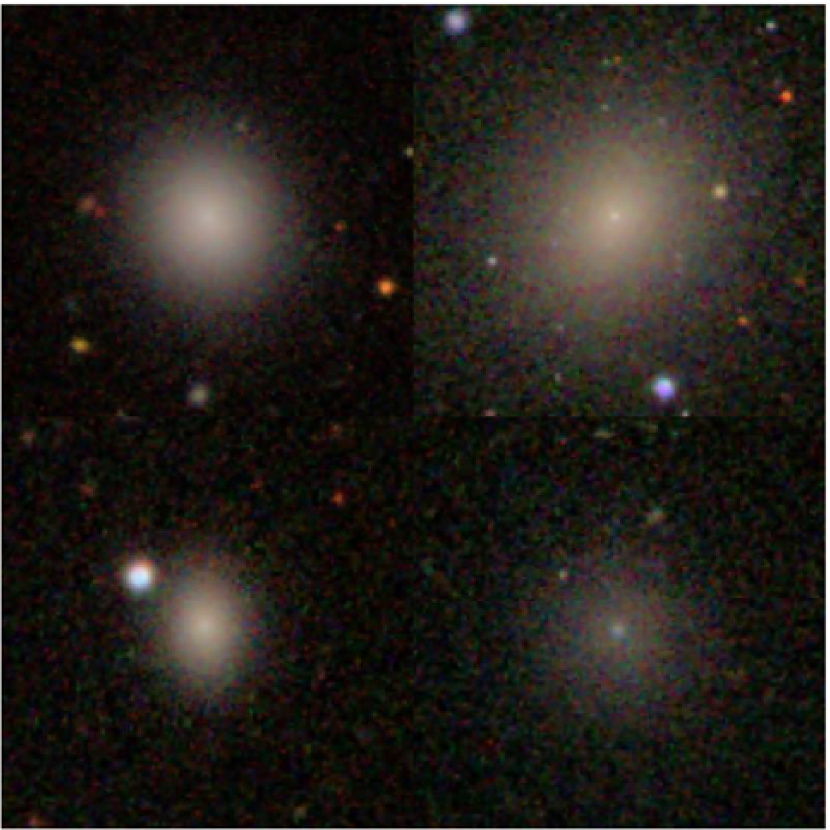
To investigate this, we determined the structural properties of the underlying LSB-component of the Virgo BCDs, i.e. without the contribution of the starburst region. The results already show much more overlap with the early-type dwarfs in the parameter space of structure and also colour (see Figs. 5 and 6). When we also take the different distances of the various parts of the Virgo region into account, the LSB-components turn out to fit remarkably well to the early-type dwarf population with small effective radii (Fig. 11). This is in agreement with the conclusions of Micheva et al. (2013) from deep imaging of a sample of luminous BCDs and intermediate-mass galaxies.The left panels of Fig. 13 show examples for such early-type dwarfs that fall within the locus of the LSB-components: these may look like the future “red and dead” descendants of BCDs. In contrast, the right panels show early-type dwarfs that are more diffuse than the LSB-components, and instead overlap with the irregulars.
As for the two objects (Fig. 14) that remain more compact than the -region of early types in the diagram (Fig. 11), their LSB-component colours are also bluer than the -region of early types. VCC 1313 has hardly any discernible LSB-component within our detection limits. This galaxy seems to follow the literal meaning of the term “blue compact dwarf” (see Fig. 14, right panels), while most of the other Virgo BCDs rather have the appearance of a (sometimes faint) early-type dwarf or irregular with additional starburst. The non-detection of a red LSB-component down to low surface brightness levels for some “extreme” BCDs was already reported by Drinkwater & Hardy (1991): two BCDs in their study had no surrounding low-surface-brightness envelopes detected to a limit of . Therefore, they would be classified as i0-BCDs. For all of these, the Next Generation Virgo Cluster Survey (NGVS, Ferrarese et al., 2012) will provide unprecedented insight into their outer structure and older stellar population, if existent.
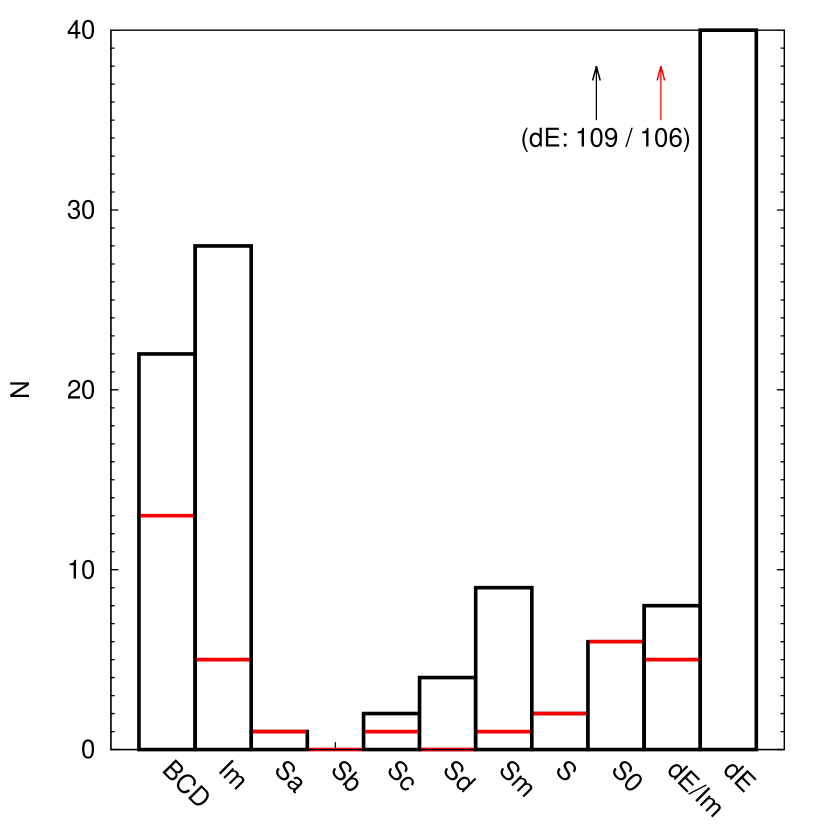
Are early-type dwarfs the only morphological type that qualifies as non-starbursting counterparts of BCDs? Figure 15 shows the number distribution of galaxies in the outer region of the Virgo cluster that fall in the same parameter space of magnitude and mean surface brightness as the majority of the LSB-components of the BCDs, displayed separately for blue and red () galaxies. Among blue galaxies, late-type spirals and especially irregular galaxies (Sánchez Almeida et al., 2008) form a population of significant size. However, the majority of the LSB-components of BCDs is already in the red colour regime (red histogram in Fig. 15), where the early-type dwarfs clearly outnumber all other galaxy types.
Vaduvescu et al. (2006) concluded from a near-infrared analysis of Virgo cluster galaxies, decomposed with a different scheme than the one used in this study,that “BCDs and dIs are similar structurally”, which is incompatible with our conclusions (see Fig. 6). We measure irregulars to be systematically more extended than the LSB-components of BCDs at a given magnitude, hence only a small fraction of the irregulars would qualify as non-starbursting BCDs. Vaduvescu et al. fitted structural parameter relations to irregulars, and claimed consistency of the BCDs with these relations. Their Figs. 4 and 5 show large scatter among their BCD sample, with nine of the 18 BCDs having substantially smaller radii than the relation of irregulars.Among the five BCDs that lie significantly above the relation of irregulars, the three largest ones have been classified as ambiguous types between Sm, irregular and BCD in the VCC, and are more similar to Sm/Im by visual inspection of SDSS colour images. This may provide an explanation for the discrepant findings.
Indications that the Virgo BCDs have already experienced some environmental influence are given by the redder LSB-components of the Virgo BCDs as compared to a large BCD sample from various environments (Sect. 5.2), as well as by the fact that the integrated colours of many Virgo BCDs are not dominated by the starburst component (Fig. 4), consistent with their visual appearance but unlike typical field BCDs (see Sect. 1). Due to these differences, we cannot be certain that the commonly assumed short duration of a BCD’s starburst phase also holds for the Virgo BCDs. If their starbursts are indeed relatively short, then many of the early-type dwarfs in the Virgo outskirts with similar magnitudes must be the non-starbursting counterparts to the BCDs. Unless we are witnessing all BCDs in their very last starburst phase, which seems unlikely, this would mean that a number of early-type dwarfs must be able to re-ignite a starburst.
At first glance, this may seem consistent with the recent or even ongoing star formation in the dE(bc)s of the Virgo cluster (Lisker et al., 2006b), as well as with the interpretation of Hallenbeck et al. (2012) that gas detection in some Virgo early-type dwarfs could imply re-accretion of gas. However, De Looze et al. (2013) recently reported from a Herschel far-infrared analysis that BCDs contain on average more dust than early-type dwarfs with residual star formation (“transition-type dwarfs”), and we find that the dE(bc)s are on average less compact and brighter than the LSB-components of the BCDs (see Fig. 6). Future high-sensitivity comparative studies of the stellar and gas distribution and dynamics in those galaxy types are needed for a conclusive interpretation of their possible evolutionary links.
Acknowledgements.
The authors would like to thank the anonymous referee for helpful suggestions. HTM, TL, and JJ were supported within the framework of the Excellence Initiative by the German Research Foundation (DFG) through the Heidelberg Graduate School of Fundamental Physics (grant number GSC 129/1). HTM was supported by the DFG through grant LI 1801/2-1. JJ acknowledges support by the Gottlieb Daimler and Karl Benz Foundation. PP is supported by Ciencia 2008 Contract, funded by FCT/MCTES (Portugal) and POPH/FSE (EC). He also acknowledges support by the Fundação para a Ciência e a Tecnologia (FCT) under project FCOMP-01-0124-FEDER-029170 (Reference FCT PTDC/FIS-AST/3214/2012), funded by FCT-MEC (PIDDAC) and FEDER (COMPETE). Funding for the SDSS and SDSS-II has been provided by the Alfred P. Sloan Foundation, the Participating Institutions, the National Science Foundation, the U.S. Department of Energy, the National Aeronautics and Space Administration, the Japanese Monbukagakusho, the Max Planck Society, and the Higher Education Funding Council for England. The SDSS Web Site is http://www.sdss.org/. The SDSS is managed by the Astrophysical Research Consortium for the Participating Institutions. The Participating Institutions are the American Museum of Natural History, Astrophysical Institute Potsdam, University of Basel, University of Cambridge, Case Western Reserve University, University of Chicago, Drexel University, Fermilab, the Institute for Advanced Study, the Japan Participation Group, Johns Hopkins University, the Joint Institute for Nuclear Astrophysics, the Kavli Institute for Particle Astrophysics and Cosmology, the Korean Scientist Group, the Chinese Academy of Sciences (LAMOST), Los Alamos National Laboratory, the Max-Planck-Institute for Astronomy (MPIA), the Max-Planck-Institute for Astrophysics (MPA), New Mexico State University, Ohio State University, University of Pittsburgh, University of Portsmouth, Princeton University, the United States Naval Observatory, and the University of Washington.References
- Adelman-McCarthy et al. (2007) Adelman-McCarthy, J. K., Agüeros, M. A., Allam, S. S., et al. 2007, ApJS, 172, 634
- Amorín et al. (2009) Amorín, R., Alfonso, J., Aguerri, J. A. L., Muñoz-Tuñón, C., & Cairós, L. M. 2009, A&A, 501, 75
- Bekki (2008) Bekki, K. 2008, MNRAS, 388, L10
- Bertin & Arnouts (1996) Bertin, E. & Arnouts, S. 1996, A&AS, 117, 393
- Binggeli & Cameron (1991) Binggeli, B. & Cameron, L. M. 1991, A&A, 252, 27
- Binggeli et al. (1993) Binggeli, B., Popescu, C. C., & Tammann, G. A. 1993, A&AS, 98, 275
- Binggeli et al. (1985) Binggeli, B., Sandage, A., & Tammann, G. A. 1985, AJ, 90, 1681
- Binggeli et al. (1990) Binggeli, B., Tarenghi, M., & Sandage, A. 1990, A&A, 228, 42
- Blanton et al. (2001) Blanton, M. R., Dalcanton, J., Eisenstein, D., et al. 2001, AJ, 121, 2358
- Boselli & Gavazzi (2006) Boselli, A. & Gavazzi, G. 2006, PASP, 118, 517
- Cairós et al. (2003) Cairós, L. M., Caon, N., Papaderos, P., et al. 2003, ApJ, 593, 312
- Cairós et al. (2001a) Cairós, L. M., Caon, N., Vílchez, J. M., González-Pérez, J. N., & Muñoz-Tuñón, C. 2001a, ApJS, 136, 393
- Cairós et al. (2001b) Cairós, L. M., Vílchez, J. M., González Pérez, J. N., Iglesias-Páramo, J., & Caon, N. 2001b, ApJS, 133, 321
- Davies & Phillipps (1988) Davies, J. I. & Phillipps, S. 1988, MNRAS, 233, 553
- De Looze et al. (2013) De Looze, I., Baes, M., Boselli, A., et al. 2013, MNRAS
- Djorgovski & Davis (1987) Djorgovski, S. & Davis, M. 1987, ApJ, 313, 59
- Dressler (1980) Dressler, A. 1980, ApJ, 236, 351
- Drinkwater & Hardy (1991) Drinkwater, M. & Hardy, E. 1991, AJ, 101, 94
- Drinkwater et al. (1996) Drinkwater, M. J., Currie, M. J., Young, C. K., Hardy, E., & Yearsley, J. M. 1996, MNRAS, 279, 595
- Elmegreen & Elmegreen (2010) Elmegreen, B. G. & Elmegreen, D. M. 2010, ApJ, 722, 1895
- Elmegreen et al. (2012) Elmegreen, B. G., Zhang, H.-X., & Hunter, D. A. 2012, ApJ, 747, 105
- Ferrara & Tolstoy (2000) Ferrara, A. & Tolstoy, E. 2000, MNRAS, 313, 291
- Ferrarese et al. (2012) Ferrarese, L., Côté, P., Cuillandre, J.-C., et al. 2012, ApJS, 200, 4
- Gavazzi et al. (2003) Gavazzi, G., Boselli, A., Donati, A., Franzetti, P., & Scodeggio, M. 2003, A&A, 400, 451
- Gavazzi et al. (2001) Gavazzi, G., Boselli, A., Mayer, L., et al. 2001, ApJ, 563, L23
- Gavazzi et al. (1999) Gavazzi, G., Boselli, A., Scodeggio, M., Pierini, D., & Belsole, E. 1999, MNRAS, 304, 595
- Gavazzi et al. (2010) Gavazzi, G., Fumagalli, M., Cucciati, O., & Boselli, A. 2010, A&A, 517, A73
- Gil de Paz & Madore (2005) Gil de Paz, A. & Madore, B. F. 2005, ApJS, 156, 345
- Graham & Driver (2005) Graham, A. W. & Driver, S. P. 2005, Publications of the Astron. Soc. of Australia, 22, 118
- Gu et al. (2006) Gu, Q., Zhao, Y., Shi, L., Peng, Z., & Luo, X. 2006, AJ, 131, 806
- Gunn & Gott (1972) Gunn, J. E. & Gott, III, J. R. 1972, ApJ, 176, 1
- Guseva et al. (2003) Guseva, N. G., Papaderos, P., Izotov, Y. I., et al. 2003, A&A, 407, 105
- Hallenbeck et al. (2012) Hallenbeck, G., Papastergis, E., Huang, S., et al. 2012, AJ, 144, 87
- Hensler (2012) Hensler, G. 2012, Morphological Mutations of Dwarf Galaxies, ed. P. Papaderos, S. Recchi, & G. Hensler, 75
- Izotov et al. (1999) Izotov, Y. I., Chaffee, F. H., Foltz, C. B., et al. 1999, ApJ, 527, 757
- Janz et al. (2012) Janz, J., Laurikainen, E., Lisker, T., et al. 2012, ApJ, 745, L24
- Janz et al. (2013) Janz, J., Laurikainen, E., Lisker, T., et al. 2013, ArXiv e-prints
- Janz & Lisker (2008) Janz, J. & Lisker, T. 2008, ApJ, 689, L25
- Janz & Lisker (2009) Janz, J. & Lisker, T. 2009, ApJ, 696, L102
- Jedrzejewski (1987) Jedrzejewski, R. I. 1987, MNRAS, 226, 747
- Jerjen (2012) Jerjen, H. 2012, Dwarf Elliptical Galaxies: United and Divided, ed. P. Papaderos, S. Recchi, & G. Hensler, 133
- Kniazev et al. (2004) Kniazev, A. Y., Pustilnik, S. A., Grebel, E. K., Lee, H., & Pramskij, A. G. 2004, ApJS, 153, 429
- Kormendy (1985) Kormendy, J. 1985, ApJ, 295, 73
- Kormendy & Bender (2012) Kormendy, J. & Bender, R. 2012, ApJS, 198, 2
- Krüger et al. (1995) Krüger, H., Fritze-v. Alvensleben, U., & Loose, H.-H. 1995, A&A, 303, 41
- Kunth & Östlin (2000) Kunth, D. & Östlin, G. 2000, A&A Rev., 10, 1
- Lelli et al. (2012) Lelli, F., Verheijen, M., Fraternali, F., & Sancisi, R. 2012, A&A, 537, A72
- Lisker et al. (2006b) Lisker, T., Glatt, K., Westera, P., & Grebel, E. K. 2006b, AJ, 132, 2432
- Lisker et al. (2006a) Lisker, T., Grebel, E. K., & Binggeli, B. 2006a, AJ, 132, 497
- Lisker et al. (2008) Lisker, T., Grebel, E. K., & Binggeli, B. 2008, AJ, 135, 380
- Lisker et al. (2007) Lisker, T., Grebel, E. K., Binggeli, B., & Glatt, K. 2007, ApJ, 660, 1186
- Lisker et al. (2013) Lisker, T., Weinmann, S. M., Janz, J., & Meyer, H. T. 2013, MNRAS, 432, 1162
- Loose & Thuan (1986a) Loose, H.-H. & Thuan, T. X. 1986a, in Star-Forming Dwarf Galaxies and Related Objects, ed. D. Kunth, T. X. Thuan, & J. Tran Thanh van, 73
- Loose & Thuan (1986b) Loose, H.-H. & Thuan, T. X. 1986b, ApJ, 309, 59
- Marquart et al. (2007) Marquart, T., Fathi, K., Östlin, G., et al. 2007, A&A, 474, L9
- Mas-Hesse & Kunth (1999) Mas-Hesse, J. M. & Kunth, D. 1999, A&A, 349, 765
- Mastropietro et al. (2005) Mastropietro, C., Moore, B., Mayer, L., et al. 2005, MNRAS, 364, 607
- Mayer et al. (2001) Mayer, L., Governato, F., Colpi, M., et al. 2001, ApJ, 547, L123
- McQuinn et al. (2010) McQuinn, K. B. W., Skillman, E. D., Cannon, J. M., et al. 2010, ApJ, 724, 49
- Mei et al. (2007) Mei, S., Blakeslee, J. P., Côté, P., et al. 2007, ApJ, 655, 144
- Micheva et al. (2013) Micheva, G., Östlin, G., Bergvall, N., et al. 2013, MNRAS, 431, 102
- Moore et al. (1996) Moore, B., Katz, N., Lake, G., Dressler, A., & Oemler, A. 1996, Nature, 379, 613
- Noeske (1999) Noeske, K. G. 1999, Diploma thesis, Göttingen
- Noeske et al. (2000) Noeske, K. G., Guseva, N. G., Fricke, K. J., et al. 2000, A&A, 361, 33
- Noeske et al. (2006) Noeske, K. G., Koo, D. C., Phillips, A. C., et al. 2006, ApJ, 640, L143
- Noeske et al. (2003) Noeske, K. G., Papaderos, P., Cairós, L. M., & Fricke, K. J. 2003, A&A, 410, 481
- Östlin et al. (1999) Östlin, G., Amram, P., Masegosa, J., Bergvall, N., & Boulesteix, J. 1999, A&AS, 137, 419
- Papaderos et al. (1999) Papaderos, P., Fricke, K. J., Thuan, T. X., Izotov, Y. I., & Nicklas, H. 1999, A&A, 352, L57
- Papaderos et al. (2008) Papaderos, P., Guseva, N. G., Izotov, Y. I., & Fricke, K. J. 2008, A&A, 491, 113
- Papaderos et al. (2006) Papaderos, P., Guseva, N. G., Izotov, Y. I., et al. 2006, A&A, 457, 45
- Papaderos et al. (1998) Papaderos, P., Izotov, Y. I., Fricke, K. J., Thuan, T. X., & Guseva, N. G. 1998, A&A, 338, 43
- Papaderos et al. (2002) Papaderos, P., Izotov, Y. I., Thuan, T. X., et al. 2002, A&A, 393, 461
- Papaderos et al. (1996a) Papaderos, P., Loose, H.-H., Fricke, K. J., & Thuan, T. X. 1996a, A&A, 314, 59
- Papaderos et al. (1996b) Papaderos, P., Loose, H.-H., Thuan, T. X., & Fricke, K. J. 1996b, A&AS, 120, 207
- Papaderos et al. (2001) Papaderos, P., Noeske, K. G., Cairós, L. M., Vílchez, J. M., & Fricke, K. J. 2001, in Dwarf galaxies and their environment, ed. K. S. de Boer, R.-J. Dettmar, & U. Klein, 283
- Papaderos & Östlin (2012) Papaderos, P. & Östlin, G. 2012, A&A, 537, A126
- Peng et al. (2010) Peng, C. Y., Ho, L. C., Impey, C. D., & Rix, H.-W. 2010, AJ, 139, 2097
- Petrosian (1976) Petrosian, V. 1976, ApJ, 209, L1
- Recchi & Hensler (2006) Recchi, S. & Hensler, G. 2006, A&A, 445, L39
- Roediger et al. (2011) Roediger, J. C., Courteau, S., McDonald, M., & MacArthur, L. A. 2011, MNRAS, 416, 1983
- Salzer et al. (1989) Salzer, J. J., MacAlpine, G. M., & Boroson, T. A. 1989, ApJS, 70, 479
- Salzer & Norten (1999) Salzer, J. J. & Norten, S. A. 1999, The Low Surface Brightness Universe, IAU Col. 171, 170
- Sánchez Almeida et al. (2008) Sánchez Almeida, J., Muñoz-Tuñón, C., Amorín, R., et al. 2008, ApJ, 685, 194
- Sandage & Binggeli (1984) Sandage, A. & Binggeli, B. 1984, AJ, 89, 919
- Schlegel et al. (1998) Schlegel, D. J., Finkbeiner, D. P., & Davis, M. 1998, ApJ, 500, 525
- Searle & Sargent (1972) Searle, L. & Sargent, W. L. W. 1972, ApJ, 173, 25
- Sérsic (1968) Sérsic, J. L. 1968, Atlas de galaxias australes (Cordoba, Argentina: Observatorio Astronomico)
- Silich & Tenorio-Tagle (1998) Silich, S. A. & Tenorio-Tagle, G. 1998, MNRAS, 299, 249
- Staveley-Smith et al. (1992) Staveley-Smith, L., Davies, R. D., & Kinman, T. D. 1992, MNRAS, 258, 334
- Sung et al. (2002) Sung, E.-C., Chun, M.-S., Freeman, K. C., & Chaboyer, B. 2002, in Astronomical Society of the Pacific Conference Series, Vol. 273, The Dynamics, Structure & History of Galaxies: A Workshop in Honour of Professor Ken Freeman, ed. G. S. Da Costa, E. M. Sadler, & H. Jerjen, 341
- Sung et al. (1998) Sung, E.-C., Han, C., Ryden, B. S., Chun, M.-S., & Kim, H.-I. 1998, ApJ, 499, 140
- Tajiri & Kamaya (2002) Tajiri, Y. Y. & Kamaya, H. 2002, A&A, 389, 367
- Telles et al. (1997) Telles, E., Melnick, J., & Terlevich, R. 1997, MNRAS, 288, 78
- Thornley et al. (2000) Thornley, M. D., Schreiber, N. M. F., Lutz, D., et al. 2000, ApJ, 539, 641
- Thuan (1985) Thuan, T. X. 1985, ApJ, 299, 881
- Thuan (1991) Thuan, T. X. 1991, in Observations and Models of Blue Compact Dwarf Galaxies, ed. C. Leitherer, N. Walborn, T. Heckman, & C. Norman, 183
- Thuan & Martin (1981) Thuan, T. X. & Martin, G. E. 1981, ApJ, 247, 823
- Tully & Fisher (1977) Tully, R. B. & Fisher, J. R. 1977, A&A, 54, 661
- Vaduvescu et al. (2006) Vaduvescu, O., Richer, M. G., & McCall, M. L. 2006, AJ, 131, 1318
- van Zee et al. (2001) van Zee, L., Salzer, J. J., & Skillman, E. D. 2001, AJ, 122, 121
- van Zee et al. (1998) van Zee, L., Westpfahl, D., Haynes, M. P., & Salzer, J. J. 1998, AJ, 115, 1000
- Vigroux et al. (1984) Vigroux, L., Souviron, J., & Vader, J. P. 1984, A&A, 139, L9
- Vilchez (1995) Vilchez, J. M. 1995, AJ, 110, 1090
- Weinmann et al. (2011) Weinmann, S. M., Lisker, T., Guo, Q., Meyer, H. T., & Janz, J. 2011, MNRAS, 416, 1197
- Yasuda et al. (2001) Yasuda, N., Fukugita, M., Narayanan, V. K., et al. 2001, AJ, 122, 1104
- Zhao et al. (2013) Zhao, Y., Gao, Y., & Gu, Q. 2013, ApJ, 764, 44
Appendix A Error estimation
To obtain a better insight into the errors of the derived parameters of the BCDs, we created a set of artificial BCDs. To mimick the real Virgo BCDs, we combined the light distribution from two components, representing the LSB and starburst component. Firstly, the LSB-components were divided into a bright version (), with half-light semi-major axes of and , and a faint version (), with and . Secondly, two different Sérsic indices were used, with (pure exponential) and . We chose three different axis ratios () and two position angles (p.a.) for the LSB component; the starburst component was chosen to be circular.
To mimick the additional outer tail of the LSB-component of some of the real Virgo-BCDs (see section 3.5) at larger radii, we optionally added an exponential outer tail to the exponential LSB-component, having the same axis ratio and position angle. The tail has twice the half-light semi-major axis of the LSB-component, and can be weak ( mag fainter in total brightness) or strong ( mag). Note that we did not add a tail to the LSB component with , since our intention was to test whether our approach to assume an exponential shape for the LSB component’s analysis, and to account for a possible outer tail, would be able to approximate the case reasonably well.
For the starburst component, two different effective radii ( and arcsec) were used to account for the various extents of the starbursts. We created one version in which the starburst is co-aligned with the LSB component, and another version in which it is offset by , since a fraction of the real BCDs show a clear offset between starburst and LSB component (see Tab. 1).
With these different parameters we end up with 384 artificial BCDs. We first created noise-free images without the starburst component, to determine the true total (two-Petrosian) magnitude of the LSB+tail component, as well as the true value of , using the input axis ratios and position angles. We then created images with realistic noise and seeing characteristics, which were analysed in the same manner as the Virgo BCDs (see Section 3). The magnitudes and radii derived with LAZY for the LSB+tail component were then compared to the true values, thereby yielding estimates for systematic errors of magnitude and relative radius,
| (9) | |||||
| (10) |
as well as for their statistical errors (standard deviation) and . Note that here and in the remainder of this section, we omit the subscript “LSB” from all quantities, for better readability.
| 17.0 | 1.0 | 0.03 | 0.08 | 1.01 | 0.06 |
|---|---|---|---|---|---|
| 17.0 | 1.3 | 0.03 | 0.13 | 1.01 | 0.07 |
| 15.0 | 1.0 | 0.15 | 0.10 | 0.89 | 0.05 |
| 15.0 | 1.3 | 0.16 | 0.11 | 0.88 | 0.07 |
| 17.0 | 0.09 | 0.06 | 0.16 | 0.03 | +0.01 | 0.01 |
|---|---|---|---|---|---|---|
| 15.0 | 0.10 | 0.06 | 0.16 | 0.15 | 0.11 | 0.41 |
Table 9 summarises the results, subdivided by LSB component brightness and profile shape. Based on this approach, the final systematic and statistical errors that we adopt for our BCD analysis are provided in Tab. 10, subdivided into bright and faint LSB components. We refrain here from differentiating between the different Sérsic indices n and between the cases with/without a tail component, as the resulting values were very similar.
The mean effective surface brightness can be derived directly from and :
| (11) |
Its statistical error was calculated assuming independent errors on magnitude and radius:
| (12) | ||||
| (13) |
The systematic surface brightness error was calculated by
| (14) |
The average differences between the input magnitudes and radii and the ones measured by LAZY are almost negligible for the bright galaxies ( mag / ) and moderate for the faint galaxies ( mag / ). However, both add up to a significant systematic effect on the surface brightness of mag/arcsec2 for the faint galaxies, while being negligible ( mag/arcsec2) for the bright galaxies. The statistical errors are reasonably small for all quantities, with mag for , for , and mag/arcsec2 for .
We point out that, due to our parameter setup, the fraction of artificial BCDs with inner flattening (see Section 3.4) was much larger than for the real Virgo BCDs, where only three BCDs were fitted with a inner flattening. We therefore calculated the above quantities only from those BCDs without inner flattening, to avoid an overestimation of the errors.