AGN feedback at and the mutual evolution of active and inactive galaxies
Abstract
The relationships between galaxies of intermediate stellar mass and moderate luminosity active galactic nuclei (AGNs) at are investigated with the Galaxy Mass Assembly ultra-deep Spectroscopic Survey (GMASS) sample complemented with public data in the GOODS-South field. Using X-ray data, hidden AGNs are identified in unsuspected star-forming galaxies with no apparent signs of non-stellar activity. In the color–mass plane, two parallel trends emerge during the 2 Gyr between the average redshifts and : while the red sequence becomes significantly more populated by ellipticals, the majority of AGNs with erg s-1 disappear from the blue cloud/green valley where they were hosted predominantly by star-forming systems with disk and irregular morphologies. These results are even clearer when the rest-frame colors are corrected for dust reddening. At , the ultraviolet spectra of active galaxies (including two Type 1 AGNs) show possible gas outflows with velocities up to about -500 km s-1 that are not observed neither in inactive systems at the same redshift, nor at lower redshifts. Such outflows indicate the presence of gas that can move faster than the escape velocities of active galaxies. These results suggest that feedback from moderately luminous AGNs (log erg s-1) played a key role at by contributing to outflows capable of ejecting part of the interstellar medium and leading to a rapid decrease in the star formation in host galaxies with stellar masses log(11.
Subject headings:
galaxies: formation – galaxies: evolution – galaxies: active1. Introduction
The evolution of galaxies is thought to be deeply linked to AGN activity because of the tight correlation observed between the masses of present-day galaxy bulges and their nuclear supermassive black holes (see Alexander & Hickox 2012 for a review).
AGNs are expected to provide negative feedback processes that can suppress star formation on galactic scales through the interaction of radiation, winds, and jets with the interstellar medium of the host galaxy leading to the ejection and/or heating of a substantial fraction of the gas (e.g. Di Matteo et al. 2005; Fabian 2012). However, it seems also plausible that the same AGNs can provide some positive feedback by triggering or enhancing star formation (e.g. De Young 1989; Gaibler et al. 2012; Ishibashi, Fabian & Canning 2013).
One promising approach is to investigate the relationships between AGN activity and galaxy evolution in the critical transformation phase believed to occur at when a significant fraction of galaxies moved from the locus of star-forming systems in the color – mass plane (the so called blue cloud) to the red sequence where spheroidal galaxies with weak or suppressed star formation are located mostly at (e.g. Cassata et al. 2008; Brusa et al. 2009; Silverman et al. 2008; Cardamone et al. 2010; Cameron et al. 2011; Kocevski et al. 2012). Deep multi-wavelength data are essential to address these questions from the observational point of view, and recent results suggest that AGN and galaxy evolution are deeply related to each other (e.g. Daddi et al. 2007; Mullaney et al. 2012; Bongiorno et al. 2012; Rovilos et al. 2012; Olsen et al. 2013; Rosario et al. 2013).
The main purpose of the present study is to investigate the supposed role AGN negative feedback during the critical cosmic epoch at . We adopt km s-1 Mpc-1, , .
2. The GMASS sample and X-ray data
The present study is based on the Galaxy Mass Assembly ultra-deep Spectroscopic Survey (GMASS) sample, in which galaxies were selected from a region of the GOODS-South/Hubble Ultra Deep Field region with the only criterion to have Spitzer IRAC m magnitudes brighter than 23.0 (AB) (Kurk et al. 2013; K13 hereafter). As shown in K13, the selection at 4.5m ensures sensitivity to stellar mass, a favorable -correction up to z3, less influence by dust extinction, and represents a major difference compared to previous works in this sky region where studies on AGNs were mostly based on X-ray selected samples (see previous references). A fraction of galaxies have very deep optical spectroscopy with integration times up to 30 hours (K13). Photometric spectral energy distributions (SEDs) from U- to the IRAC -band were used to estimate photometric redshifts (photo-) for galaxies without spectroscopic redshifts and to derive galaxy properties adopting the stellar population models of Maraston (2005), the Kroupa (2001) initial mass function (IMF), and solar metallicity (K13). These SEDs were also used to derive the rest-frame (U-B) colors (standard Johnson filters) with the method described by Ilbert et al. (2005).
For the present study, 266 galaxies were selected from the GMASS sample applying two selection criteria: and a cut in stellar mass, log(10, in order to ensure a high completeness in mass across the whole redshift range (see Cassata et al. 2008). At , 55% of the sample have reliable spectroscopic redshifts when GMASS spectroscopy is complemented with the public ESO VLT GOODS-South spectra (Balestra et al. 2010). For the remaining 45% of the sample, the photo- described in K13 were used.
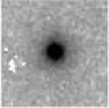
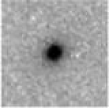
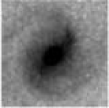
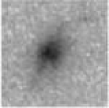
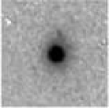
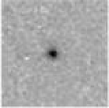
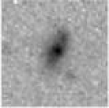
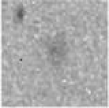
Public Hubble Space Telescope (HST) near-infrared imaging (WFC3 + F160W filter) taken in the framework of the ERS (Windhorst et al. 2010) and CANDELS (Koekemoer et al. 2011; Guo et al. 2013) surveys was exploited to assign one of the following visual (rest-frame optical) morphological classes to each galaxy: elliptical, compact, disk, irregular, and faint (Fig. 1 and Table 1; see also Talia et al. 2013). The galaxies classified as compact are small round-like objects, whereas the faint galaxy class consists of objects too weak (or invisible) for a reliable classification.
Our selected sample of 266 galaxies was cross-correlated with the catalog of 740 X-ray sources of Xue et al. (2011, X11 hereafter) based on the Chandra 4 Msec public data of the Chandra Deep Field South (CDF-S), returning 58 matches within a search radius of 1′′. The rest frame 2-10 keV luminosities ( hereafter) were derived from the absorption-corrected rest-frame 0.5-8 keV luminosities tabulated in X11 and assuming a =1.8 power-law. Neutral hydrogen column densities (NH) were retrieved from Bauer et al. (private communication). The 4Ms CDFS exposure is complete down to log(0.5-8 keV) erg s-1 across the entire redshift range explored in this work (see Figure 16b in X11), which translates into log erg s-1 for Compton-thin AGNs (NH cm-2). This is also the threshold above which AGN activity dominates over star formation (e.g. Ranalli et al. 2003; Bauer et al. 2004).
The Chandra data were also used to derive average X-ray properties of galaxies (such as fluxes and average obscuration) by using a stacking technique based on CSTACK111http://cstack.ucsd.edu/cstack/(v3.0) recently modified to include the full 4Ms exposure. In order to minimize any contamination of detected sources in the stacked signal, all objects with a known X-ray source within of the centroid were excluded. Furthermore, the stacking analysis has been made within 8′ of the CDFS field center in order to maximize the Chandra PSF.
2.1. General properties of the sample
Our selected sample probes the regimes of intermediate galaxy stellar masses (log(11) and moderate luminosity AGNs (log erg s-1) (Fig. 2).
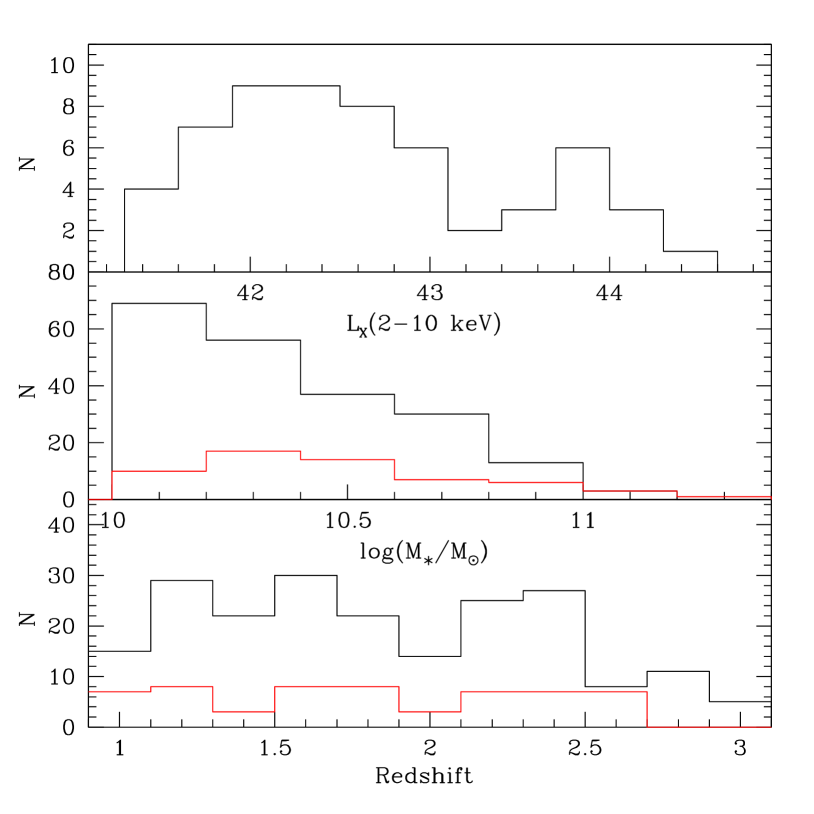
The fractions of X-ray sources at are 22% and 13% down to log and log, respectively, which are consistent with previous works (e.g. Xue et al. 2010; Olsen et al. 2013) when the increasing fraction of AGNs with stellar mass is taken into account. If the sample is divided into two redshift bins nearly equally populated (, N=122, , , N=144, ), the fraction of X-ray sources with log depends on redshift, increasing from 7% at to 18% at (see also Brusa et al. 2009).
| Elliptical | Compact | Disk | Irregular | Faint | ||
| All | 40% (49) | 0% (0) | 43% (53) | 16% (20) | 0% (0) | |
| No X-rays | 37% (36) | 0% (0) | 46% (44) | 17% (16) | 0% (0) | |
| 50% (13) | 0% (0) | 35% (9) | 15% (4) | 0% (0) | ||
| 62% (5) | 0% (0) | 25% (2) | 12% (1) | 0% (0) | ||
| All | 17% (25) | 10% (15) | 17% (24) | 47% (68) | 8% (12) | |
| No X-rays | 14% (16) | 10% (11) | 16% (18) | 51% (57) | 9% (10) | |
| 28% (9) | 12% (4) | 19% (6) | 34% (11) | 6% (2) | ||
| 23% (6) | 15% (4) | 19% (5) | 35% (9) | 8% (2) |
3. Mutual galaxy–AGN evolution
An intriguing result emerges when the evolutions of galaxies and AGNs with log erg s-1 are compared in the rest-frame color – stellar mass plane at and (Fig. 3).
Using the (U-B) colors uncorrected for dust reddening, at , the majority of galaxies (78%) do not lie on the red sequence. AGNs are mostly located in the blue cloud and green valley regions (92%), and hosted predominantly by star-forming galaxies with irregular and disk morphologies (see also Rosario et al. 2013). A smaller fraction of AGNs is hosted by ellipticals and compact galaxies (Table 1).
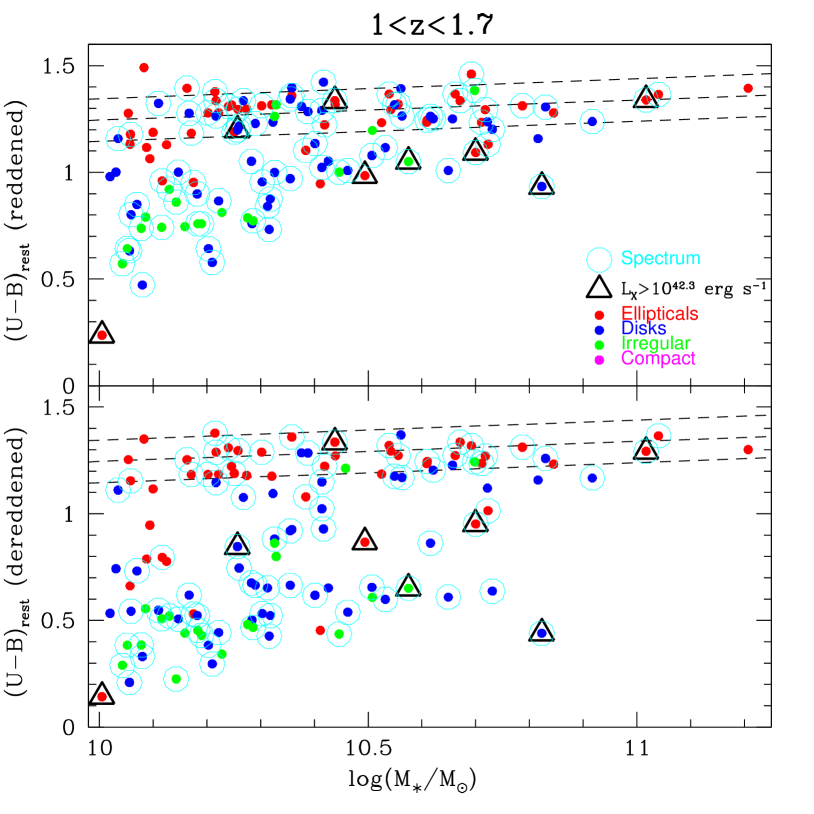
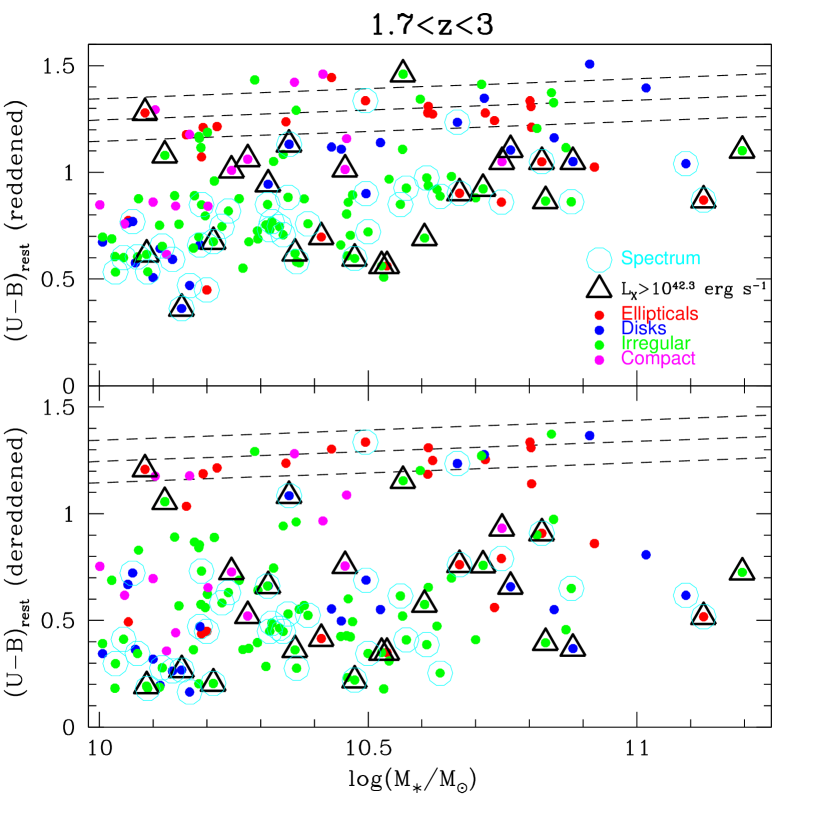
At the red sequence becomes more established than in the higher redshift bin, containing 56% of the whole galaxy population (compared to 22% at ). The fraction of morphological ellipticals increases to 40% (compared to 17% at ), the majority of which (77%) are located on the red sequence (vs. 44% at ). The ellipticals belonging to the overdensity at (Kurk et al. 2009) represent only 16% of the total number of ellipticals in the red sequence. The blue cloud becomes mostly populated by disk and irregular galaxies, while no compact and faint objects are observed. Compared to , the AGNs become rarer and are hosted mainly by elliptical and disk galaxies. The fraction of AGNs in the blue cloud decreases from 21% at to 9% at .
The above results are clearer when the (U-B) colors are dereddened using the dust extinction (AV) derived from the photometric SED fitting (K13) and adopting the Calzetti (2001) extinction curve. Fig. 3 shows that the red sequence can be more clearly distinguished from the blue cloud (see also Cardamone et al. 2010), and populated by a fraction of morphological ellipticals increasing from 52% at to 81% at .
These evolutionary patterns suggest a scenario where the evolutions of galaxies and AGNs are closely related at , when AGNs were hosted by star-forming systems, after which (2 Gyr later) the number of AGNs decreased and the number of red sequence galaxies increased. In this picture, the compact galaxies hosting an AGN may represent a transitional phase between the concomitant star-forming and AGN activities in the blue cloud, and the subsequent quenching of star formation and morphological transformation, thus populating the red sequence while the fraction of AGN hosts drops rapidly.
4. Clues on hidden AGNs at
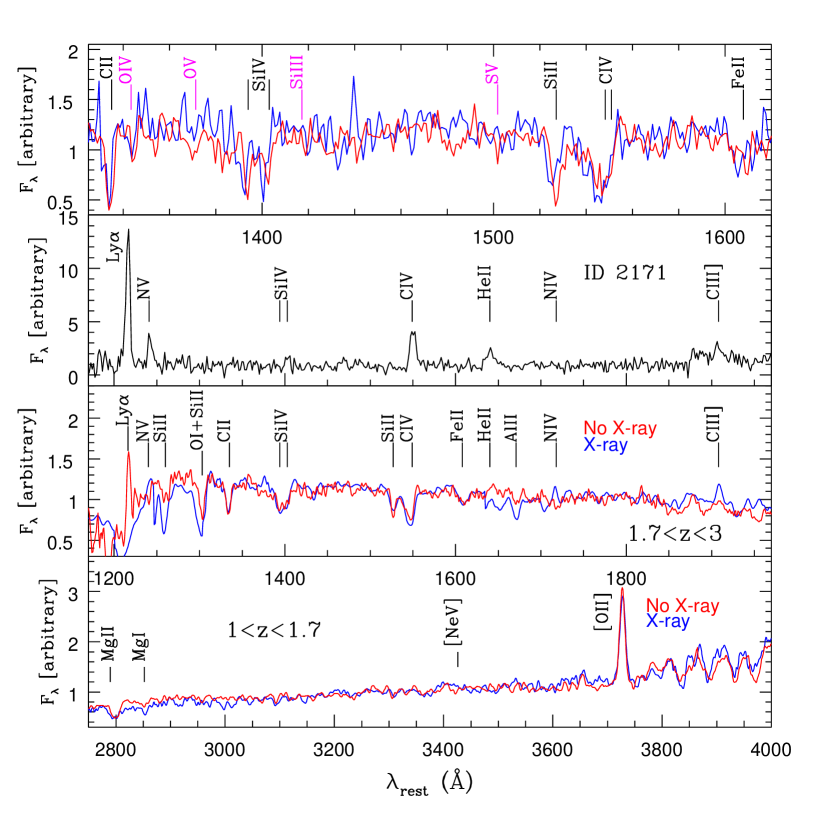
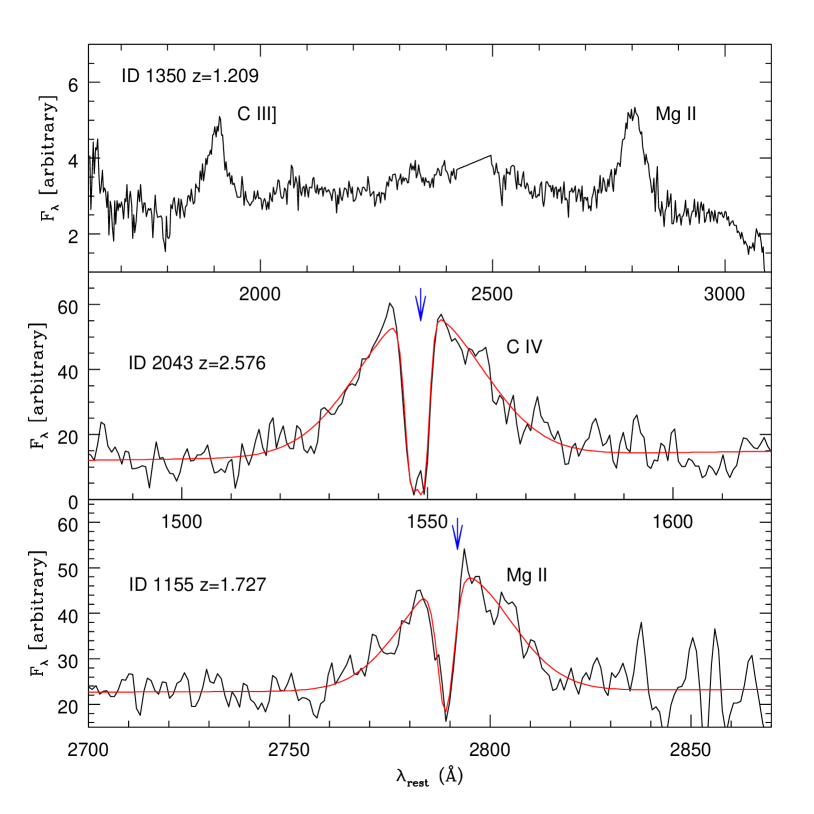
The properties of active and inactive galaxies were investigated using their stacked optical spectra. At and , the fractions of galaxies with available spectra are 95/122 and 44/144 respectively, with a spectroscopic completeness for the X-ray galaxies of 85% and 34%. The stacking of optical spectra was done in three steps: (i) the individual spectra were smoothed at the lowest resolution (i.e. R200 of the VIMOS LR grism), (ii) each spectrum was rescaled by the average flux in a common spectral region, (iii) the spectra were averaged without any weights. In the AGN sample, we removed the 3 objects classified as Type 1 AGN (ID2043, ID1155 and ID1350; Fig. 4).
At , the stacked spectrum of active (i.e. detected individually in X-rays) and inactive galaxies was made with 9 (=2.0) and 30 (=2.25) spectra respectively. The spectrum of the active galaxy ID 2171 (=2.145) was excluded from the stacking because of its strong emission lines, which differ markedly from the other galaxies (Fig. 4).
Compared to inactive galaxies, the stacked spectrum of active galaxies shows no Ly emission and stronger C III]1909 emission (Fig. 4). Moreover, some interstellar medium (ISM) absorption lines (e.g. Si II1260, O I+Si II1303, Al II1670) have equivalent widths (EWs) systematically larger than in inactive galaxies by a factor of 2 (EW2-4 Å).
The X-ray data were then used to assess whether the AGN origin of the X-ray emission (assumed in Section 2 based simply on the criterion of log erg s-1) is indeed correct.
The 9 galaxies at with spectroscopic redshifts that are detected individually in X-rays have an average luminosity of 4 erg s-1 and a hardness ratio HR0 (HR=H-S/H+S, with H and S being the count rates in the hard and soft bands respectively), that is too flat to be explained by star formation only and consistent with an absorbed power-law with , which is typical of an obscured AGN. These results remain unchanged when only the 6 galaxies with log erg s-1 are used, or the stacking includes also the X-ray galaxies with photo- and all (for a total of 24/26 objects used by CSTACK). The individual galaxy ID 2171 (not included in the stacking of optical spectra discussed later) has X-ray properties typical of a Compton thick AGN with erg s-1, HR0.85 and NH cm-2.
On the basis of SED fitting (K13), UV spectral slopes (Talia et al. 2012) and infrared luminosities (Talia et al., in preparation), the median star formation rate (SFR) of the X-ray emitting galaxies is consistently 100 M⊙ yr-1. According to Ranalli et al. (2003), this SFR corresponds to erg s-1, i.e. 1 dex less than the observed total X-ray luminosity, indicating a negligible contribution of star formation to the observed .
In stark contrast, the X-ray stacked flux of the 30 inactive galaxies (i.e. individually undetected in X-rays) with spectroscopic redshifts is significant only in the soft-band (0.5-2 keV). Assuming an unobscured spectrum with , the detected soft-band flux implies an average erg/s at mean redshift and can be ascribed to SFR M⊙yr-1. These results remain unchanged when the X-ray stacking includes also the galaxies with photo- (87/112 used by CSTACK).
It is remarkable that, despite the clear presence of AGNs (as shown by the X-ray properties), the UV spectra of active galaxies at do not show (except for ID 2171) any clear features of non-stellar activity, particularly when compared to inactive galaxies of similar redshift and stellar mass. One possibility is that the AGNs are hosted by more obscured galaxies with denser ISM, which would explain the larger EWs of some ISM absorption lines and the lack of Ly emission.
5. Searching for outflows at
We searched for ISM gas ouflows in the stacked spectra at in order to further investigate the differences between active and inactive galaxies.
For this purpose, only the subset of galaxies with the highest resolution spectra from GMASS (R600; K13) were used in order to maximize the radial velocity accuracy and to detect the weak photospheric lines (C III1247, O IV1343, O V1371, Si III1417, S V1501; see Leitherer et al. 2011) whose median wavelength was used in each stacked spectrum to define the systemic (zero velocity) reference (topmost spectra in Fig. 4).
In the stacked spectrum of the 24 inactive galaxies, the main ISM absorption lines (Si II1260, O I1302, C II1334, Si II1526, Si IV1393,1402, Fe II1608, Al II1670) show a median blueshift of -70100 km s-1, consistently with other results on inactive galaxies (e.g. Shapley et al. 2003; Steidel et al. 2011; Talia et al. 2012).
In contrast, for the stacked spectrum of 7 active galaxies, we detect larger blueshifts (with between -600 and -120 km s-1) for the same lines, with a median value of -340150 km s-1. Similar blueshifts (ascribed to outflows) have been observed also in other active galaxies at (Nesvadba et al. 2006; Hainline et al. 2011; Harrison et al. 2012).
For the typical size ( kpc) of the active galaxies of Fig.4, the expected escape velocity is 350 km s-1, where is the sum of the median stellar mass (log() and the total gas mass (H I+H2) (log(10.7; Magdis et al. 2012, eq. 27) This is comparable to the measured median velocity, and lower than the highest observed speeds. The real could be even larger because the blueshifts account only for the radial velocity component.
Although the presence of OB star photospheric lines implies a role of stellar feedback, the larger velocities observed in active galaxies suggest an additional contribution from AGNs to the energy of gas outflows. Deeper integral field spectroscopy would be useful to confirm these results and study the geometry of the outflows, as e.g., in Newman et al. (2012).
We also searched for outflows in the spectra of the two Type 1 AGNs identified at (ID 1155 at and ID 2043 at ; K13). Both objects have log44 erg s-1, heavy to moderate obscuration (N and cm-2), and display broad emission lines (FWHM3200 km s-1 for Mg II2800, FWHM5600 km s-1 for C IV1549). Narrow (FWHM500 km s-1) absorption lines associated with MgII2800 and CIV1549 are present in ID 1155 and 2043 respectively (Fig. 4). A three-component best fit of the continuum, emission, and absorption lines indicates that the absorptions are blueshifted by km s-1 (MgII) and km s-1 (CIV) relative to the peak of the emission lines (adopted as the systemic reference) (Fig.4). These results suggest that gas outflows are also present in Type 1 AGNs at .
6. The fading activity at
Moving to lower redshifts, the 20 galaxies at with spectroscopic redshifts and individual X-ray detection have an average HR0 compatible with an absorbed power-law with and column density N cm-2, typical of an obscured AGN. These results do not change when either the 6 galaxies with log erg s-1 are used, or when galaxies with photometric redshifts are included (24/26 used by CSTACK).
However, despite the clear presence of AGNs, the median X-ray luminosity (above the completeness limit of log erg s-1) of active galaxies at (log=42.85 erg s-1) becomes lower by a factor of 2 than at (log=43.18 erg s-1), which implies, together with the smaller AGN fraction (Section 3), that the AGN energy release declines with redshift.
In contrast, for inactive galaxies at (i.e. without individual X-ray detection) with spectroscopic redshifts, a significant signal was detected with CSTACK (48/73 objects) only in the soft-band. The detected soft-band flux of cgs (assuming an unobscured spectrum with ) implies erg/s for the average redshift () of these galaxies.
If this luminosity is solely due to star formation, according to Ranalli et al. (2003), it implies an average SFR14 M⊙yr-1, broadly consistent with the average(median) SFR30(5) M⊙yr-1 derived for these galaxies from the photometric SED fitting (K13). The non-detection of hard X-rays also indicates a negligible contamination of obscured and low-luminosity AGNs in our sample of intermediate mass galaxies (but see Olsen et al. 2013 for a higher stellar mass sample). These results do not change significantly when the X-ray stacking is performed including galaxies with photometric redshifts (64/96 used by CSTACK).
At , the optical spectra of active (N=20, =1.22, all ) and inactive (N=73, =1.29) galaxies have very similar properties (Fig. 4). The absence of [Ne V]3426 emission (expected in case of AGN photoionization) in the stacked spectrum of X-ray galaxies may be due to attenuation by dust extinction and/or the gas density being higher than the critical density of this line (see Mignoli et al. 2013).
Even with the high resolution of the GMASS spectra, the search for gas outflows in this redshift range is uncertain because it is impossible to clearly distinguish either the [O II]3727 and Mg II2800 doublets, or the ISM and photospheric absorption components of Mg II. For instance, adopting 3727.5 Å as the systemic centroid of the unresolved [O II]3726+3729 doublet (as in Bradshaw et al. 2013), the stacked spectra of active and inactive galaxies show Mg II2800 velocity offsets in the range of -200 to -50 km s-1 with a typical uncertainty of 100 km s-1.
In contrast to those identified at , the single Type 1 AGN (ID 1350, , log=43.97 erg s-1; Fig. 4) appears to have no intrinsic absorption and properties that are indeed typical of an unabsorbed Type I AGN with a blue continuum.
Interpreted with our findings in Section 3, these results suggest that the AGN activity and its effects on the host galaxies have faded gradually from to .
7. Summary
We have presented evidence of a link between the migration of galaxies from redshift to onto the red sequence and a parallel decrease in the activity of AGNs with erg s-1. At , the AGNs often remain hidden in unsuspected star-forming galaxies.
We tentatively detect gas outflows at speeds of up to about -500 km s-1, which are comparable to or larger than the galaxy escape velocities, and present only in active galaxies at . This suggests that AGN feedback, in addition to star formation, contributes to these gas outflows, removing some fraction of the gas permanently from the galaxy, leading to so-called star-formation quenching, and allowing a fraction of galaxies to migrate onto the red sequence.
Deeper spectroscopy is needed to confirm and extend these results to larger samples. The synergy of future massive imaging-spectroscopy surveys (e.g. Euclid; Laureijs et al. 2011) and X-ray missions such as eROSITA (Merloni et al. 2012) and Athena+ (Georgakakis et al. 2013) will be crucial to fully unveil the evolutionary links between galaxies and AGNs.
References
- (1) Alexander D.M. & Hickox R.C. 2012, NewAR, 56, 93
- (2) Balestra I., Mainieri V., Popesso P. et al. 2010, A&A, 512, 12
- (3) Bauer F.E, Alexander D.M., Brandt, W.N. et al. 2004, AJ, 128, 2048
- (4) Bongiorno A., Merloni A., Brusa M. et al. 2012, MNRAS, 427, 3103
- (5) Bradshaw E.J., Almaini O., Hartley W.G. et al. 2013, MNRAS, in press (arXiv:1304.7276)
- (6) Brusa M., Fiore F., Santini P. et al. 2009, A&A, 507, 1277
- (7) Calzetti D. 2001, PASP, 113, 1449
- (8) Cameron E., Carollo C.M., Oesch P.A., Bouwens R.J, Illingworth G.D., Trenti M., Labbe’ I., Magee D. 2011, ApJ, 743, 146
- (9) Cardamone C.N., Urry C.M., Schawinski K. et al. 2010, ApJ, 721, L38
- (10) Cassata P., Cimatti A., Kurk J. et al. 2008, A&A, 483, L39
- (11) Daddi E., Alexander, D.M., Dickinson M. et al. 2007, ApJ, 670, 173
- (12) De Young D.S., 1989, 342, L59
- (13) Di Matteo T., Springel V., Hernquist L.. 2005, Nature, 433, 604
- (14) Fabian A. 2012, ARA&A, 50, 455
- (15) Gaibler V., Khochfar S., Krause M., Silk J. 2012, MNRAS, 425, 438
- (16) Georgakakis A., Carrera F., Lanzuisi G. et al. 2013, arXiv:1306.2328
- (17) Guo Y., Ferguson H.C., Giavalisco M. et al. 2013, ApJS, 207, 24
- (18) Harrison C.M., Alexander D.M., Swinbank A.M. et al. 2012, ApJ, MNRAS, 426, 1073
- (19) Ilbert O., Tresse L., Zucca E. et al. 2005, A&A, 439, 863
- (20) Ishibashi W., Fabian A.C., Canning R.E.A. 2013, MNRAS, 431, 2350
- (21) Kocevski D.D., Faber S., Mozena M., Koekemoer A.M. et al. 2012, ApJ, 744, 148.
- (22) Koekemoer A.M., Faber S.M., Ferguson H.C. et al. 2011, ApJS, 197, 36
- (23) Kroupa P. 2001, MNRAS, 322, 231
- (24) Kurk J., Cimatti A., Zamorani G. et al. 2009, A&A, 504, 331
- (25) Kurk J., Cimatti A., Daddi. E. et al. 2013, A&A, 549, 63
- (26) Laureijs R., Amiaux J., Arduini S. et al. 2011, Euclid Definition Study Report (arXiv:1110.3193)
- (27) Leitherer C., Tremonti C.A., Heckman T.M., Calzetti D. 2011, AJ, 141, 37
- (28) Magdis G.E., Daddi E., Bethermin M. et al. 2012, ApJ, 760, 6
- (29) Maraston C. 2005, MNRAS, 362, 799
- (30) Merloni A. et al. 2012, online MPE document. Edited by S. Allen. G. Hasinger and K. Nandra (arXiv:1209.2114).
- (31) Mignoli M., Vignali C., Gilli R. et al. 2013, A&A, 556, 29
- (32) Mullaney J.R., Daddi E., Bethermin M. et al. 2012, ApJ, 753, L30
- (33) Nesvadba N.P.H., Lehnert M.D., Eisenhauer F., Gilbert A.. Tecza M., Abuter R. 2006, ApJ, 650, 693
- (34) Newman S.F., Genzel R., Förster-Schreiber N.M. et al. 2012, ApJ, 761, 43
- (35) Olsen K.P., Rasmussen J., Toft S., Zirm A.W. 2013, ApJ, 764, 4
- (36) Ranalli, P., Comastri A., Setti G 2003, A&A, 399, 39
- (37) Rosario D.J., Santini P., Lutz D. et al. 2013, ApJ, 771, 63
- (38) Rovilos E., Comastri A., Gilli R. et al. 2012, A&A, 546, 58
- (39) Shapley A.E., Steidel C.C., Pettini M., Adelberger K.L. 2003, ApJ, 588, 65
- (40) Silverman J.D., Mainieri V., Lehmer B.D. et al. 2008, ApJ, 675, 1025
- (41) Talia M., Mignoli M., Cimatti A. et al. 2012, A&A, 539, 61
- (42) Talia M., Mignoli M., Cimatti A. et al. 2013, A&A, submitted, arXiv:1307.1366
- (43) Weiner B.J., Allison L.C., Prochaska J.X. et al. 2009, ApJ, 692, 187
- (44) Windhorst R.A., Cohen S.H., Hathi N.P. et al. 2010, ApJS, 193, 27
- (45) Xue Y.Q., Brandt W.N., Luo B. et al. 2010, ApJ, 720, 368
- (46) Xue Y.Q., Luo B., Brandt W.N. et al. 2011, ApJS, 195, 10