The Compactness of Presupernova Stellar Cores
Abstract
The success or failure of the neutrino-transport mechanism for producing a supernova in an evolved massive star is known to be sensitive not only to the mass of the iron core that collapses, but also to the density gradient in the silicon and oxygen shells surrounding that core. Here we study the systematics of a presupernova core’s “compactness” (O’Connor & Ott, 2011) as a function of the mass of the star and the physics used in its calculation. Fine-meshed surveys of presupernova evolution are calculated for stars from 15 to 65 . The metallicity and the efficiency of semiconvection and overshoot mixing are both varied and bare carbon-oxygen cores are explored as well as full hydrogenic stars. Two different codes, KEPLER and MESA, are used for the study. A complex interplay of carbon and oxygen burning, especially in shells, can cause rapid variations in the compactness for stars of very nearly the same mass. On larger scales, the distribution of compactness with main sequence mass is found to be robustly non-monotonic, implying islands of “explodability”, particularly around 8 to 20 and 25 to 30 . The carbon-oxygen (CO) core mass of a presupernova star is a better, though still ambiguous discriminant of its core structure than the main sequence mass.
Subject headings:
black holes - supernovae: general, stars:neutron, neutrinos, shock waves1. Introduction
The compactness of its core is an important structural characteristic of a presupernova star that affects whether it will explode as a supernova. A shallow density gradient around the iron core, as typically exists in more massive stars, implies a higher accretion rate and ”ram pressure” (Cooperstein et al., 1984) surrounding the iron core during its collapse that must be overcome by neutrino energy deposition or other energy deposition to turn what is initially an implosion into an explosion. The connection between this structure and the likelihood of explosion has been noted many times (Burrows & Lattimer, 1987; Fryer, 1999; O’Connor & Ott, 2011; Ugliano et al., 2012), but little attention has been given to explaining just why the compactness has the values that it does, or why different groups obtain different core structures for models with similar main sequence mass.
Recently, O’Connor & Ott (2011) quantified this compactness in terms of a parameter,
| (1) |
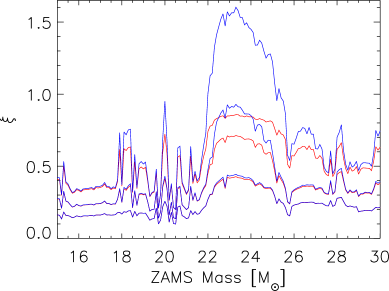
where M=2.5 was chosen as the relevant mass for quantifying the density gradient outside of the iron core, which itself typically has a mass in the range 1.4 to 2.0 . In O’Connor et al’s definition, the time, tbounce, chosen for evaluating is when the core has collapsed to its maximum (super-nuclear) density. As we shall show (§ 2.3), for M = 2.5 , no substantial accuracy is lost if this parameter is evaluated for the “presupernova model” defined by when the collapse speed first reaches 1000 km s-1. The choice of M = 2.5 is justified as being larger than the iron core itself, yet deep enough in the star to sample matter that might accrete, especially in a failed explosion. Since is inversely proportional to the radius of a fiducial mass outside the iron core, it is small when the density around the iron core falls off rapidly with radius and greater when the density gradient is shallow. That is, when is large, one need go only a shorter distance to include more mass. The systematics of neutrino-powered supernova explosions were explored as a function of by O’Connor & Ott (2011) and Ugliano et al. (2012), both of whom found that a small value of favored explosion. O’Connor & Ott (2011) plotted as a function of main sequence mass for a variety of surveys due to Woosley et al. (2002), Woosley & Heger (2007) and Limongi & Chieffi (2006), and a subset of that data is shown in Fig. 1. Note especially the distinctly non-monotonic behavior in the vicinity of 25 and 40 .
For a polytrope of constant index and composition supported by a constant fraction () of ideal gas pressure, the compactness defined by equation 1 will actually decrease monotonically with increasing mass when evaluated at a constant central temperature and small radius. This is because, for polytropes, the central temperature and density obey a relation (e.g. Woosley et al., 2002)
| (2) |
For a given the central density thus declines as and the radius required to enclose a given mass increases with M. As will be discussed in § 3.1, equation 2 works reasonably well for massive stars that are burning hydrogen and helium in their centers. The inner regions of such stars are non-degenerate and can be well represented by polytropes of constant index.
As massive stars evolve, however, they develop nested cores with different compositions and entropies. Lighter stars develop more degenerate cores in their late stages, especially during oxygen burning. The large gravitational potential at the edge of these degenerate cores implies a small pressure scale height that results in a steep decline in the local density (Faulkner, 2001, 2005). As a result, in heavier stars, the higher entropy actually leads to more extended configurations and larger values of . One does not have to to go out as far in the “envelope” of the compact core to encompass 2.5 , while in lighter stars that mass is reached farther out. This accounts for a general tendency of the compactness parameter for presupernova stars to increase with mass, especially for low metallicity stars where mass loss is less important.

Fig. 1 also shows that the core compactness has significant non-monotonic behavior above about 20 , and possibly some fine structure below 20 . If this behavior is real and robust, it would have interesting implications for the explosion mechanism(s) for massive stars, the masses of their compact remnants, and stellar nucleosynthesis. To address the “real and robust” issue, it is necessary to understand why this non-monotonic structure exists and its sensitivity to uncertainties and variations in the stellar models.
The present study has several parts, some dealing with the systematics of found in new surveys of massive stars, others with the uncertainties one should assign to those results. In § 2, three new surveys of massive stellar evolution are presented for stars of solar metallicity, very low metallicity (10-4 solar), and solar metallicity with suppressed mass loss. These new surveys, though using the same physics as in previous works (Woosley & Heger, 2007), are needed to provide a finer mass grid for examining rapid fluctuations in and to give additional data not archived in previous work. In § 3, we address the heart of the matter: why is the compactness a non-monotonic function and, in some places, almost chaotic function of main sequence mass. The timing and location of several carbon and oxygen convective shells are found to play a major role. Because there are multiple episodes of shell burning, the final compactness can be quite complex. In § 4 the sensitivity of these results to uncertain assumptions in the physics used in two stellar evolution codes, KEPLER and MESA, is explored. These uncertainties, especially the treatment of semiconvection and convective overshoot mixing, lead to large variations in the final CO core mass that emerges for a given main sequence mass and account for much of the diversity of published results for presupernova evolution. Since these uncertainties cloud the interpretation of the compactness plot, a further study is carried out in § 5 for bare CO stars using both codes. Provided the carbon mass fractions at carbon ignition are the same as in the full star models, the same trends seen previously for the compactness parameter are also found in these simpler cores, albeit with an offset due to surface boundary pressure in the full star. Thus the non-monotonicity of can be considered robust and the CO core mass is a somewhat better indicator of pre-supernova structure (and to some extent explosion dynamics) than the main sequence mass. Finally, § 6 offers some conclusions.
2. New Surveys of Presupernova Evolution Using the KEPLER CODE
2.1. Solar Metallicity Stars
The models published in (Woosley & Heger, 2007) were aimed at sampling supernova nucleosynthesis and light curves for a broad range of non-rotating stars of solar metallicity. The resolution in mass necessary for that purpose was not particularly fine, so that study has been repeated using the same code and physics, but with a finer mass grid. The prescriptions for nuclear reaction rates, mass loss, opacity, convective overshoot mixing, and semiconvection are the same as in the previous survey. For the assumed mass loss rates (Nieuwenhuijzen & de Jager, 1990), the entire hydrogen envelope is lost for stars with initial masses above 33 . Heavier stars thus die as Wolf-Rayet (WR) stars with smaller helium cores than would have existed had mass loss been neglected. For the mass loss rate adopted during the WR-phase (Wellstein & Langer, 1999), the core shrinks to the extent that the final compactness becomes small again, thus the compactness of very heavy massive stars when they die depends upon an uncertain prescription for mass loss.

The new survey (Fig. 2) includes non-rotating stars with solar metallicity and masses in the range 15 to 30 calculated in increments of 0.1 using the 1D implicit hydrodynamic code KEPLER (Table 1). Altogether, 151 models were simulated using the standard physics (for variations see § 4). Nuclear energy generation was calculated, up to oxygen depletion (central oxygen mass fraction less than 0.04), using a 19 isotope network (Weaver et al., 1978). A quasi-statistical equilibrium network and a nuclear statistical equilibrium network were used thereafter. However, a much larger “adaptive” network of up to 1500 isotopes was carried in parallel with the main structure calculation (Rauscher et al., 2002) and was used to calculate changes in the electron mole number, . This was particularly important during oxygen burning when the quasi-equilibrium network could not be employed, but substantial weak interactions were already changing the central structure. This is the same approach that was used by (Woosley & Heger, 2007), but a substantial improvement over what was done in Woosley et al. (2002). These models are collectively referred to as the “S series” stars - for “solar”.
In addition to confirming the distinct ”bump” previously seen around 23 the new study (Fig. 2) shows other interesting features. Fine scale variation of the compactness parameter persists throughout most of the mass range, but is particularly apparent between 19 and 21 . These features are further explored in § 3.
For this series of models, is small for main sequence stars lighter than 22 . It then rises rapidly to a peak, but declines again to lower values for main sequence masses between 26 and 30 . Above about 30 , results for these solar metallicity stars are clouded by the effects of mass loss reducing the helium core mass, but if mass loss is suppressed, the compactness stays large above 40 with a slight dip around 50 (Fig. 1 and ). These features pose a challenge to the conventional notion that the difficulty of exploding a star is a monotonically increasing function of its initial mass and instead imply that models below 22 and between 26 and 30 may be easier to blow-up than other masses. This could alter how we think about the galactic chemical evolution (Brown & Woosley, 2013).
In order to facilitate the comparison with low metallicity stars where the mass loss rate may be negligible, another series of solar metallicity models was calculated for stars above 30 in which mass loss was artificially suppressed. These are the ”SH models” covering the mass range of 30 - 60 with varying increments - 31,32,33,35,40,..,60 (Table 1). This survey was truncated at 60 because the effect of the pulsational pair instability became noticeable around 70 - 80 . The 60 model of the SH-series has a helium core mass of 27.5 (Fig. 4), far greater than that of any of the solar metallicity stars calculated with mass loss.
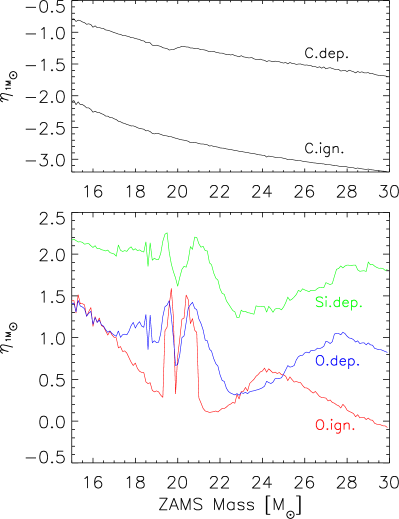
For all runs, the convective time history was recorded and checkpoints registered at representative points along the evolution including: 1) helium depletion - when helium reached 1% by mass in the stellar center; 2) carbon ignition - when the central temperature was K; 3) carbon depletion - when the central carbon mass fraction fell below 1%; 4) oxygen ignition - when the central temperature first reached K; 5) oxygen depletion - when the central oxygen abundance declined to 4%; 6) silicon depletion - when silicon mass fraction reached 1% in the center; and 7) presupernova - when any point in the core collapsed faster than 1000 km s-1. Subsequent discussion will refer to these points as representative of the stellar models at these different times as He.dep., O.ign., preSN., etc.
2.2. Low Metallicity Stars
Stars with equal masses on the main sequence, but differing initial metallicity can have different presupernova structure for a variety of reasons. Most importantly, metallicity affects the mass loss. If the amount of mass lost is very low or zero, the presupernova star, including its helium core, is larger, and that has a dramatic effect on the compactness (Fig. 1). There are also other less dramatic, but important effects. Low metallicity implies a smaller initial helium mass fraction (and more hydrogen). The final helium core mass is sensitive to this and is reduced. Nitrogen has an abundance just prior to helium ignition that is directly proportional to the initial metallicity and “nitrogen burning” by 14N(F(O is an important exoergic, convective phase in the star’s life that precedes helium burning. Low metallicity affects the energy generation during hydrogen shell burning by the CNO cycle, and this affects the boundary conditions for the helium core. Low metallicity also affects the opacity, and the combined effects of opacity, energy generation, and mass loss determine if the star is a red supergiant or a blue one when it dies. This is especially true for the non-rotating stars studied here. The more compact radiative structure of a blue supergiant envelope places greater surface boundary pressure on the helium core therein and can affect its evolution.
To illustrate the systematics of compactness in stars of low metallicity, we include here a previously unpublished set of non-rotating presupernova stars by Heger and Woosley with metallicity of 10-4 . These used the same physics as the S series, but had an initial composition of 76% hydrogen and 24% helium with only a trace, 10-4 solar, of heavier elements. The masses of these stars were 10 to 95 , though only a subset, 15 - 65 , is considered here. This restricted set, called the U series, contains 86 models with varying mass increments (0.2between 15 - 25, 0.5between 25-35 , 1between 35 - 45 and 5between 45 - 65 ; (Table 1). Other details of these models not related to their compactness will be published elsewhere.


The compactness of these low metallicity models is shown, along with those from S and SH series, in Fig. 3. Without mass loss, a much larger range of helium and CO-core masses is accessible (Figure 4). One sees a continuation of the overall increase in compactness parameter with increasing mass all the way up to 65 , but with new features. The compactness rises rapidly above 30 to a broad peak around 40 and then, following a dip at 50 , resumes its rise. All of the stars above 30 , with no mass loss, will probably be very difficult to explode by any solely neutrino-powered mechanism.

Below 30 , the compactness curve for the U series shows non-monotonic structure with peaks qualitatively similar to those observed for the S series in Figure 2, but with an offset of about a solar mass. The offset is most pronounced in the range 20 - 25 where the compactness starts to rise in the U series for a lower value of main sequence mass. The main cause of this shift is the lower mass fraction of carbon produced by helium burning in the U stars (Fig. 5). That value, in turn, affects the critical mass where carbon ceases to burn convectively in the star’s center (§ 3.1), shifting it to lower values, which causes the compactness curve to rise earlier (§ 3).

This variable nucleosynthesis of carbon for the S and U stars results from differing amounts of helium being mixed into the convective helium core as it grows during the final stages of helium burning. In fact, the carbon mass fractions for S and U stars in this mass range are very similar half way through helium burning, but as the helium mass fraction declines below 10%, the U stars are more effective at bringing additional helium in from their outer regions. Each helium convected down turns a carbon into an oxygen. The U stars have somewhat higher helium core luminosities at this point and the structure at the outer edge of the helium convection is also influenced by surface boundary pressure from the hydrogen envelope which is different for red and blue supergiants. Below 30 , the U-series stars are blue supergiants while the S-series stars are red ones (Fig. 6). The pressure at the edge of the helium core does not decline as steeply in a blue supergiant and the entropy barriers inhibiting convection in the outer helium core are slightly reduced. This makes the growth of the helium convective core easier. Convective dredge up in a red supergiant could also possibly reduce the helium core mass, though this effect seems to be small in the present models. With rotation, many of these lighter U-stars would also be red supergiants in the end because of primary nitrogen production at the hydrogen-helium interface, and the effect would be diminished. Above 30 the structure of the SH and U stars are very similar because both are red supergiants.
In the past, it has sometimes been assumed that the helium core mass uniquely determines the presupernova structure of a star and hence that structure would be roughly independent of the metallicity for two stars that made the same helium core mass. While this is qualitatively true, the figures here show that this assumption is not very accurate for supernova progenitors below 30 .
2.3. Choice of Fiducial Mass and Time for Evaluating the Compactness
With the new surveys, it is possible to address a point of possible concern - the choice of mass (2.5 ) and time (“PreSN model”) for evaluating the compactness in equation 1. The full evolution of a massive star to the point that its iron core collapses and possibly powers an explosion is being characterized by a single number here. What motivates the choice of this particular point in space and time?
Ugliano et al. (2012) explored the effect of evaluating at different fiducial masses and concluded that 1.75 might be a better discriminant of explosion characteristics rather than the 2.5 chosen here and in O’Connor & Ott (2011). The time of core bounce rather than initial collapse (“preSN”) also seemed a more relevant time for its evaluation. Recently, O’Connor & Ott (2013) also examined the choice of 1.75, since the early neutrino signal is more sensitive to the structure around the neutron star. Obviously smaller choices than 1.75 would not be sensible since they often lie within the collapsing iron core itself, and depend on different physics that occurs after that core has already reached high density, but what about values in between?
To address these questions, the collapse of the S series was continued until the central density reached g cm-3. This is about 100 times greater than the central density of presupernova S-series stars. Beyond this point, neutrino trapping and, ultimately, the nuclear equation of state, would influence the dynamics (Fig. 7). As expected, rises with increasing central density since a smaller radius encloses the same mass. It also rises as the mass chosen for its evaluation decreases, since the average density enclosed by r increases faster than r-2. Running KEPLER well beyond g cm-3 to nuclear density gives values of questionable accuracy, but strongly suggests that very little further evolution will occur in the compactness so long as the sampling mass remains greater than 1.75 . As the figure shows, the compactness evaluated at 2.5 changes very little during the collapse from the presupernova star to high central density. At that larger radius, the hydrodynamical response time is longer than the time for the denser part of the core to collapse.
Substantial variation does occur, however, for smaller sampling masses. Smaller fiducial masses show a non-linear amplification of the structure in the compactness curve with time. Large values get much larger than adjacent smaller ones, suggesting the development of islands of stars that may be hard to blow up. This is due to the tendency of high density regions to collapse faster under the influence of their own gravity and is particularly apparent for stars in the 18 to 22 mass range. This may account for some of the variability in outcome seen by Ugliano et al. (2012) for supernovae in this mass range.
The robustness of evaluated at 2.5 , however, and its strong correlation with the compactness evaluated at smaller masses suggests that we can continue to use our standard choices of time and mass for its evaluation. It should be kept in mind, however, that structures that seem small in some of the plots for presupernova stars may become amplified by the further collapse.
3. Physical Basis of the Behavior of the Compactness Parameter
Surveys of stellar evolution find a complex, non-monotonic behavior for the compactness parameter as a function of main sequence mass and metallicity. Why is this so? Why doesn’t the compactness vary smoothly with mass as it would in a polytrope with a single index?
Four factors drive the development of the compactness profile for massive presupernova stars. One obvious effect is the contraction of the core to higher densities in order to burn heavier fuels. This contraction increases the average density inside 2.5 and causes to grow with time. Another is the tendency of lighter stars to have lower entropy cores and be more degenerate. Degeneracy is responsible for the transition between stars that make planetary nebulae and those that make supernovae around 8 , but the effects of degeneracy on the post-carbon burning evolution continue to be important throughout the entire mass range studied here. Third, as has been noted previously (Barkat, 1994; Timmes et al., 1996), is the disappearance, around, 20 , of central convective carbon core burning. Above 20 , carbon fuses away without contributing a large excess of energy generation over what neutrinos are carrying away in the center of the star.
Fourth and frequently overlooked (though see Barkat 1994) are the effects of convective carbon and oxygen shell burning. Lighter stars can have three or more carbon burning shells in addition to core carbon burning (Fig. 8). As these stars evolve, their central regions become increasingly degenerate, especially after carbon depletion in the star’s center, and, by oxygen ignition, the concept of a Chandrasekhar mass has some approximate meaning, especially for stars lighter than 30 . Shells that burn outside the effective Chandrasekhar mass, roughly 1.7 depending on thermal corrections, but inside the point where the compactness is measured at 2.5 , will considerably modulate the compactness parameter.
3.1. Evolution Through Central Carbon Depletion
Fig. 9 shows that remains nearly independent of the main sequence mass until after carbon ignites in the core. Prior to this time, the fiducial point at 2.5 lies well within a much larger star or helium core that can be characterized by a single polytropic index. The tendency of to decrease as , as given by equation 2, is offset by the slight increase of the burning temperature with mass, resulting in a nearly flat curve.

By the time carbon has disappeared from the center of the star though, things have started to change. A pronounced dip in develops for the lower mass stars, and the curve shows an abrupt, small rise at 20 . For current code physics and solar metallicity, 20 is the mass below which carbon burns convectively (exoergically) at the stellar center as opposed to radiatively (endoergically). Convection brings additional fuel into the burning region increasing the effective supply by approximately the ratio of the convective mass to the mass of the burning region. Because of the high temperature sensitivity of the carbon fusion reaction, the energy generating region is small, so the enhancement is significant. During this longer time, neutrino losses carry away both energy and entropy, not only from the carbon convective core, but from the hot, overlying helium-rich layers supported by it. This loss of entropy exacerbates the natural tendency of lighter cores to have greater degeneracy and accelerates the development of a compact, white dwarf-like core structure - a dense degenerate core surrounded by a much less dense extended envelope.
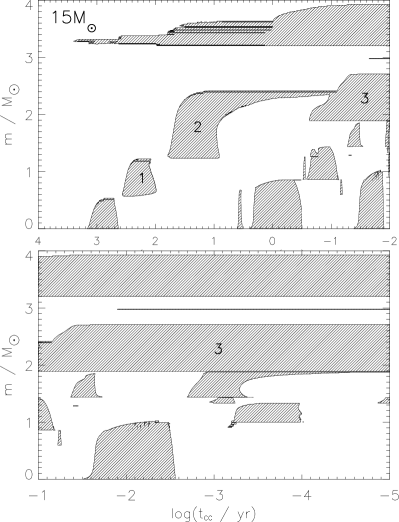
As Fig. 10 makes clear, central carbon burning, by itself, is not the whole story though. Most of the increase in central degeneracy occurs after carbon has been exhausted in the star’s center. It is during the period between central carbon depletion and oxygen depletion that neutrinos cool the core appreciably and, for masses below about 30 , give it a white dwarf-like structure. During this long cooling-off time, contraction of the inner core is frequently held up by two, or even three vigorous carbon burning shells (Fig. 11), the first igniting shortly after carbon core depletion typically about 0.5 from the center. As we shall see, the presence and location of these shells is strongly correlated with how carbon burns in the center, so 20 remains a critical mass. It is ultimately the timing and location of these carbon convective shells, however, not just central carbon burning, that account for the structure developed during and after oxygen burning.
3.2. Carbon Shell Burning
Fig. 12 shows the evolution of the compactness parameter for the S series stars from the time carbon is depleted at the center of the star until oxygen is similarly depleted. This is a critical period when the major features of the compactness emerge (Fig. 7).

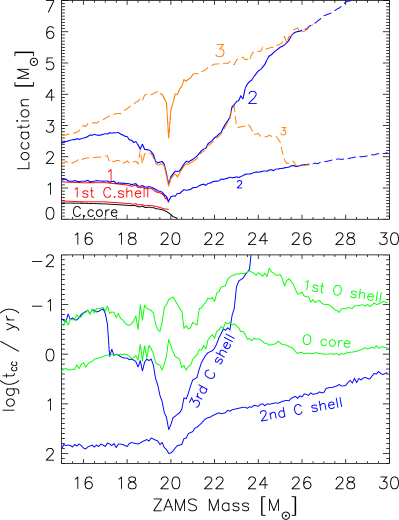
The typically low values for below 18 result from the operation of the first two convective carbon shells (Fig. 11). While the star is supported by these shells, its inner regions radiate neutrinos and become cool and degenerate. The rapid variation of in the range 18 to 21 reflects the response of these three shells to the disappearance of the convective core. When that happens, the first carbon burning shell disappears, and the second and third convective shells move inwards dramatically in response to its loss. These events do not happen simultaneously. The center of the star ceases to be convective at 20.3 , but the first shell has already gone out at 19.9 . The second and third shells ”migrate” inwards until this mass is reached, and then move outwards for bigger stars. The offsets in these masses and the rapid motion, first in, then out, of shells two and three underlie some of the complex structure in degeneracy and compactness seen around 20 .
From 21 to 30 , the compactness is most sensitive to whether, when oxygen core burning ignites, there is, or very recently has been an active carbon convective shell inside of about 2.0 (Fig. 13). An active shell supports the overlying star and relieves pressure on the oxygen core, allowing it to evolve as if it had a smaller effective mass. Smaller oxygen cores burn longer, emit more neutrinos, cool more effectively, and become more degenerate. The relevant carbon shell can either be the third (for 18 - 20 ) or the second (for 21 - 30 ) shell. If that shell is inside 1.4 , the oxygen core lacks sufficient mass to ignite (Nomoto & Hashimoto, 1988), so the most important mass range for the convective shell is 1.4 to 2.0 .
The location of the boundaries of these convective carbon shells are given in Fig. 11. The third convective shell is given there as a solid curve only for the mass range where it has a lifetime longer than one year. Shorter lived shells do not greatly affect the evolution prior to oxygen depletion. Based upon this criterion, the third shell only has a major effect in the range 19 to 21 . For heavier stars, the second shell dominates (note that, for the sake of continuity, we persist in calling it the “second” shell even though the “first” convective shell has been replaced by radiative burning).
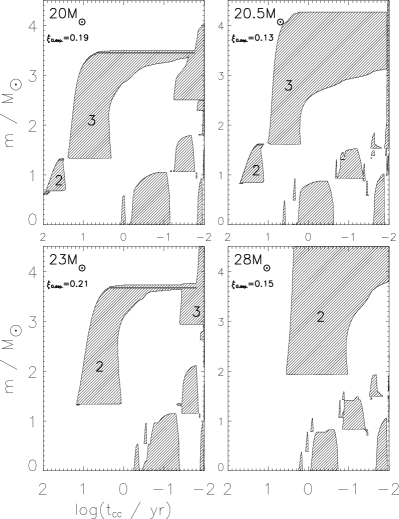
This behavior is illustrated by the convective history during carbon and oxygen burning for stars of four masses: 20.0, 20.5, 23.0 and 28.0 (Fig. 13). None of these four stars experience central convective carbon core burning or “first shell” burning (in 20 there is a very tiny convective carbon core). The relevant carbon shells are thus “2” and “3”, and they are labeled as such in the figure. At oxygen depletion, the 20.5 and 28.0 models have small values of (0.13 and 0.15, respectively), while the 20.0 and 23.0 have larger ones (0.19 and 0.21).
In the 20 model, shells 2 and 3 complete their major burning about a year before oxygen ignites in the stellar center. Shell 3 is located at 1.32 , which is too small to allow oxygen to ignite. Later, following a brief, inconsequential “blip” of convective neon burning, oxygen burning ignites in a core devoid of any nuclear energy sources out to more than 3 . The entropy is higher and the degeneracy is less at both oxygen ignition and depletion (Fig. 10). Oxygen burning ignites late, with less than a year remaining in the star’s life. Ultimately the star dies with a relatively large compactness parameter, 0.26.
The 20.5 model, though only slightly different in mass, has a very different evolution. The third carbon shell now has its base at 1.62 which is sufficiently large for oxygen burning to ignite before carbon shell burning is over. When oxygen does ignite at the center, the resulting expansion extinguishes the carbon shell, leaving unburned carbon in the region outside 1.62 . Some neutrino losses have already occurred in the oxygen before it ignited, but over the course of its burning, which commences much earlier than in the 20.0 model, more cooling occurs and the core becomes very degenerate. By oxygen depletion, the compactness parameter has a value of 0.13, which declines still further to 0.10 when the star dies.
For 23.0 , the evolution resembles that of the 20.0 model more than it does the 20.5 model. By now, the third carbon shell is igniting so late as to be unimportant. Shell 2, burning at 1.33 , however, again delays oxygen ignition to a late time. The oxygen burns in a core that, at the time has essentially no active burning shell except the helium shell far above it (off-scale). It is easier for the layers above the core to contract since there is a time with no active burning, neither core nor shell. Once it ignites, the oxygen core burns rapidly and at low density, producing a less degenerate silicon core. By oxygen depletion, the compactness parameter is 0.21 which rises to 0.42 in the presupernova star, the largest compactness of any model under 30 .
For 28.0 and nearby masses, the evolution resembles that of the 20.5 model, but with no third shell. The second shell has now moved out to 1.91 which is enough to allow core oxygen burning to ignite. There is always support by an active burning front, reducing the contraction of the outer core. Oxygen burning lasts longer and occurs in a core of smaller effective mass. The compactness at the end of oxygen burning is back down to 0.15, though this rises to 0.28 in the presupernova star.
Beyond 28 , the second carbon shell continues to move out and the effective core mass when it ignites oxygen grows. When the shell crosses 2.5 at 30 , the compactness parameter rapidly increases once more. This marks the end of the epoch of carbon shells. All heavier stars will have large compactness parameters (Fig. 3) with relatively small variations introduced by the oxygen burning shells.
The location and strength of the carbon shells prior to oxygen depletion thus sculpt a highly variable result out of what was a comparatively smooth curve at carbon depletion. In some sense, 20.5 and 28 stars resemble each other more at death than do 20.5 and 20 stars. Above 30 , the carbon shells lose their influence.
3.3. From Oxygen Depletion to Silicon Depletion
After oxygen finishes burning in the center, powerful convective oxygen-burning shells develop that can also modify the structure either by themselves, or by interacting with existing carbon shells. The continued evolution serves chiefly to amplify the features already present at oxygen ignition (Fig. 14). Having developed a degenerate core, further shell burning pushes matter out at 2.5 and reduces . The location of the first oxygen shell at silicon depletion correlates tightly with . Its base is located between 0.8 and 1.2 and is set by the extent of the oxygen convective core. Its extent correlates tightly with the location of its base. Similarly, the second oxygen shell, when there is one, sets atop the extent of the first. The farther out these shells and the later their ignition, the more extended the core, which results into a shallower density gradient around the iron core later on (higher ). The peak in in Fig. 14, around 23 to 25 , is enhanced by the migration outwards in mass of this oxygen burning shell. Unlike the carbon burning shells, however, the outwards movement of the oxygen burning shell is not monotonic in mass, since the extent of the oxygen core varies due to the effect of previous carbon shells. As it recedes inwards from 24 to 28 , the curve declines, leading to a pronounced dip at 28 to 30 . Above 30 , the oxygen burning shells move out rapidly.

3.4. From Silicon Depletion to Presupernova
Fig. 15 shows that, while the peak in at 23 continues to grow due to core contraction and the operation of the oxygen shells, the principal qualitative change in during this final stage of the star’s life is a “chopping up” of the peak that existed at silicon depletion around 20 into finer structures. Given that these structures will be amplified in the collapse (Fig. 7), they may yet affect the outcome of the explosion.

This rapid variation for a narrow range of masses results from an almost random decision by the star whether to burn oxygen or silicon in a shell first, the decision depending upon fine details of all that happened before. Fig. 16 shows the history of the convection following central silicon depletion in two stars of the S series with masses 20.1 and 20.2 . Note especially the timing of the ignition of silicon shell burning compared with the growing extent of the strong oxygen burning shell with a base at 1.71 in the 20.1 star and 1.59 in the 20.2 star. In both stars this convective oxygen shell is very powerful, and eventually grows to include both the carbon and neon burning convective shells in one large aggregate shell shortly before the star dies. The oxygen shell in the 20.1 star drives a similar linking of convective layers and creates a large positive energy generation rate, but only after the silicon shell has already burned out and the star is close to collapsing. In the 20.2 star, on the other hand, the strong oxygen shell ignites before silicon shell burning and operates for a much longer time.
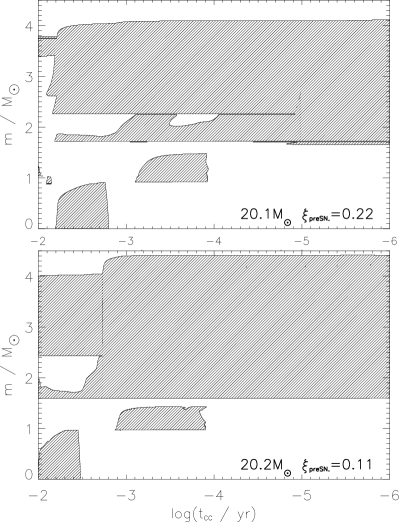
In the 20.1 star, oxygen shell burning initially generates, only a limited convection zone that slightly alters the structure of the star before silicon shell burning ignites and slows the contraction. In the 20.2 star, the oxygen shell becomes strong first and has already engulfed a large fraction of the CO core before the silicon shell ignites. The 20.1 star ends up with a high , the 20.2 star with a low one. The strong oxygen shell in the latter pushes matter out to larger radii and leaves a less extended structure inside.

This sensitivity of the presupernova compactness to the timing of oxygen and silicon shell burning suggests that a correlation might exist between the time from silicon core depletion to death and . This is indeed observed (Fig. 17). The longer the strong oxygen shell supports the star after the initial iron core has formed from central silicon burning, the smaller for the presupernova star.
These energetic, merged oxygen, neon and carbon burning shells during the last hours of a massive star’s life are a robust feature seen in many models of stars above about 15 - 20 , both here and in previous studies (Woosley et al., 1995; Tur et al., 2007; Woosley & Heger, 2007; Rauscher et al., 2002). Their study would be an interesting, though perhaps challenging topic for 3D simulation.
3.5. Fine Scale Variations and Convergence
If such small differences in the central structure of the star at silicon core depletion can lead to major changes in presupernova structure, even for stars differing in mass by only 0.1 , how sensitive might the results be to other “hidden variables”, such as the time step criteria and zoning. Fig. 18 shows that, for some masses, a substantial variation in outcome can also be caused by varying these variables. The location of the oxygen shell is a sensitive function of the many convective episodes that went on in the same star during its earlier evolution, and to the physics used to treat that convection.

As previously noted by Rauscher et al. (2002), this sensitivity to small changes is especially strong for the stars in the 19 to 21 range. To quantify this behavior better, a subset of the S series was calculated using the same code, compiler, and physics, but slightly altered zoning and time step criteria. In each case, the standard calculations were recomputed using 50% finer resolution (i.e., the default zone size), and, in separate calculations, the default time step was multiplied by and . Even these relatively small changes in operational parameters were frequently sufficient to provoke the star into two different final states. For comparison, we studied two distinct regions of main sequence masses, 17.1-17.5 - region ”A”, and 20.1-20.5 - region ”B”. As shown in Figure 2, the observed variations of in these two regions are quite different.
Panels 1A and 2A of Fig. 18 show that the solutions in region A are comparatively robust. Decreasing the time step and or changing the zoning does little to alter the final values of . Increasing the time step by a factor of does cause some mild variation, . Panels 1B and 2B of Fig. 18, however, show a much more pronounced sensitivity near 20 . The resulting values of seem to be bimodal. Small variations in mass, zoning, or time step can send the star down one path or the other. Typical models in the surveys used 20,000 time steps to reach the presupernova stage and employed approximately 1000 mass shells of variable thickness. It is certainly feasible to double or even quadruple both the resolution and time steps, but the values used here are already conservative. To test the effect of finer time steps, the 21 S-series models from 19 to 21 were rerun with twice as many time steps. While for some individual stars did change significantly, the overall appearance of the pattern, including its rapid, but bounded variation between = 0.1 and 0.25, did not.
3.6. Stars Over 30
Above 30 , if mass loss is neglected, the structure of the core becomes much simpler. The carbon shells have moved far out and no longer affect the solution. The oxygen core is larger and the oxygen shells farther out. Because of the larger mass, the degeneracy is reduced and the compactness is always large.
The most notable feature above 30 is a pronounced dip in around 50 . The dip is not large, but is seen in both the U-series and SH-series stars, albeit at slightly different masses (Fig. 3). It is also present in the compactness plot for the bare CO cores studied later in § 5.
This behavior can be traced to the presence of a strong, extended convective oxygen burning shell during the post-silicon burning evolution of stars over about 50 . The lighter stars lack this shell; the heavier ones have it. Starting at 50 for the U-series, this shell is present at silicon depletion with a base at 1.8 . Moving to heavier masses, the shell grows larger and its base moves outwards, reaching 2.5 at 65 . There is a sharp density decline at the base of the shell and because of this migration outside the fiducial point for measuring , the compactness parameter rises again as the star mass passes about 60 .
Whether this shell is present or not depends upon the timing of silicon core ignition and oxygen shell burning. Recall the key role played by the carbon shell and oxygen ignition for stars in the range 21 - 30 (§ 3.2). When the carbon shell was situated far enough out, oxygen burning would ignite before carbon shell burning was done with major consequences for the compactness. Here, the oxygen shell plays the role of the former carbon shell. If it burns far enough out, the silicon core can ignite earlier. In this case, however, igniting silicon does not blow out the oxygen shell. It persists until the end.

Fig. 19 shows the locations of various silicon and oxygen burning episodes as a function of mass for the SH-series models. Though it lacks the time dimension of a full convective history plot, the figure shows that the size of the oxygen convective core increases monotonically with mass for these heavy stars. Where the oxygen convective shell ignites is pegged to the extent of that convective core. At about 50 , the extent of the oxygen convective core passes the value needed to ignite silicon core burning. An oxygen shell ignites at the edge of that depleted core at about 1.8 . This is sufficiently large that silicon core burning also ignites, and after that, silicon shell burning, but both ignite without putting out the oxygen shell. Indeed, the oxygen shell persists until the iron core collapses and forces the compactness parameter down.
Above 50 , the compactness parameter continues to increase until about 70 , where the onset of the pulsational pair instability becomes important (Heger & Woosley, 2010).
4. Sensitivity to Code Physics
Studies of massive stellar evolution by different groups yield substantially different presupernova structures and nucleosynthesis. A key quantity is the CO core mass. The yield of elements heavier than helium, for an energetic explosion, is the difference between the mass of the collapsed remnant (neutron star or black hole) and the CO core mass. As we shall see, the compactness is also quite sensitive to this quantity. Table 2 shows the disparate values for the CO core mass obtained by various groups studying the problem. For example, a 20 star may end up with a CO core of anywhere from 2.71 to 6.59 for various choices of convective physics and assumptions about rotation. Even for non-rotating stars the range is 2.71 to 4.99 . Why are the values so different? Might using the CO core mass as a discriminant for the presupernova compactness alleviate some of the sensitivity to uncertain code physics?
The effect of rotation is not surprising. Rotation adds new mixing processes (e.g. Heger et al., 2000) that increase the masses of both the helium and CO core. Shear mixing in differentially rotating stars can also erase some of the sensitivity to the treatment of semiconvection and convective shell boundaries. The large residual range of CO core masses in non-rotating stars reflects these uncertainties in the treatment of convection and warrants discussion.
4.1. Sensitivity to Semiconvection and Overshoot Mixing
Uncertainties in the treatment of convection for non-rotating massive stars can be lumped into three categories: a) the use of time-dependent mixing length theory (MLT) to describe the overall transport; b) uncertainties in semiconvection, i.e., what to do about stellar regions that are unstable to convection by the Schwarzschild criterion, but not the Ledoux criterion; and c) the treatment of convective boundaries (i.e., overshoot and undershoot). A detailed review is beyond the scope of this paper. Most modern studies use time-dependent MLT, if only for the lack of a viable, implemented alternative. Semiconvection and convective overshoot can sometimes have similar effects since both allow convective regions on their tops and bottoms to grow smoothly when circumstances warrant it, and prevent the unrealistic fracturing of convective regions into multiple concentric shells. Semiconvection additionally slowly mixes regions that, owing to composition barriers, would not have mixed if the Ledoux criterion were strictly applied.
A relevant case in point is the convective helium core. It has been known for some time that the CO core mass is quite sensitive to the efficiency of semiconvection during helium burning (Langer et al., 1989). In situations where semiconvection is very small (or zero), a mathematical instability can develop that leads to the bifurcation of the helium convective core and the production of an unusually small CO core. In an algorithm that looks at the composition to determine convective instability (i.e., Ledoux criterion), a single zone that is marginally unstable might temporarily become flagged as stable due to a trivially small increase in the mean atomic weight (helium plus carbon and oxygen) in the zone beneath. If this zone is flagged as stable against convection, burning during the next time step will increase the atomic weight farther in the region that is still convectively coupled to the burning at the center of the star without raising it in the outer core. This makes convection between the two shells even more difficult. The helium convective core splits permanently into two pieces. In the outer one, helium never burns to completion and the resulting CO core for the star is small. If enough semiconvective mixing (or rotation) is included though, the splitting of the the convective core does not happen. In fact, considering the real situation in three dimensions, this numerical instability seems unphysical and should be avoided.
Overshoot mixing can also help bridge this artificial segregation. It also leads to an increased growth of the helium convective core at the end of helium burning that affects not only the CO core mass, but the carbon mass fraction when carbon burning ignites. Simulations by Meakin and collaborators (e.g. Meakin & Arnett, 2007; Viallet et al., 2013) confirm that some type of mixing will always take place at convective boundaries defined by either the Ledoux or Schwarzschild criterion, although the exact formulation of this mixing remains uncertain.
The treatment of convective overshoot and semiconvection in KEPLER has been discussed previously (Weaver et al., 1978; Woosley & Weaver, 1988; Woosley et al., 2002). Semiconvection is parametrized by a diffusion coefficient that is manufactured from the local convective diffusion coefficient and the radiative one:
| (3) |
where is the convective diffusion coefficient the zone would have had based upon the Schwarzschild criterion, and is a free parameter that multiplies the radiative diffusion coefficient, . Usually so that dominates the transport. The actual value of is not known, or even that such a simple formula captures the essential features of semiconvection. In past surveys using KEPLER, has usually been taken to be 0.1, and, unless otherwise specified, that is the value used in this paper. In practice, this generally assigns the semiconvective diffusion coefficient a value of near 10% of the radiative one.
Overshoot mixing is presently treated very crudely in KEPLER. Single zones at the top and bottom of regions flagged as unstable to Ledoux convection are slowly mixed with a diffusion coefficient given by equation 3. The convective diffusion coefficient is calculated based upon the Schwarzschild criterion:
| (4) |
with assumed to be a parametrized fraction,
| (5) |
and with having a default of 0.01. Typically the convective diffusion coefficient so calculated is much greater than so that the mixing occurs on a time scale given by this quantity. This prescription lacks a physical basis, but at least allows convective zones the liberty of slowly growing into regions where mild entropy gradients would otherwise disallow mixing.
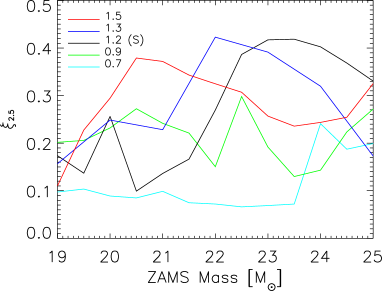
To explore the sensitivity of the compactness and the CO core mass to semiconvection and overshoot mixing, a subset of 16 solar metallicity models in the mass range of 15 to 30 was calculated multiple times using various settings for the both semiconvection and convective overshoot mixing multipliers. The masses studied were the integers from 15 to 30 and a total of 176 new models was calculated (Tables 1 and 2). In these, the semiconvective multiplier, , was varied from 0.001 to 0.1 (16 models each with = 0.001, 0.0025, 0.005, 0.0075, 0.01, 0.0125, 0.015, 0.0175, 0.02, 0.05, and 0.075 in addition to the standard models with = 0.1) and are collectively called SS series. Additionally, a set of 16 models was run with standard semiconvection ( = 0.1), but zero overshoot mixing () = 0 (SO series). All models were generated on the zero age main sequence and run until core collapse. The CO core mass does not change significantly after carbon depletion, however, and presupernova values can safely be compared with other studies that stop at an earlier time.
Fig. 20 shows that the compactness exhibits great deal of diversity depending on the efficiency of semiconvection. The mass resolution in these figures is significantly degraded by considering only 16 masses points between 15 and 30 , but the location of the peak in , when one exists, is clear. Reduced values of give smaller CO cores, more than spanning the space of published values. The carbon mass fraction at carbon ignition is also affected by the choice of convection physics, both in response to the altered CO core mass and the mixing of helium at the outer boundary of the helium core that is altered when semiconvection is turned off. Consequently the compactness, which is quite sensitive to both the CO core mass and the carbon mass fraction, vary significantly.

For small reductions in , the peaks found for in the standard runs is robust. Both the locations and amplitudes do not vary much. Though not explored, we expect that small changes upwards of would have given similar results. When declines below 0.02 however, significant changes occur. With smaller , it takes a higher mass main sequence star to give a specific CO core mass, so the peak that was at 23 shifts rapidly to higher values, ultimately leaving the grid. By = 0.01, the peak is no longer clearly discernible in the mass range examined.
Continued reduction in (bottom panel, Fig. 20) results in a compactness curve that loses most of its non-monotonic structure and increases steadily with mass. However, such small values imply a CO core that is small compared with all previous studies in the literature (Table 2). For = 0.001, the 15, 16 and 17 models closely resembled previous models calculated with KEPLER and other codes for stars with mass near 10 (Nomoto, 1987; Poelarends et al., 2008; Wanajo et al., 2009). Oxygen ignition occurs off center in these models and propagates as a convectively bounded flame to the stellar center (e.g. Timmes et al., 1994). A similar result was obtained for = 0.0025 for the 15 and 16 models. Such stars are known to have a very steep density gradient surrounding the iron core, which might be a boon to those trying to blow up stars in a wider mass range, but contribute almost nothing to the nucleosynthesis of intermediate mass elements. Were the observational limit on the maximum mass supernova to be pegged not far above 18 (Brown & Woosley, 2013), models of this sort would be inconsistent with the theory of stellar nucleosynthesis. A model with 12 and = 0.001 failed even to ignite oxygen burning and would likely become an AGB star with a degenerate neon-oxygen core and not a supernova. Since this would be in contradiction with a large volume of observational data showing that stars down to about 8 do explode, we must consider values of much below 0.01 as unrealistic.
Turning off convective overshoot mixing in KEPLER also has a significant effect on the CO core mass and carbon mass fraction, though not so extreme as that caused by large variations in semiconvection (Table 2). Fig. 21 shows the CO core sizes and final presupernova of the SO-series models compared with those from S series. The elimination of overshoot reduces the CO core sizes (top-panel), and as a consequence, the curve is shifted to higher masses. For example, central carbon burning shifts to being radiative at a higher mass compared to the S-series models with overshooting.

These results, which imply that the success or failure of exploding a presupernova model of given mass will vary appreciably depending upon who calculated the model and the description they used for convection physics, are troubling. However, semiconvection and overshoot mixing are real physical processes that will eventually be better understood. Some of the very small values for used here may not be physically realistic (e.g. Biello, 2001) and the high threshold mass that they imply for making a supernova is inconsistent with observations. Zeroing overshoot mixing is also unrealistic. Bifurcation of the helium convective core probably does not occur. Real stars rotate, and rotationally induced mixing reduces the sensitivity to semiconvection and overshoot mixing. We believe that our standard choices for and (0.1 and 0.01) are a good compromise for non-rotating stars since they avoid the unphysical splitting of the convective core, agree reasonably well with the results for rotating models (Table 2), and are not presently at odds with any existing physical prediction. Clearly this is an area where more work is needed. See Zaussinger & Spruit (2013) and references therein for some recent insights.

Our results also suggest that , and presupernova structure in general, will be more similar for two models having the same helium and CO core masses than for two that simply started with the same main sequence mass. Carrying this to the extreme, the outcome of the explosion of two stars with the same CO core mass will be more similar than for those having the same main sequence mass, but different CO core masses. Fig. 22 shows this to be approximately true. The offset in peaks seen in Fig. 21 for the stars calculated with and without overshoot mixing is greatly reduced if is plotted against CO core mass rather than main sequence mass. Similarly, the large discrepancy with the S series found for low values of semiconvection (e.g., ; Fig. 20) is significantly improved. Note that the allowed range of CO masses in the figure is much more limited for 15 to 30 stars if semiconvection is reduced significantly. Just what constitutes the “CO core mass” inside a massive star is ambiguous however, because there usually is no sharp decline of pressure at its edge (§ 5). Here we arbitrarily took the value inside of which the carbon mass fraction rose above 0.20. Differing values of the carbon mass fraction at carbon ignition due to changes in the initial composition or code physics must also be considered.
4.2. Survey of Solar Metallicity Stars Using MESA
Even similar physics often has different implementations in various stellar evolution codes, so to further explore the sensitivity of the compactness curve to the way it is calculated, we repeated part of our study using a completely different code. MESA (Paxton et al., 2011) is a popular code for the study of stellar evolution which has been successfully applied to a large variety problems in astrophysics and is freely available. MESA has recently been applied to the calculation of presupernova models (Paxton et al., 2013; Ibeling & Heger, 2013; Jones et al., 2013). It uses similar nuclear physics to KEPLER for energy generation during hydrogen through oxygen burning and a very similar equation of state and opacity tables. It can be constrained to use similar mass loss rates. Here the red giant mass loss rates of Nieuwenhuijzen & de Jager (1990) was used in both codes:
| (6) |
However, the two codes have quite different prescriptions for semiconvection and overshooting. Given the previous discussion, those differences can be expected to cause changes that might be educational. MESA also uses different nuclear physics during silicon burning and iron-core formation that affect the post-oxygen evolution. In particular, MESA continues to use a 19 isotope network to describe the energy generation and changes in composition after oxygen depletion, while KEPLER uses a 125 isotope “quasi-statistical equilibrium” (QSE) network (Weaver et al., 1978). The latter is more stable and less prone to spurious temperature transients and is also able to follow accurately the appreciable changes in electron mole number that happen in these late phases.
Since the major features of the pre-supernova (M) curve, including the existence and location of peaks, have already been imprinted by oxygen depletion, we elected to compare the results of the two codes at that point, not for the pre-supernova star. This way, the post-oxygen burning differences are avoided and also the run time greatly reduced. MESA is a continually evolving code while KEPLER is more “mature”, and for this study we used MESA version 4930. The stars studied are a subset (Table 1) of our S series, that is, non-rotating stars with solar metallicity.
This version of MESA employed Ledoux convection. For the mixing length parameter, , the free parameter was taken to be 2.0, which is within the range found in the literature. In those zones flagged as semiconvective, the Langer et al. (1983) model was used. This calculates the diffusion coefficient as:
| (7) |
where is the specific heat at constant pressure and the efficiency is tuned by the free parameter . We carried out a brief survey varying this parameter between -, and found its effect to be rather complicated. For the masses tested, this range of gave a spread of about in the CO core mass, difference in final mass, and a one order of magnitude change in radius. In general, for larger values () the MESA results approached that of the pure Schwarzschild case. The very low values, on the other hand, gave results that were very similar to one another, but quite different results were obtained using the larger values. The greatest sensitivity for the CO core size was found to be between and . In our survey was taken to be as a ”midpoint” between these two extremes, which is also well within the range used in literature (e.g. Yoon et al., 2006). We also note that the work to eliminate or greatly constrain this parameter is underway (Wood et al., 2013; Spruit, 2013).
Overshoot mixing in MESA is accomplished either by fully mixing the zones flagged as overshooting (”step” overshooting) or by applying an exponential cutoff to the diffusion coefficient calculated for convection in zones that are unstable by the Ledoux or Schwarzschild criterion. In our survey we have employed the exponential decay formalism, that is:
| (8) |
where is the diffusion coefficient from MLT, is the height, and , the pressure scale height. The efficiency is then controlled by the free parameter (see Herwig (2000),Paxton et al. (2011) for further details).

In general, the value of is quite uncertain as well (Meakin et al., 2011). A value of 0.016 was used by Herwig (2000) for his studies of AGB stars. Since the stellar context here is quite different, we have performed some additional test runs. The effects of five different choices for ranging from 0 to 0.025 were explored (Table 2). In the end, a value of 0.025 was selected for detailed study since it produced very similar CO core sizes to the S-series models calculated using KEPLER(Fig. 23). A value as small as Herwig’s had little effect and values much bigger than 0.025 resulted in the bump in compactness around 23 becoming very broadened and shifted to lower masses. Though our understanding of overshoot mixing is not adequate to rule this out, there was no compelling region to use larger values that would have given larger CO core masses for the heavier stars than previously published by others (Table 2).

Two sets of MESA models were ultimately calculated - one with overshooting (Mov series) and another without (M series). Each set had 16 models in the mass range of with increments, and both used the Ledoux criterion (Table 1). As expected, the results from KEPLER and MESA were nearly identical during hydrogen and helium burning, but started to diverge following helium depletion when the structure became more sensitive to the treatment of semiconvection and overshoot mixing.
As shown in Fig. 24, by carbon depletion, the discrepancy had become significant, especially around the critical mass for the extinction of central carbon convection, 20 , and continued to grow during oxygen burning.
Fig. 23 and Table 2 show the comparison at oxygen depletion between the KEPLER S series and MESA Mov series. The quantity for the Mov series shows a non-monotonic structure similar to that in the S series, but shifted in mass by about 2. Since the CO cores are nearly identical for Mov- and S-series models, the difference must result from either a different composition at carbon ignition or a different treatment of convection after carbon ignites, or both.
The carbon mass fractions at carbon ignition are indeed different in the two studies. Mass fractions in the Mov series range from 0.34 to 0.24, declining roughly linearly as the mass rises from 15 to 30 , while the corresponding limits for the S series are 0.21 to 0.18. The larger carbon abundance probably accounts for most of the shift in the peak of the Mov plot. As we shall see (§ 5), however, the treatment of post-carbon burning convection also matters. Even bare CO cores with identical initial compositions often have significantly different compactness when evolved to oxygen depletion in the two codes. The results from the M series are not shown in Fig. 23, but Table 2 shows that the resulting CO cores are much smaller, and the compactness thus differs appreciably, especially for the lighter stars.
Despite the shift, it is encouraging that the non-monotonic structure of as a function of mass in Fig. 23 and, qualitatively, the location of its peak, can be achieved using standard settings for convection physics in two very different codes. The study also highlights the dependence of the outcome on the CO core mass.
4.3. Sensitivity to Uncertain Nuclear Physics - 12C(O
Because of the sensitivity of the results to the carbon mass fraction at carbon ignition, outcomes will depend on the rates used for its creation and destruction. Three major reaction rates are involved, each of which has some associated uncertainty: 3, 12C(O, and 12C+12C.
It is the competition of 3 and 12C(O that sets the ratio of carbon to oxygen produced by helium burning. Increasing the former raises the carbon yield while increasing the latter makes it smaller. As we have shown, small reductions in carbon mass fraction tends to shift the compactness curve downwards, especially the critical mass, 20 , above which carbon burns radiatively.
The effects of varying the three uncertain reaction rates on massive stellar evolution, and nucleosynthesis in particular, have been previously explored by Weaver & Woosley (1993), Tur et al. (2007), and West et al. (2013) for , and 12C(O and by Pignatari et al. (2013); Bennett et al. (2012) for 12C+12C, but none of these works explicitly focused on how these rates affect the structure of presupernova stars. We will not attempt a survey of all possibilities at the present time, but focus here on just the one rate for 12C(O.
Historically, the large possible range for this reaction rate has been a source, perhaps even the major source of nuclear physics uncertainty in massive stellar evolution. Recent developments (e.g. Schürmann et al., 2012) have narrowed the error bar for this rate to less than 20%, which is not so much greater than the uncertainty in 3 (West et al., 2013). For small errors in the rates, it is the ratio of these rates that matters most, so variation of 12C(O can act, qualitatively, as a surrogate for exploring the uncertainty in 3.
The standard value used in this paper for 12C(O is 1.2 times Buchmann (1996, 1997) who used S(300 keV) = 146 keV b; that is, our effective S-factor at 300 keV, near the Gamow energy for helium burning, is 175 keV b. Schürmann et al. (2012) now report laboratory measurements and analysis that gives S(300 keV) = 161 19 stat - 2 sys + 8 keV b, or a range 0.9 to 1.3 times the Buchmann value. A subset of our S-series models was thus recalculated with varying multipliers on the Buchmann rate. Thirteen different masses of presupernova star were calculated in the mass range of 19 to 25 (0.5 intervals) for each multipliers of 0.7, 0.9, 1.3, 1.5 and 1.9 times the Buchmann rate (See Table 1). These are the SB series (Table 1).
Fig. 25 and Tables 2 and 3 show the results. Decreasing the rate for significantly increases the carbon mass fraction at helium ignition, but affects the mass of the CO core very little. The greater (or smaller) carbon mass fraction shifts the peak in , formerly seen at 23 for a multiplier of 1.2 to higher (or lower) values. For a multiplier of 1.9, the peak would disappear altogether, and is not plotted for clarity. However, such large values are outside the current experimental range. The current (1 ) error bar for the rate translates into a multiplier between 0.9 and 1.3, but even this smaller range can shift the explodabilty of massive stars enough to have a dramatic potentially observable effect on presupernova masses and nucleosynthesis. A total uncertainty of less than 10% in the combined error of 3 and may be needed to pin down the mass range of supernovae that explode by the neutrino transport model to an accuracy of less than 2 .
5. Surveys with Bare Carbon-Oxygen Cores
The importance of the CO core mass motivates a separate study of the compactness of presupernova stars evolved from bare CO stars of constant mass. It is to be emphasized that there is no direct correspondence between the results of evolving an isolated CO core and those obtained for a complete massive star with the same CO core mass embedded inside a helium core. The lack of a precipitous drop in density and pressure at the edge of a CO core inside a massive star results in an evolution that is qualitatively different. The definition of a CO core there, even by composition, is ambiguous (Hirschi et al., 2004). How does one count a partly burned helium shell (and these are a common case)? Nevertheless, CO cores are simple to evolve and bypass the uncertainties associated with convection during the helium burning phase. If they display the same sort of compactness systematics seen for the full stars, one can have greater confidence in the result.

A total of 380 CO cores were evolved using both KEPLER and MESA (Table 1). MESA used and and KEPLER used and . The calculations followed the evolution from central carbon ignition until the presupernova stage for the KEPLER cores and until the core oxygen depletion stage for MESA models. The core masses ranged from 3 to 25 with varying increments: 0.1 increments were used for 3 to 10 , 0.5 was used for 10 to 20 , and 1 was used for 20 to 25 . CO core masses of 3 to 9 correspond, approximately, to the main sequence masses of 15 to 30 studied in the S series. For low metallicity models (U series) or other models with no mass loss (SH series), the maximum CO core mass (at 65 ) was 25 , and that sets the upper limit. The physics used to calculate the CO core models was identical to that in the full star calculations.
The different mass fractions of carbon for the S and U stars (Figure 5), however, necessitated separate surveys. Because of convection, the composition of a CO core of given metallicity and mass can be taken as roughly constant. A good fit to the abundances in Fig. 5 is
| (9) |
The mass fraction of oxygen was in each case. These 4 sets of calculations are denoted as: KS, KU, MS and MU., i.e. - KS stands for KEPLER cores with initial composition from solar metallicity full stars (S Series), and MU stands for MESA cores with initial composition from low metallicity full stars (U series).
Fig. 26 shows at core oxygen depletion point for the 4 series (see also Table 1). The same sort of non-monotonic variation in seen previously in the full star models is evident in all cases but, as expected, cores with initial composition from U series (KU and MU), have their first peak at a lower mass than the cores with initial composition from solar metallicity stars (KS and MS). This same sort of offset was also seen in the curve for full stars of different metallicities (Fig. 3).

Above CO core masses of 11 , the differences between runs using KEPLER and MESA are minimal. Below that, one sees similar structures for KS and MS, for example, but there are differences. The major peak for the KS stars at 7 , is near 5.5 for the MS stars and the peak of KU stars is also shifted down about 1 in the MU stars. Even after removing the major dependence on CO core mass by running bare CO cores, there is still some residual difference resulting from the sensitivity of the location of carbon burning shells to convective and semiconvective physics in the two codes. The overall similarity of the patterns is encouraging, however. The compactness is non-monotonic with mass and there are regions of mass that will easier to explode than others.
The KEPLER calculations of CO cores were continued until the presupernova stage, and Fig. 27 shows the compactness parameter as a function of core mass for both the KS and KU series at this final stage. A comparison with Fig. 3 is interesting. The peaks at 22 and 23 in the full star models for the U and S series are reflected well in their equivalent mass CO cores, 5.8 and 6.2 , respectively. The good agreement continues to heavier masses where the dip at 50 for the U-series appears as a dip at 18.5 in the KU-series. The mass of the CO core in the U-model 50 star was indeed 18.5 . Similarly, although not so precisely, the CO core of the SH-series 55 star was 20.6 , close to the dip at 24 seen in the lower panel of Fig. 27. The maximum mass CO core in the SH series was 27 for the 65 model. For the U series, the corresponding CO core mass was 26 .
6. Conclusions
While characterizing the complex structure of a presupernova massive star with a single number is a gross over-simplification, considerable insight can be achieved by studying the systematics of the compactness parameter, . The compactness of a given presupernova core turns out to be sensitive to a variety of inputs, including not only the star’s initial mass and composition, but the way convection is handled in the code, the nuclear physics employed, and the code used for the calculation. Stellar modeling, at least of massive stars, is, in a sense, a statistical science. Different groups will almost universally obtain different results for the structure and composition of a non-rotating presupernova star resulting from a given main sequence mass star, even without the complication of mass loss. However, for the same input physics, there should exist a robust pattern of results that can be sampled by running a large set of models. This is a paper about one such pattern, the compactness parameter.
Our study confirms the non-monotonic nature of noted in previous works, and explores its causes. Fig. 7 shows that the choice of 2.5 as a fiducial point for evaluating the compactness, though arbitrary, is a good indicator of the behavior at other locations deep inside the star, but outside the iron core. Whether is evaluated at the “presupernova model ( km s-1), or at core bounce matters little at 2.5 , but for points deeper in, small variations seen in for the presupernova model are amplified during the collapse. Small variations in main sequence mass might therefore result in significant differences in outcome for an explosion model (Ugliano et al., 2012).
Extensive new surveys of presupernova evolution are reported for both solar metallicity and low metallicity (10-4 Zsun) stars (§ 2; Table 1). While the emphasis here is on presupernova structure and compactness, this is clearly a rich data set for exploring nucleosynthesis and supernova explosion physics, and this will be done elsewhere. Major differences are found in the presupernova compactness for stars of the same initial mass, but different metallicity (§ 2.2). The most obvious differences result from the differing degrees of mass loss expected for the two compositions, but there are subtle secondary effects involving the amount of helium convected into the helium core near central helium depletion. The growth of the helium convection zone results from a different structure at its outer edge which, in turn, is affected by the strength of the hydrogen shell, whether the star is a red or blue supergiant, and how much hydrogenic envelope remains following mass loss (in the solar metallicity stars). Even with mass loss suppressed, a substantial offset remains between presupernova stars of solar and low metallicity. Generally speaking, the low metallicity stars become difficult to blow up at a lower mass (Fig. 3) and may make more black holes.
The underlying cause for the non-monotonic behavior of with initial mass derives from the interaction of carbon-burning and oxygen-burning shells with the carbon-depleted and, later, oxygen depleted core (§ 3). As has been noted previously, the end of convective carbon core burning at around 20 for standard stellar physics, has a major effect, but not so much due to the entropy decrease during central carbon burning itself as to the effect this has on the ensuing shells. Above 20 , both central carbon burning and what was the first convective shell switch to radiative transport. Energy generation in excess of pair neutrino losses is unable to support core against further contraction, and the next two carbon convective shells are pulled down. Their gradual migration outwards again causes the rise and decline, and rise again of above 20 . Above 30 , rises to large values and, in the absence of mass loss, keeps on rising. There is an appreciable dip at about 50 , though, due to the outward migration of the oxygen shell which essentially plays the same role as the carbon shells did for lower mass stars.
Broadly speaking, then, the evolution of massive stars separates into four mass intervals characterized by similar values of . For a standard choice of physics and solar metallicity these are stars from 8 to 22 , 22 - 25 , 25 - 30 , and above 30 (e.g., Fig. 3). Stars below 22 and between 25 and 30 have low and might more easily explode. Between 22 and 25 and above 30 , it will be more difficult for the traditional neutrino-transport model to succeed. There can be large variations within those ranges and not all stars lighter than 22 will be easy to explode (Ugliano et al., 2012), but the distribution of stars that make black holes, for example, or important contributions to nucleosynthesis could be bi-modal. Galactic chemical evolution studies using such non-monotonic yields have yet to be done, but may give quite different results, e.g., for the s-process and oxygen synthesis (Brown & Woosley, 2013).
While the pattern seen in vs mass is robust, the locations of its peaks and valleys are sensitive to the treatment of semiconvection and convective overshoot in the code. These cause variations in the mass of the CO core and the carbon mass fraction when carbon burning ignites. Reducing semiconvection or convective overshoot makes the CO core smaller and this is a leading cause of the large variations seen in the literature for many studies of presupernova (Table 2). Smaller CO cores can mimic the effect of reducing the main sequence mass in a calculation where the convection physics is held constant and thus make cores with steep surrounding density gradients up to a higher mass. However these cores, while easier to blow up will be essentially nucleosynthetically barren. Extremely small values for semiconvective efficiency and overshoot mixing can lead to a discrepancy between the lightest stars expected to explode as supernovae based upon observations, about 8 , and that calculated by theory. Caution must be exercised when using the CO core mass as a discriminant, however, because the outcome is also very sensitive to the carbon mass fraction, and even to the treatment of convection after helium depletion.
Most of the models in this paper were calculated using the KEPLER code, but the MESA code was also used to calculate the compactness curve at oxygen deletion where its essential features have already been determined. Reasonable agreement is achieved between the two codes provided that some amount of semiconvection and convective overshoot mixing is used in both. The non-monotonic nature of the compactness plot, in particular, is apparent in the results of both surveys.
The effects of varying the uncertain reaction rate for 12C(O within its error range were also explored and found to have an appreciable effect. A total error of just 10% in the combined error for 3 and 12C(O can shift features in the compactness plot by a solar mass or more. To the extent the compactness is related to the difficulty of exploding a given model using neutrinos, the changes for nucleosynthesis and supernova “cut-off mass” are significant at that level.

Because the CO core mass plays such a major role in determining , we explored its systematics using a grid of “bare” CO-cores. These differ from the CO cores of massive stars which are defined by composition changes and do not have sharp declines in density and pressure at their edges. Nevertheless, the same non-monotonic compactness curve results. This both confirms the robustness of the relation found in the other surveys and suggests that, for a given presupernova model, its final CO core mass, not its main sequence mass might be a more accurate structural indicator. The same behavior was found for CO cores studied using MESA. Picking the CO core mass circumvents some, though certainly not all of the uncertainty introduced by ambiguous treatments of semiconvection and convective overshoot mixing during core helium burning. For WR stars and other stars that have experienced severe mass loss, the presupernova CO core mass will be the best indicator of presupernova structure. Even for bare CO cores, however, the mass fraction of carbon at carbon ignition remains an important “hidden variable” that will be sensitive to both the code physics and the metallicity of the star.
While this paper has emphasized the relation between compactness of the core and its explodability in terms of the neutrino transport model, the results are actually more general. Fig. 28 shows the binding energy of the matter outside of the iron core of the presupernova star as a function of its compactness. Stars with larger values of will be more difficult to explode by any mechanism, both because of the higher ram pressure immediately after collapse and the larger energy needed to eject the matter outside the iron core.
7. Acknowledgements
We gratefully acknowledge numerous valuable discussions with Alexander Heger and Bill Paxton regarding the KEPLER and MESA codes and their application to this problem. We also benefited from Alex’s expert insights into massive stellar evolution on many occasions, and his permission to include unpublished details of the “U series” low metallicity models. Casey Meakin and Evan O’Connor provided helpful comments on an earlier draft. We thank the anonymous referee for a careful reading of the submitted manuscript and many helpful suggestions. This research has been supported by the National Science Foundation (AST 0909129), the NASA Theory Program (NNX09AK36G), and the University of California Lab Fees Research Program (12-LR-237070).
| Code | series | evolution | mass-range | # of models | comments |
|---|---|---|---|---|---|
| KEPLER | S | ZAMS-g cm-3 | 15-30 | 151 | default |
| SH | ZAMS-preSN | 30-60 | 9 | no mass-loss | |
| U | ZAMS-preSN | 15-65 | 86 | , no mass-loss | |
| SS | ZAMS-preSN | 15-30 | 176 | weak semiconvection | |
| SO | ZAMS-preSN | 15-30 | 16 | no overshooting | |
| SB | ZAMS-preSN | 19-25 | 65 | varied | |
| KS | C.ign-preSN | 3-25 | 95 | CO core with S composition | |
| KU | C.ign-preSN | 3-25 | 95 | CO core with U composition | |
| MESA | M | ZAMS-O.dep | 15-30 | 16 | default |
| Mov | ZAMS-O.dep | 15-30 | 16 | with overshooting | |
| MS | C.ign-O.dep | 3-25 | 95 | CO core with S composition | |
| MU | C.ign-O.dep | 3-25 | 95 | CO core with U composition |
| 15 | 20 | 25 | boundary criteria | measured | comments | References | ||||
|---|---|---|---|---|---|---|---|---|---|---|
| at111Approximate points in the evolution where the core sizes were measured. The CO core size increases very slightly after C.dep, and almost not at all after O.dep. | ||||||||||
| 4.84 | 2.97 | 7.17 | 4.94 | 9.65 | 7.20 | (?) | C.dep | Maeder (1992) | ||
| 4.0222Calculations for bare helium cores. | 2.02 | 6.0222Calculations for bare helium cores. | 3.70 | 8.0222Calculations for bare helium cores. | 5.75 | in shells | O.dep | Thielemann et al. (1996) | ||
| 4.21 | 2.44 | 6.27 | 4.13 | 8.50 | 6.27 | Si.dep | Hirschi et al. (2004) | |||
| 5.68 | 3.76 | 8.65 | 6.59 | 10.0 | 8.63 | Si.dep | and rotation | Hirschi et al. (2004) | ||
| 3.85 | 2.19 | 5.70333Averaged from 5 different values with varying reaction rates and convection physics for the 25 model. | 3.54 | 5.18 | 7.73 | O.dep | El Eid et al. (2004) | |||
| 4.97 | 2.56 | 7.31 | 3.83 | 9.80 | 5.48 | in shells | preSN | Chieffi & Limongi (2013) | ||
| 5.37 | 3.59 | WR444Lost all of its hydrogenic envelope. | 5.53 | WR444Lost all of its hydrogenic envelope. | 6.63 | in shells | preSN | and rotation | Chieffi & Limongi (2013) | |
| 4.35 | 3.14 | 6.21 | 4.93 | 8.25 | 6.95 | preSN | KEPLER,S | |||
| 4.44 | 3.14 | 7.18 | 5.61 | 9.07 | 7.35 | preSN | and rotation | KEPLER | ||
| 4.29 | 3.08 | 6.27 | 4.99 | 8.50 | 7.18 | preSN | KEPLER, SS | |||
| 4.15 | 2.93 | 6.22 | 4.59 | 8.40 | 6.39 | preSN | KEPLER, SS | |||
| 4.09 | 1.96 | 6.00 | 2.95 | 8.30 | 4.40 | preSN | KEPLER, SS | |||
| 3.98 | 1.63 | 6.08 | 2.71 | 8.42 | 4.11 | preSN | KEPLER, SS | |||
| - | - | 6.22 | 4.96 | 8.28 | 7.00 | preSN | 1.5Buchmann | KEPLER, SB | ||
| - | - | 6.21 | 4.90 | 8.26 | 6.98 | preSN | 1.3Buchmann | KEPLER, SB | ||
| - | - | 6.17 | 4.96 | 8.23 | 6.99 | preSN | 0.9Buchmann | KEPLER, SB | ||
| - | - | 6.16 | 4.94 | 8.21 | 6.99 | preSN | 0.7Buchmann | KEPLER, SB | ||
| 4.19 | 2.70 | 6.11 | 4.38 | 8.14 | 6.27 | preSN | KEPLER, SO | |||
| 3.77 | 1.96 | 5.81 | 3.47 | 7.31 | 3.91 | O.dep | MESA, M | |||
| 4.01 | 2.21 | - | - | 7.80 | 5.16 | O.dep | MESA | |||
| 4.20 | 2.39 | - | - | 8.06 | 5.47 | O.dep | MESA | |||
| 4.41 | 2.61 | - | - | 8.34 | 5.81 | O.dep | MESA | |||
| 4.85 | 3.05 | 6.92 | 4.77 | 9.28 | 6.84 | O.dep | MESA, Mov | |||
Note. — -Eq.3; -Eq.5; -Eq.7; -Eq.8; - is the multiplier on the pressure scale height.
| Series | ZAMS Mass [] | CO Core Mass [] |
|---|---|---|
| S (KEPLER) | 20.3 | 5.03 |
| U (KEPLER) | 18.6 | 4.27 |
| Mov (MESA) | 23.0 | 5.47 |
| M (MESA) | 28.5 | 4.86 |
| KS (KEPLER) | 5.3 | |
| KU (KEPLER) | 4.6 | |
| MS (MESA) | 4.6 | |
| MU (MESA) | 3.9 |
Note. — The CO core boundary is defined as location where 4He drops below 0.2 in mass fraction.
References
- Barkat (1994) Barkat, Z. 1994, Supernovae, 31
- Bennett et al. (2012) Bennett, M. E., Hirschi, R., Pignatari, M., et al. 2012, MNRAS, 420, 3047
- Biello (2001) Biello, J. A. 2001, Ph.D. Thesis, University of Chicago
- Brown & Woosley (2013) Brown, J., and Woosley, S. E. 2013, ApJ, in press.
- Buchmann (1996) Buchmann, L. 1996, ApJ, 468, L127
- Buchmann (1997) Buchmann, L. 1997, ApJ, 479, L153
- Burrows & Lattimer (1987) Burrows, A., & Lattimer, J. M. 1987, ApJ, 318, L63
- Chieffi & Limongi (2013) Chieffi, A., & Limongi, M. 2013, ApJ, 764, 21
- Cooperstein et al. (1984) Cooperstein, J., Bethe, H. A., & Brown, G. E. 1984, Nuclear Physics A, 429, 527
- El Eid et al. (2004) El Eid, M. F., Meyer, B. S., & The, L.-S. 2004, ApJ, 611, 452
- Faulkner (2001) Faulkner, J. 2001, in Evolution of Binary and Multiple Star Systems, eds. Ph. Podsiadlowski et al., ASP Conference Series, 229, 3
- Faulkner (2005) Faulkner, J. 2005, in The Scientific Legacy of Fred Hoyle, ed. D. Gough, Cambridge Univ. Press, 149
- Fowler & Hoyle (1964) Fowler, W. A., & Hoyle, F. 1964, ApJS, 9, 201
- Fryer (1999) Fryer, C. L. 1999, ApJ, 522, 413
- Heger et al. (2000) Heger, A., Langer, N., & Woosley, S. E. 2000, ApJ, 528, 368
- Heger & Woosley (2010) Heger, A., & Woosley, S. E. 2010, ApJ, 724, 341
- Herwig (2000) Herwig, F. 2000, A&A, 360, 952
- Hirschi et al. (2004) Hirschi, R., Meynet, G., & Maeder, A. 2004, A&A, 425, 649
- Ibeling & Heger (2013) Ibeling, D., & Heger, A. 2013, ApJ, 765, L43
- Jones et al. (2013) Jones, S., Hirschi, R., Nomoto, K., et al. 2013, ApJ, 772, 150
- Langer et al. (1983) Langer, N., Fricke, K. J., & Sugimoto, D. 1983, A&A, 126, 207
- Langer et al. (1989) Langer, N., El Eid, M. F., & Baraffe, I. 1989, A&A, 224, L17
- Limongi & Chieffi (2006) Limongi, M., & Chieffi, A. 2006, ApJ, 647, 483
- Maeder (1992) Maeder, A. 1992, A&A, 264, 105
- Meakin et al. (2011) Meakin, C. A., Sukhbold, T., & Arnett, W. D. 2011, Ap&SS, 336, 123
- Meakin & Arnett (2007) Meakin, C. A., & Arnett, D. 2007, ApJ, 667, 448
- Nieuwenhuijzen & de Jager (1990) Nieuwenhuijzen, H., & de Jager, C. 1990, A&A, 231, 134
- Nomoto & Hashimoto (1988) Nomoto, K., & Hashimoto, M. 1988, Phys. Rep., 163, 13
- Nomoto (1987) Nomoto, K. 1987, ApJ, 322, 206
- O’Connor & Ott (2011) O’Connor, E., & Ott, C. D. 2011, ApJ, 730, 70
- O’Connor & Ott (2013) O’Connor, E., & Ott, C. D. 2013, ApJ, 762, 126
- Paxton et al. (2011) Paxton, B., Bildsten, L., Dotter, A., et al. 2011, ApJS, 192, 3
- Paxton et al. (2013) Paxton, B., Cantiello, M., Arras, P., et al. 2013, arXiv:1301.0319
- Pignatari et al. (2013) Pignatari, M., Hirschi, R., Wiescher, M., et al. 2013, ApJ, 762, 31
- Poelarends et al. (2008) Poelarends, A. J. T., Herwig, F., Langer, N., & Heger, A. 2008, ApJ, 675, 614
- Rauscher et al. (2002) Rauscher, T., Heger, A., Hoffman, R. D., & Woosley, S. E. 2002, ApJ, 576, 323
- Schürmann et al. (2012) Schürmann, D., Gialanella, L., Kunz, R., & Strieder, F. 2012, Physics Letters B, 711, 35
- Spruit (2013) Spruit, H. C. 2013, A&A, 552, A76
- Thielemann et al. (1996) Thielemann, F.-K., Nomoto, K., & Hashimoto, M.-A. 1996, ApJ, 460, 408
- Timmes et al. (1994) Timmes, F. X., Woosley, S. E., & Taam, R. E. 1994, ApJ, 420, 348
- Timmes et al. (1996) Timmes, F. X., Woosley, S. E., & Weaver, T. A. 1996, ApJ, 457, 834
- Tur et al. (2007) Tur, C., Heger, A., & Austin, S. M. 2007, ApJ, 671, 821
- Ugliano et al. (2012) Ugliano, M., Janka, H.-T., Marek, A., & Arcones, A. 2012, ApJ, 757, 69
- Viallet et al. (2013) Viallet, M., Meakin, C., Arnett, D., & Mocák, M. 2013, ApJ, 769, 1
- Wanajo et al. (2009) Wanajo, S., Nomoto, K., Janka, H.-T., Kitaura, F. S., Müller, B. 2009, ApJ, 695, 208
- Weaver et al. (1978) Weaver, T. A., Zimmerman, G. B., & Woosley, S. E. 1978, ApJ, 225, 1021
- Weaver & Woosley (1993) Weaver, T. A., & Woosley, S. E. 1993, Phys. Rep., 227, 65
- Wellstein & Langer (1999) Wellstein, S., & Langer, N. 1999, A&A, 350, 148
- West et al. (2013) West, C., Heger, A., & Austin, S. M. 2013, ApJ, 769, 2
- Wood et al. (2013) Wood, T. S., Garaud, P., & Stellmach, S. 2013, ApJ, 768, 157
- Woosley et al. (1972) Woosley, S. E., Arnett, W. D., & Clayton, D. D. 1972, ApJ, 175, 731
- Woosley & Weaver (1988) Woosley, S. E., & Weaver, T. A. 1988, Phys. Rep., 163, 79
- Woosley et al. (1995) Woosley, S. E., Langer, N., & Weaver, T. A. 1995, ApJ, 448, 315
- Woosley et al. (2002) Woosley, S. E., Heger, A., & Weaver, T. A. 2002, Reviews of Modern Physics, 74, 1015
- Woosley & Heger (2007) Woosley, S. E., & Heger, A. 2007, Phys. Rep., 442, 269
- Yoon et al. (2006) Yoon, S.-C., Langer, N., & Norman, C. 2006, A&A, 460, 199
- Zaussinger & Spruit (2013) Zaussinger, F., & Spruit, H. C. 2013, A&A, 554, 119