Sejong Open Cluster Survey (SOS).
II. IC 1848 Cluster in the H II Region W5 West
Abstract
IC 1848 is one of the young open clusters in the giant star forming Cas OB6 association. Several interesting aspects relating to star formation processes in giant star forming regions attracted us to study the initial mass function (IMF), star formation mode, and properties of pre-main sequence stars (PMS). A and H photometric study of the young open cluster IC 1848 was conducted as part of the “Sejong Open cluster Survey” (SOS). We have selected 105 early-type members from photometric diagrams. Their mean reddening is mag. Using the published photometric data with near- and mid-infrared archival data we confirmed the normal reddening law () toward the cluster (IC 1848). A careful zero-age main sequence fitting gives a distance modulus of mag, equivalent to kpc. H photometry and the list of young stellar objects identified by Koenig et al. permitted us to select a large number of PMS stars comprising 196 H emission stars, 35 H emission candidates, 5 Class I, 368 Class II, and 24 transition disk candidates. From the Hertzsprung-Russell diagram using stellar evolution models, we estimate an age of 5 Myr from several evolved stars and 3 Myr from the PMS stars. The IMF was derived from stars with mass larger than , and the slope is slightly steeper () than the Salpeter/Kroupa IMF. Finally, we estimated the mass accretion rate of PMS stars with a UV excess. The mean mass accretion rate is about in the mass range of to , whereas intermediate-mass stars () exhibit a much higher accretion rate of .
keywords:
open clusters and associations: individual (IC 1848) – circumstellar matter – stars:luminosity function, mass function – accretion, accretion disks1 Introduction
There are three well-known large-scale star forming regions (W3/W4/W5 – Westerhout 1958) in the Cas OB6 association. W5 (also called the IC 1848 H II region) is the eastern part of the molecular cloud complex and consists of two components W5 West and W5 East (Karr & Martin, 2003). There are four known O stars, HD 17505, HD 17520, HD 237019 and BD +60 586 in W5 West, while one visible O star HD 18326 is at the center of W5 East. All but HD 237019 are surrounded by many low-mass stars in clusters. These O stars are thought to be the ionizing sources of the H II region. The simple morphology of each H II region helps us to study the influence of strong UV radiation from massive stars on the surrounding materials and the triggering mechanisms for star formation (Koenig et al., 2008b). Hence, W5 is an ideal laboratory to study star formation processes with feed back from high-mass stars. The initial mass function (IMF) of this star forming region is also an interesting scientific issue. In this context, our target of interest is the IC 1848 cluster (hereafter IC 1848), also known as OCL 364, situated in the center of W5 West, containing the brightest star HD 17505, which is a multiple system consisting of an O6.5III, two O7.5V, and an O8.5V stars (Hillwig et al., 2006).
Many investigators (Lada et al. 1978; Vallée et al. 1979; Normandeau et al. 1997 and therein) provided radio maps at various frequencies to investigate the large-scale structures and the physical properties of the W3/W4/W5 complex. Since active star formation takes place in these regions, investigators have a continuing interest in the processes involved. Loren & Wootten (1978) and Thronson et al. (1980) studied star formation in W5 A (or IC 1848 A), which is a bright-rimmed molecular cloud to the eastern end of W5. Wilking et al. (1984) discussed many interesting observational aspects associated with the triggered star formation in W5. A census of embedded stellar sources in the W3/W4/W5 region have been published by Carpenter et al. (2000). The authors identified 19 clusters, with about half the stars in 5 rich clusters. Karr & Martin (2003) identified several young stellar objects (YSOs) using the IRAS point source catalog and found that the young stars are mainly distributed around the edge of the H II region. The authors argued from a comparison of evolutionary time scales that there is a distinct difference in the star formation history of the ionizing stars and the young stars on the border of expanding H II regions. Because of the presence of clumps evaporating away from the ionising sources and the shorter time scale for star formation under the assumed expanding velocities, they also suggested that radiatively driven implosion - star formation triggered by the strong UV radiation from young OB stars (Elmegreen & Lada, 1977) - may be the dominant triggering mechanism in W5. Spitzer/IRAC and MIPS imaging data, Koenig et al. (2008b) provided photometric data for more than 17,000 point sources and YSO classifications. The identified YSOs made it possible to study the clustering properties of these YSOs and to discuss plausible triggering mechanisms required to explain the distinct generations within W5. The high resolution IRAC and MIPS images revealed several isolated cometary globules and elephant trunk structures with polycyclic aromatic hydrocarbon (PAH) emission. Later Koenig & Allen (2011) studied the disk evolution of intermediate-mass stars. Cometary globules, bright-rimmed clouds, and H II region outflows are suggested as evidence of triggered star formation, and many studies have investigated the physical properties of these objects (Lefloch et al., 1997; Thompson et al., 2004; Koenig et al., 2008a; Niwa et al., 2009).
Several photometric studies (Sharpless, 1955; Johnson et al., 1961; Hoag et al., 1961; Becker & Fenkart, 1971; Moffat, 1972; Loktin et al., 2001) involving IC 1848 have been made in the optical bands. These studies provided useful photometric data and fundamental parameters, such as reddening, distance, and age for IC 1848. However, most analyses assumed a normal reddening law (), and the multiplicity of early-type stars was not fully taken into account. Furthermore, the limiting magnitudes were not deep enough to study the pre-main sequence (PMS) stars fainter than mag in the young clusters or associations in the Perseus arm.
Recently, a deep photometric study for IC 1848 W5 East has been made by Chauhan et al. (2011) with archival data. The authors presented the IMF for stars in the mass range from to , as well as their fundamental parameters. However, no deep optical photometric study has been made for IC 1848-W5 West. Since the results of Koenig et al. (2008b) provided very good membership criteria for the PMS stars with accretion disks, the age distribution and mass accretion rates of PMS stars, the star formation history within the region, and the IMF down to the regime can be studied. In addition, the Two Micron All Sky Survey (2MASS) (Skrutskie et al., 2006) and Spitzer/IRAC data (Koenig et al., 2008b) make it possible to test carefully the reddening law in a wide wavelength range.
The previously published distance to IC 1848, derived using various methods, is in the range 1.7 to 2.4 kpc. The photometric surveys mentioned above provided distances of 1.7 kpc (Sharpless, 1955), kpc (Chauhan et al., 2011), kpc (Johnson et al., 1961; Loktin et al., 2001), and 2.3 kpc (Moffat, 1972; Becker & Fenkart, 1971). Some studies have implicitly assumed that the distance to IC 1848 is the same as that to W3 or W4 (or IC 1805) (1.9 – 2.4 kpc). Georgelin & Georgelin (1976) independently derived a distance of 2.3 kpc using their Galactic rotation model. Early studies have relied on this distance. Recently, Xu et al. (2006) derived a distance of kpc for a W3OH maser using its VLBI parallax. Hillwig et al. (2006) preferred to use a distance of 1.89 kpc to match the observed and theoretical stellar radii. Since distance is a critical parameter in converting observational quantities to reliable physical parameters, we need to revisit its determination.
The Sejong Open cluster Survey (SOS) project is dedicated to provide homogeneous photometric data down to mag for many open clusters. The overview of the project can be found in Sung et al. (2013b) (Paper 0). The young open cluster NGC 2353 was studied as part of this project (Lim et al., 2011). This paper on IC 1848 is the third in the series. The observations and comparisons with previous photometry are described in Section 2. In Section 3, we discuss the reddening law in the direction of IC 1848 and present fundamental parameters estimated from the photometric diagrams. The IMF of IC 1848 and the mass accretion rates of PMS stars with UV excesses are presented in Section 4 and 5, respectively. Finally, we summarize the results from this study in Section 6.
2 OBSERVATION
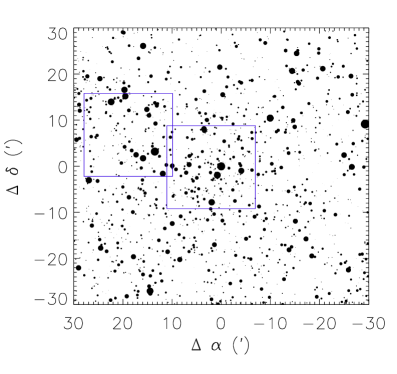
The observations of two regions associated with IC 1848 were made on 2009 January 19 using the AZT-22 1.5m telescope (f/7.74) at Maidanak Astronomical Observatory in Uzbekistan. All imaging data were acquired using the Fairchild CCD (SNUCam – Im et al. 2010) with standard Bessell (Bessell, 1990) and H filters. Lim et al. (2008) have described the characteristics of the CCD in detail. The mean seeing was better than 1, and sky conditions were good. The observations comprised a total of 20 frames that were taken in two sets of exposure times for each band – 5s and 60s in , 5s and 180s in , 7s and 300s in , 15s and 600s in , and 30s and 600s in H. We present the finder chart for the stars brighter than mag in Figure 1 using the Guide Star Catalogue version 2.3 (Lasker et al., 2008). The photometry for 12 stars that were saturated in our data were taken from previous studies. The photometric data and the adopted spectral types of the stars are presented in Table LABEL:tab1.
| ID | reference | Spectral type | reference | |||
|---|---|---|---|---|---|---|
| BD +59 556 | 10.06 | 0.36 | -0.12 | Hoag et al. (1961) | B9 V | Hoag & Applequist (1965) |
| BD +60 584 | 9.87 | 0.28 | Hg et al. (2000) | |||
| BD +60 586 | 8.48 | 0.30 | -0.67 | Johnson & Hiltner (1956) | O7.5 V | Hillwig et al. (2006) |
| HD 17505 | 7.06 | 0.40 | -0.64 | Johnson & Hiltner (1956) | O6.5 III((f)) | Hillwig et al. (2006) |
| HD 17520 | 8.27 | 0.32 | -0.68 | Johnson & Hiltner (1956) | O9 V | Conti & Leep (1974) |
| HD 17688 | 10.64 | 0.56 | -0.08 | Bigay (1963) | A7 V | Fehrenbach (1966) |
| HD 237007 | 9.44 | 0.33 | -0.30 | Johnson & Hiltner (1956) | B0 V | Morgan et al. (1955) |
| HD 237011 | 10.05 | 0.30 | Hg et al. (2000) | B1.5 V | Reed (2003) | |
| HD 237012 | 9.67 | 0.47 | Hg et al. (2000) | |||
| HD 237015 | 9.44 | 0.24 | -0.43 | Haug (1970) | B4 D | Reed (2003) |
| HD 237018 | 9.01 | 0.14 | Hg et al. (2000) | B9.5 V | Fehrenbach (1966) | |
| HD 237019 | 9.73 | 0.47 | -0.53 | Johnson & Hiltner (1956) | O8 V | Morgan et al. (1955) |
As described in Lim et al. (2008), all pre-processing to remove instrumental artifacts was done using the IRAF 111Image Reduction and Analysis Facility is developed and distributed by the National Optical Astronomy Observatories, which is operated by the Association of Universities for Research in Astronomy under operative agreement with the National Science Foundation./CCRED packages. In order to obtain daily parameters for transformation to the standard system, the atmospheric extinction coefficients and photometric zero points were obtained on the same night as the cluster observations through the observation of many equatorial standard stars (Menzies et al., 1991) at different air masses. We performed simple aperture photometry for the standard stars with an aperture size of and present the coefficients in Table LABEL:tab2. We carried out point spread function (PSF) photometry for target images using IRAF/DAOPHOT with the small fitting radii of 1 FWHM (), and then aperture correction was made by applying the differential magnitude between the fitting radii and the standard aperture radius (). The size of the aperture correction was determined from the aperture photometry of relatively bright, isolated stars with a photometric error smaller than 0.01 mag for each target image. Finally, the instrumental magnitudes were transformed to the standard magnitude and color indices using the transformation equations below (Sung et al., 2008),
| (1) |
where , , , , , , , , , and are the standard magnitude, instrumental magnitude, primary extinction coefficient, secondary extinction coefficient, transformation coefficient, relevant color, air mass, time-variation coefficient, time difference relative to midnight, and photometric zero point, respectively. A negligible time-variation of 1 mmag per hour in the photometric zero points was found in both the and bands. We adopted the recently modified transformation coefficients () for SNUCam from Lim et al. (2009). From the assumption that the luminosity function of all stars in the observed fields has a linear slope across the entire magnitude range we found that our photometry is 88% complete down to mag, which corresponds to . The photometric data for 15010 stars from this observation are available in the electronic table (Table 3) or from the authors (B. L. or H. S.).
We checked our photometry against previous studies in order to confirm its consistency. Only a few photoelectric photometric data sets for IC 1848 were found in the open cluster data base WEBDA222http://www.univie.ac.at/webda/. In addition, no photometric study with a modern CCD was reported for IC 1848. The photoelectric photometric data of Hoag et al. (1961) were compared with our CCD data for 9-11 common stars. The differences in the magnitude, the , and color indices are, respectively, mag, mag, and mag, where this - Hoag et al. Although the scatter seems to be rather large, our photometric zero points are in good agreement with those of Hoag et al. (1961). Since the photoelectric data of Hoag et al. (1961) are well consistent with those of Johnson & Hiltner (1956), we can conclude that our photometry is well tied to the Johnson standard system. On the other hand, it is impossible to directly test the consistency of our colors due to the absence of photoelectric or CCD photometric data. However, we were able to compare our CCD photometric data for the young open cluster NGC 1893, which was observed on the same night as IC 1848, with the CCD photometric data of other studies and found that our data are well consistent with previous studies (Massey et al., 1995; Sharma et al., 2007). In the comparisons with the photometric data of other studies no evidence for any difference depending on color indices was found. The details of the comparisons will be presented in the forthcoming paper (Lim et al. 2013, in preparation). In addition, as the ratio of total-to-selective extinction obtained from the color excess ratio of is consistent with that from other color indices (see Figure 6), our color is well tied to the Cousins standard system.
| Filter | (mag) | ||
|---|---|---|---|
| H |
3 PHOTOMETRIC DIAGRAMS
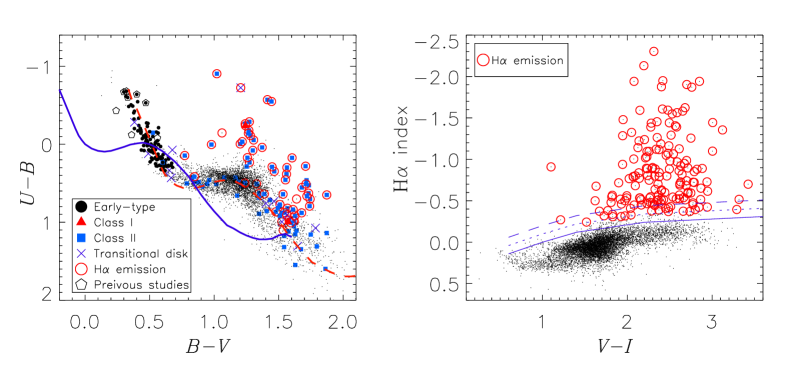
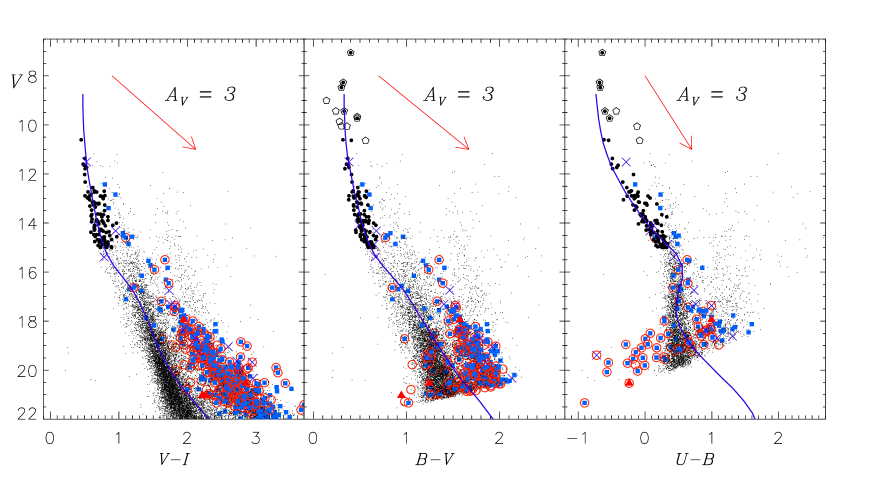
The fundamental parameters of open clusters are very important to study many scientific issues, such as the local spiral arm structure of the Galaxy, observational test of stellar evolution theory, the stellar IMF, the history of the star formation and chemical evolution in the Galactic disk, as mentioned in Paper 0. Such parameters should be carefully determined by using homogeneous photometric data. Traditionally, fundamental parameters of open clusters are determined from optical photometric diagrams. Although near-infrared (NIR) photometry gives much insight into faint or obscured objects owing to its less sensitivity to interstellar reddening, optical photometry is still a powerful tool to derive many fundamental parameters of stars, because it has well-calibrated empirical relations and provides relatively higher resolution color indices for massive stars. H photometry (Sung et al., 1997) and the classifications of YSOs in the W5 region (Koenig et al., 2008b) provide very useful membership constraints for the PMS stars in IC 1848. In this section we present the membership selection criteria, the reddening law, and fundamental parameters of IC 1848 from the two-color diagrams (TCD) in Figure 2 and the color-magnitude diagrams (CMD) in Figure 3.
3.1 Membership Selection
Early-type members (from O to late-B) can be selected from their photometric properties in the CMDs and the TCD. The criteria for the early-type members are (1) , , (see left panel of Figure 2 and Figure 3), , and Johnson’s , (2) an individual distance modulus between and to take into account the effect of binary members and photometric errors (Sung & Bessell, 1999; Kook et al., 2010; Lim et al., 2011), where and are the mean distance modulus and the width of the Gaussian fit of the distance modulus, respectively. The reddening of individual members was determined and corrected for (see Section 3.2). The distance to the star was estimated using the ZAMS relation from Table 3 in Paper 0. Finally we compared it with the average distance and the standard deviation of all members and candidates. In this procedure one star (ID 12815) was rejected from the list of members. Another star (ID 6138) was also rejected from the [] color excess ratio (Figure 6) due to a large deviation from the global trend. The star may be a foreground late-type star. We repeated this procedure until no further stars were rejected. In the end, 105 early-type stars were selected as members of IC 1848.
Since many PMS stars with an accretion disk exhibit X-ray emission, UV excess, H emission, and an infrared excess, H photometry is an efficient way to select PMS members for young open clusters ( Myr). Indeed, Sung et al. (1997) have successfully identified PMS members in NGC 2264 using H photometry. The authors and their collaborators have used H photometry to select PMS members in many young open clusters, NGC 6231 (Sung et al., 1998, 2013a), NGC 6530 (Sung et al., 2000), NGC 2244 (Park & Sung, 2002), NGC 2264 (Park et al., 2000; Sung et al., 2008), NGC 3603 (Sung & Bessell, 2004), and Trumpler 14 and 16 in the Carina nebula (Hur et al., 2012). We found 196 H emission stars and 35 candidates using the H index defined in the previous studies (Sung et al., 2000) and presented the stars (open circle) in the right panel of Figure 2. Stars which exhibit a weak H emission line are likely missed in a single observation because the strength of the H emission line varies with time. We included 26 additional stars with emission equivalent widths of H larger than 5 Å from Koenig & Allen (2011), which were not identified as H emission stars in our photometry.
Excess emission by dust in the circumstellar disk can be detected at NIR and mid-infrared (MIR) wavelengths. The excess due to dust emission is more prominent in the MIR than the NIR. But prior to Spitzer, the Wide-Field Infrared Survey (WISE), and Herschel era, ground-based observations at NIR wavelengths were restricted to large IR excess stars. As a result, many studies have attempted to identify PMS members through strong NIR emission in the () TCD. Now, owing to the vast survey of the W5 region in the MIR (Koenig et al., 2008b), we could easily select the young stars with a circumstellar disk. The optical counterparts of the MIR excess emission stars in Koenig et al. (2008b) were searched within a searching radius of , and we identified 397 YSOs (5 Class I, 368 Class II, 24 transition disk candidates). A total 462 PMS members were
| ID1 | 2 | Nobs | 2MASSID | H 3 | Sp4 | |||||||||||||
|---|---|---|---|---|---|---|---|---|---|---|---|---|---|---|---|---|---|---|
| 14941 | 02 54 54.43 | +60 33 01.6 | 21.820 | 19.149 | 2.671 | 0.108 | 0.043 | 0.116 | 1 1 1 0 0 0 | - | - | |||||||
| 14942 | 02 54 54.47 | +60 40 27.8 | 19.088 | 17.782 | 1.296 | 0.994 | 0.318 | 0.147 | 0.017 | 0.001 | 0.017 | 0.023 | 0.056 | 0.054 | 1 2 1 1 1 1 | - | - | |
| 14943 | 02 54 54.50 | +60 33 38.2 | 20.520 | 18.625 | 1.887 | 1.583 | -0.034 | 0.032 | 0.033 | 0.046 | 0.072 | 0.102 | 1 1 1 1 0 1 | - | - | |||
| 14944 | 02 54 54.50 | +60 39 56.9 | 21.789 | 19.122 | 2.667 | 0.092 | 0.046 | 0.103 | 1 1 1 0 0 0 | - | - | |||||||
| 14945 | 02 54 54.51 | +60 25 44.9 | 21.871 | 19.314 | 2.557 | 0.110 | 0.058 | 0.124 | 1 1 1 0 0 0 | - | - | |||||||
| 14946 | 02 54 54.51 | +60 35 00.0 | 21.333 | 18.909 | 2.419 | 1.021 | -0.904 | -1.949 | 0.059 | 0.029 | 0.066 | 0.103 | 0.142 | 0.075 | 1 1 1 1 1 1 | - | H | |
| 14947 | 02 54 54.52 | +60 31 22.2 | 19.802 | 18.202 | 1.586 | 1.210 | 0.489 | -0.027 | 0.024 | 0.009 | 0.026 | 0.038 | 0.082 | 0.068 | 1 2 1 1 1 1 | - | - | |
| 14948 | 02 54 54.56 | +60 27 40.6 | 19.663 | 18.043 | 1.606 | 1.165 | 0.394 | 0.053 | 0.023 | 0.003 | 0.023 | 0.035 | 0.097 | 0.060 | 1 2 1 1 1 1 | - | - | |
| 14949 | 02 54 54.56 | +60 37 37.6 | 16.727 | 15.435 | 1.287 | 1.158 | 0.662 | -0.019 | 0.007 | 0.015 | 0.017 | 0.007 | 0.014 | 0.017 | 2 2 2 2 1 2 | 02545454+6037376 | - | |
| 14950 | 02 54 54.57 | +60 33 54.0 | 20.510 | 18.792 | 1.705 | 1.344 | -0.144 | 0.028 | 0.021 | 0.035 | 0.056 | 0.072 | 1 1 1 1 0 1 | - | - | |||
| 14951 | 02 54 54.58 | +60 30 03.0 | 16.264 | 15.055 | 1.200 | 0.916 | 0.395 | 0.159 | 0.002 | 0.001 | 0.002 | 0.003 | 0.003 | 0.007 | 2 2 2 2 2 2 | 02545459+6030029 | - | |
| 14952 | 02 54 54.61 | +60 23 46.0 | 20.390 | 18.553 | 1.821 | 1.354 | 0.066 | 0.043 | 0.043 | 0.061 | 0.080 | 0.144 | 1 1 1 1 0 1 | - | - | |||
| 14953 | 02 54 54.61 | +60 39 26.0 | 20.104 | 18.541 | 1.550 | 1.155 | 0.043 | 0.030 | 0.038 | 0.048 | 0.041 | 0.100 | 1 1 1 1 0 1 | - | - | |||
| 14954 | 02 54 54.66 | +60 27 10.0 | 21.281 | 19.344 | 1.937 | 0.057 | 0.044 | 0.072 | 1 1 1 0 0 0 | - | - | |||||||
| 14955 | 02 54 54.66 | +60 39 33.2 | 19.562 | 18.122 | 1.429 | 1.138 | 0.311 | 0.107 | 0.015 | 0.004 | 0.016 | 0.029 | 0.065 | 0.064 | 1 2 1 1 1 1 | - | - | |
| 14956 | 02 54 54.68 | +60 26 41.0 | 21.290 | 18.269 | 3.021 | -0.316 | 0.070 | 0.019 | 0.072 | 0.111 | 1 2 1 0 0 1 | 02545466+6026409 | - | |||||
| 14957 | 02 54 54.68 | +60 26 50.0 | 20.026 | 18.183 | 1.827 | 1.343 | -0.083 | 0.027 | 0.023 | 0.035 | 0.048 | 0.076 | 1 1 1 1 0 1 | - | - | |||
| 14958 | 02 54 54.71 | +60 35 18.5 | 20.586 | 19.003 | 1.570 | 1.179 | 0.034 | 0.042 | 0.054 | 0.073 | 1 1 1 1 0 0 | - | - | |||||
| 14959 | 02 54 54.72 | +60 25 15.3 | 20.986 | 19.271 | 1.714 | 0.047 | 0.067 | 0.082 | 1 1 1 0 0 0 | - | - | |||||||
| 14960 | 02 54 54.75 | +60 39 16.6 | 19.986 | 18.361 | 1.615 | 1.388 | -0.147 | 0.025 | 0.042 | 0.049 | 0.043 | 0.080 | 1 1 1 1 0 1 | - | - | |||
| 14961 | 02 54 54.77 | +60 24 46.8 | 21.401 | 19.193 | 2.208 | 0.080 | 0.054 | 0.097 | 1 1 1 0 0 0 | - | - | |||||||
| 14962 | 02 54 54.83 | +60 23 25.4 | 19.485 | 17.504 | 1.972 | 1.599 | -0.068 | 0.025 | 0.042 | 0.049 | 0.046 | 0.084 | 1 2 1 1 0 1 | 02545478+6023253 | - | |||
| 14963 | 02 54 54.87 | +60 31 30.0 | 20.260 | 18.669 | 1.583 | 1.375 | 0.136 | 0.029 | 0.023 | 0.037 | 0.054 | 0.091 | 1 1 1 1 0 1 | - | - | |||
| 14964 | 02 54 54.88 | +60 32 32.9 | 17.459 | 16.242 | 1.208 | 0.947 | 0.261 | 0.110 | 0.001 | 0.003 | 0.003 | 0.006 | 0.013 | 0.005 | 2 2 2 2 1 2 | 02545487+6032330 | - | |
| 14965 | 02 54 54.89 | +60 24 18.7 | 20.259 | 18.320 | 1.927 | 1.467 | 0.167 | 0.034 | 0.036 | 0.050 | 0.060 | 0.114 | 1 1 1 1 0 1 | 02545493+6024182 | - | |||
| 14966 | 02 54 54.89 | +60 37 15.3 | 19.560 | 18.101 | 1.447 | 1.075 | 0.438 | -0.003 | 0.018 | 0.002 | 0.018 | 0.030 | 0.078 | 0.069 | 1 2 1 1 1 1 | - | - | |
| 14967 | 02 54 54.93 | +60 26 36.8 | 21.570 | 19.357 | 2.213 | 0.074 | 0.047 | 0.088 | 1 1 1 0 0 0 | - | - | |||||||
| 14968 | 02 54 54.93 | +60 36 08.3 | 21.135 | 19.113 | 2.022 | 0.048 | 0.053 | 0.072 | 1 1 1 0 0 0 | - | - | |||||||
| 14969 | 02 54 54.95 | +60 34 02.7 | 21.471 | 19.511 | 1.960 | 0.065 | 0.054 | 0.085 | 1 1 1 0 0 0 | - | - | |||||||
| 14970 | 02 54 54.97 | +60 34 35.6 | 21.595 | 19.833 | 1.762 | 0.067 | 0.082 | 0.106 | 1 1 1 0 0 0 | - | - | |||||||
| 14971 | 02 54 54.98 | +60 27 39.9 | 20.853 | 18.842 | 2.009 | 1.454 | 0.124 | 0.049 | 0.035 | 0.060 | 0.106 | 0.117 | 1 1 1 1 0 1 | - | - | |||
| 14972 | 02 54 54.99 | +60 37 45.4 | 15.276 | 14.075 | 1.195 | 1.045 | 0.478 | 0.051 | 0.008 | 0.017 | 0.019 | 0.008 | 0.003 | 0.019 | 2 2 2 2 2 2 | 02545498+6037454 | - | |
| 14973 | 02 54 55.04 | +60 24 44.7 | 21.713 | 19.558 | 2.156 | 0.113 | 0.072 | 0.134 | 1 1 1 0 0 0 | - | - | |||||||
| 14974 | 02 54 55.11 | +60 37 04.1 | 21.434 | 19.870 | 1.564 | 0.066 | 0.071 | 0.097 | 1 1 1 0 0 0 | - | - | |||||||
| 14975 | 02 54 55.13 | +60 29 01.7 | 20.780 | 18.986 | 1.783 | 1.507 | 0.037 | 0.045 | 0.029 | 0.054 | 0.085 | 0.120 | 1 1 1 1 0 1 | - | - | |||
| 14976 | 02 54 55.15 | +60 26 11.1 | 20.804 | 18.855 | 1.949 | -0.079 | 0.046 | 0.033 | 0.057 | 0.122 | 1 1 1 0 0 1 | - | - | |||||
| 14977 | 02 54 55.16 | +60 26 15.1 | 20.760 | 18.893 | 1.853 | 1.397 | 0.042 | 0.053 | 0.068 | 0.080 | 1 1 1 1 0 0 | - | - | |||||
| 14978 | 02 54 55.18 | +60 35 31.8 | 21.857 | 19.427 | 2.430 | 0.102 | 0.068 | 0.123 | 1 1 1 0 0 0 | - | - | |||||||
| 14979 | 02 54 55.22 | +60 23 05.0 | 19.978 | 18.181 | 1.784 | 1.414 | 0.079 | 0.032 | 0.038 | 0.050 | 0.058 | 0.117 | 1 1 1 1 0 1 | - | - | |||
| 14980 | 02 54 55.22 | +60 31 44.3 | 19.540 | 0.063 | 0 1 0 0 0 0 | 02545522+6031443 | - | |||||||||||
| 14981 | 02 54 55.22 | +60 40 05.1 | 21.551 | 18.649 | 2.902 | -1.392 | 0.088 | 0.043 | 0.098 | 0.112 | 1 1 1 0 0 1 | 02545519+6040051 | - | |||||
| 14982 | 02 54 55.23 | +60 25 34.1 | 19.176 | 17.586 | 1.578 | 1.193 | 0.307 | 0.074 | 0.020 | 0.017 | 0.026 | 0.033 | 0.066 | 0.058 | 1 2 1 1 1 1 | - | - | |
| 14983 | 02 54 55.23 | +60 27 15.2 | 20.342 | 18.611 | 1.718 | 1.334 | -0.034 | 0.037 | 0.026 | 0.045 | 0.072 | 0.094 | 1 1 1 1 0 1 | - | - | |||
| 14984 | 02 54 55.25 | +60 33 23.7 | 17.478 | 16.143 | 1.326 | 1.035 | 0.382 | 0.127 | 0.002 | 0.003 | 0.003 | 0.007 | 0.015 | 0.005 | 2 2 2 1 1 2 | 02545527+6033237 | - | |
| 14985 | 02 54 55.25 | +60 40 00.5 | 20.193 | 18.297 | 1.883 | 1.442 | -0.171 | 0.026 | 0.037 | 0.045 | 0.048 | 0.069 | 1 1 1 1 0 1 | - | - | |||
| 14986 | 02 54 55.28 | +60 38 42.1 | 17.320 | 15.974 | 1.334 | 0.988 | 0.483 | 0.093 | 0.002 | 0.042 | 0.042 | 0.009 | 0.018 | 0.042 | 2 2 2 2 1 2 | 02545526+6038420 | - | |
| 14987 | 02 54 55.29 | +60 25 00.7 | 20.842 | 18.941 | 1.899 | 1.488 | 0.059 | 0.073 | 0.094 | 0.112 | 1 1 1 1 0 0 | - | - | |||||
| 14988 | 02 54 55.29 | +60 34 43.6 | 20.481 | 18.792 | 1.682 | 1.499 | -0.072 | 0.036 | 0.030 | 0.047 | 0.080 | 0.099 | 1 1 1 1 0 1 | - | - | |||
| 14989 | 02 54 55.31 | +60 34 31.8 | 17.953 | 16.599 | 1.344 | 1.003 | 0.380 | 0.151 | 0.006 | 0.015 | 0.016 | 0.011 | 0.020 | 0.025 | 2 2 2 1 1 1 | 02545530+6034317 | - | |
| 14990 | 02 54 55.33 | +60 37 24.0 | 20.629 | 18.956 | 1.662 | 1.361 | -0.010 | 0.030 | 0.033 | 0.045 | 0.079 | 0.133 | 1 1 1 1 0 1 | - | - | |||
| 14991 | 02 54 55.35 | +60 33 59.5 | 21.502 | 18.803 | 2.699 | 0.080 | 0.035 | 0.087 | 1 1 1 0 0 0 | - | - | |||||||
| 14992 | 02 54 55.37 | +60 34 58.4 | 18.915 | 17.508 | 1.396 | 1.083 | 0.320 | 0.064 | 0.011 | 0.029 | 0.031 | 0.019 | 0.040 | 0.046 | 1 2 1 1 1 1 | 02545535+6034583 | - | |
| 14993 | 02 54 55.46 | +60 33 24.3 | 21.086 | 18.306 | 2.780 | 0.291 | 0.065 | 0.009 | 0.066 | 0.114 | 1 2 1 0 0 1 | - | - | |||||
| 14994 | 02 54 55.48 | +60 37 45.6 | 20.792 | 17.944 | 2.848 | 0.046 | 0.027 | 0.053 | 1 2 1 0 0 0 | - | - | |||||||
| 14995 | 02 54 55.55 | +60 34 06.8 | 19.123 | 17.497 | 1.616 | 1.351 | 0.965 | -0.095 | 0.014 | 0.021 | 0.025 | 0.025 | 0.148 | 0.039 | 1 2 1 1 1 1 | 02545561+6034065 | - | |
| 14996 | 02 54 55.58 | +60 40 30.2 | 21.191 | 19.150 | 2.042 | 0.071 | 0.055 | 0.090 | 1 1 1 0 0 0 | - | - | |||||||
| 14997 | 02 54 55.60 | +60 40 50.4 | 18.871 | 17.106 | 1.755 | 1.494 | 1.027 | -0.164 | 0.015 | 0.015 | 0.021 | 0.029 | 0.095 | 0.068 | 1 2 1 1 1 1 | 02545556+6040503 | - | |
| 14998 | 02 54 55.62 | +60 33 27.1 | 16.102 | 0.882 | 0.012 | 0.018 | 1 0 0 1 0 0 | 02545562+6033271 | - | |||||||||
| -1 | 02 51 07.97 | +60 25 03.9 | 7.060 | 0.400 | -0.640 | 1 0 0 1 1 0 | 02510801+6025037 | - | O6.5III((f)) | |||||||||
| -2 | 02 51 14.46 | +60 23 09.8 | 8.270 | 0.320 | -0.680 | 1 0 0 1 1 0 | 02511443+6023099 | - | O9V | |||||||||
| -3 | 02 50 34.90 | +60 24 06.7 | 9.440 | 0.330 | -0.600 | 1 0 0 1 1 0 | 02503490+6024067 | - | B0V | |||||||||
| -4 | 02 52 00.89 | +60 25 27.2 | 10.060 | 0.360 | -0.120 | 1 0 0 1 1 0 | 02520088+6025271 | - | B9V | |||||||||
| -5 | 02 51 35.71 | +60 32 51.4 | 10.050 | 0.300 | 1 0 0 1 0 0 | 02513571+6032513 | - | B1.5V | ||||||||||
| -6 | 02 51 36.48 | +60 33 11.7 | 9.670 | 0.470 | 1 0 0 1 0 0 | 02513647+6033116 | - | |||||||||||
| -7 | 02 54 10.66 | +60 39 03.5 | 8.480 | 0.300 | -0.670 | 1 0 0 1 1 0 | 02541067+6039036 | - | O7.5V | |||||||||
| -8 | 02 53 11.37 | +60 37 25.5 | 9.870 | 0.280 | 1 0 0 1 0 0 | 02531138+6037254 | - | |||||||||||
| -9 | 02 53 16.94 | +60 26 50.2 | 9.010 | 0.140 | 1 0 0 1 0 0 | 02531691+6026501 | - | B9.5 V | ||||||||||
| -10 | 02 53 28.47 | +60 27 35.0 | 9.730 | 0.470 | -0.530 | 1 0 0 1 1 0 | 02532845+6027348 | - | O8.0V | |||||||||
| -11 | 02 52 44.14 | +60 23 29.0 | 9.440 | 0.240 | -0.430 | 1 0 0 1 1 0 | 02524414+6023289 | - | B4D | |||||||||
| -12 | 02 52 57.60 | +60 28 16.8 | 10.640 | 0.560 | -0.080 | 1 0 0 1 1 0 | 02525759+6028167 | - | A7V |
| 1 The negative numbered ID represents the data from Johnson & Hiltner (1956); Hoag et al. (1961); Bigay (1963); Haug (1970); Hg et al. (2000) |
| 2 color index represents the H index [] |
| 3 H: H emission stars; h: H emission star candidates |
| 4 Spectral type – Morgan et al. (1955); Hoag & Applequist (1965); Fehrenbach (1966); Conti & Leep (1974); Reed (2003); Hillwig et al. (2006) |
identified in our photometry.
As seen in the () CMD of Figure 3 or 8, our membership selection constrains the PMS locus well. However, current membership are certainly incomplete, because the membership criteria of PMS stars mentioned above are biased toward stars with an active accretion disk. However, it is worth comparing the detection efficiency of low-mass PMS stars between H photometry and MIR data for stars brighter than (our photometric completeness is about or better than 88%). A total of 94 stars were classified as low-mass PMS members either from MIR excess emission or H photometry. Among them, 32 stars were detected from both MIR and H photometry. Interestingly, none of 5 bright transitional disk candidates () shows H emission. However, the H detection fraction of faint transitional disk candidates (% to –19 mag) is very similar to that of Class II objects (%). This fact implies that the faint transitional disks have similar characteristics to Class II objects, i.e. they are probably pre-transition disk objects (Sung et al., 2009). The reason for the absence of H emission among bright PMS stars with a transitional disk may be related either to the absence of a hot inner disk or to weak H emission with H emission equivalent widths smaller than 10 Å(Sung et al., 2008), or both. The detection efficiency of transitional disk candidates ( mag) from H photometry may be less than 23 % with respect to MIR excess emission. In this work, MIR excess appears to be a more efficient way to find PMS members than H photometry.
However, the detection efficiency from MIR and H photometry is not as high as X-ray observation and strongly depends on the age of a cluster because the excess emission is prominent in young PMS stars with a circumstellar disk and accretion activity. In addition, we know that weak-line T-Tauri stars (WTTS) are unlikely to be selected as PMS members from MIR or H photometry because most of the material in the disk of such stars has dissipated. Indeed, in NGC 2264, many WTTS without H emission or a MIR excess were identified as PMS by X-ray observations (Sung et al., 2009), and their photometric properties were found to be similar to those of MS stars (Flaccomio et al., 1999). Almost complete lists of PMS members in NGC 2264 and NGC 6231 have now been identified down to their limiting magnitude using X-ray sources from the Chandra data archive (Sung et al., 2008) or from XMM-Newton observation (Sana et al., 2006). Up to now, no extensive X-ray observations for the IC 1848 region exist, so we note that a large number of WTTS or low-mass PMSs with weak accretion activity are likely missed in our membership selection.

3.2 The Reddening
The interstellar reddening toward young open clusters is, in general, derived by comparing the observed color indices of the early-type members with the intrinsic () diagram. Using the intrinsic color-color relation from Table 1 in Paper 0 we determined the individual reddening of early-type members of IC 1848. The reddening slope was simply assumed to be because the dependence on is negligible for less reddened stars [ mag]. The mean reddening value was estimated to be (s.d.) mag and displayed in the left panel of Figure 2 as a dashed line. This value is in good agreement with that of previous studies, e.g., = 0.55 – 0.70 mag – (Johnson et al., 1961), 0.66 mag – (Becker & Fenkart, 1971), 0.72 mag – (Moffat, 1972), and 0.60 mag – (Loktin et al., 2001).
From the spread of the early-type members in the diagram, one can see that there is a non-negligible amount of differential reddening across the observed region. In order to investigate the spatial variation of the reddening we constructed the reddening map of the observed regions using the position and reddening of individual early-type members. The observed field was divided into 10,000 rectangular areas, each of which has the size of in right ascension and declination, respectively. The weighted-mean reddening of each point is calculated from the reddening of 105 early-type members, where the weight is exponentially decreasing with the distance from individual early-type members. We present the reddening map of IC 1848 in Figure 4. The massive molecular cloud W5 NW in W5 West lies in the northern part of the cluster (see Figure 1 of Wilking et al. 1984 and Koenig et al. 2008b). O type stars, HD 17505, HD 17520, and HD 237007, in W5 West are responsible for the ionization of the molecular clouds (Karr & Martin, 2003), and bright rims lie along the ionization front (Wilking et al., 1984). These could be evidence that the stellar wind and UV radiation from three O type stars are compressing the molecular cloud. On the other hand, the reddening map of the southern part is rather transparent compared to the northern part, and one could expect that the material in the southern part might have been rapidly swept away. Thus, the large scale variation of reddening shows the systematic difference between the northern and southern part of the cluster. Another O star BD +60 586 () is located in the valley of reddening between two molecular clouds W5 NE and W5 NW. The structure in the reddening map may reflect the interaction between the O stars and the surrounding materials. A similar feature was found in NGC 6231 (Sung et al., 2013a). From this, we deduce that the strong stellar wind from O stars can sweep away the surrounding medium. In contrast, Lim et al. (2013) found the highest reddening value to be in the center of the starburst cluster Westerlund 1 and interpreted this as resulting from dust formed from the ejected material from the many Wolf-Rayet stars. These observations indicate that within IC 1848, dust destruction may be more dominant than dust production. However, unlike the other O type stars, HD 237019 () lies in a highly reddened region. According to a formation scenario of W5 West suggested by Koenig et al. (2008b) the star could be ejected from the cluster by gravitational interaction between massive stars in the cluster center. If this scenario is true, the star may not have had enough time to interact with the surrounding material.
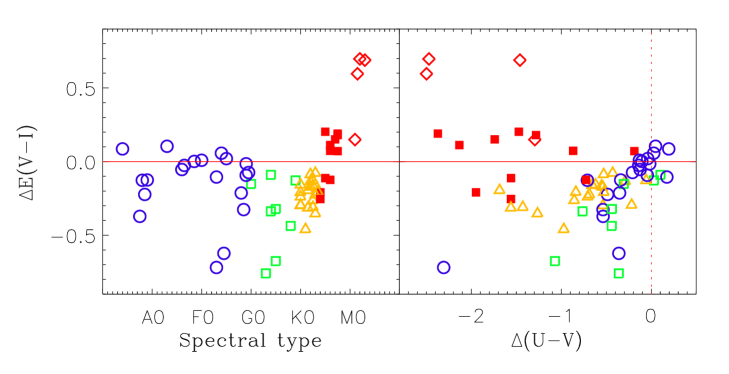
To check the reliability of the reddening corrections for PMS stars in our analysis, we compared the reddening from Figure 4 with that from the spectral type. Recently Koenig & Allen (2011) published the spectral types of 389 stars in the W5 region. Among them, 63 stars with , , and color indices in our data, were used in this comparison. The spectroscopic reddening was obtained by comparing the observed color with the intrinsic color inferred from a given spectral type (Paper 0). One can expect that the mean difference would be close to zero with a random scatter, and that spectroscopic reddening could be higher for few stars due to their internal extinction. We present the comparison in the left panel of Figure 5, where negative values mean that spectroscopic reddening is larger than that from our reddening map. For B – early-F and K5 – late-K type stars, the reddening shows reasonably good agreement. However, the spectroscopic reddening is 0.2 mag higher than ours for late-F – K4 type stars, and systematically lower for M type stars.
In order to find the main causes of the differences we checked our intrinsic relations in Paper 0, which is based on the (, ) relation by Cousins (1978) with the spectral type - color relation of Bessell & Brett (1988). The difference is less than 0.02 mag, and therefore it is unlikely to be caused by the spectral type – () relation. We also compared the reddening map from optical photometry with that from the 2MASS data. With and of the early-type members (see next section) the NIR reddening map was constructed through the same procedure as the optical reddening map. The spatial variation of the reddening is compatible with that of the optical photometry. In addition, we also checked the spatial distribution of the G – M type stars which showed a systematic difference in reddening derived from the two different methods. If our reddening map exclusively provides small/large value of reddening toward any specific direction, this method of reddening correction may be inappropriate for the PMS members. However, the late-type PMS stars were distributed uniformly, thus the application of the reddening map may have nothing to do with the discrepancy.
The other possibility is that the spectral types of the stars were classified as earlier types due to veiling filling in some of the lines. Koenig & Allen (2011) described their classification schemes without any discussion on the veiling effect. Since the software SPTclass (Hernández et al., 2004) provides the spectral type based on the equivalent width of the spectral lines of O8–M6 type MS stars (see their webpage333http://dept.astro.lsa.umich.edu/hernandj/SPTclass/sptclass.html), veiling effect could make the spectral classification of PMS stars tricky. The classification schemes in SPTclass are optimized for Herbig Ae/Be, late F– mid K, and mid K – M type stars, respectively. The classification for late F – mid K type stars includes 11 spectral indices in the relatively narrow spectral region (from 4200 Å to 6200 Å), and thus it can be affected by veiling. Furthermore there are fewer number of spectral indices than for Herbig Ae/Be and later type stars. Hence, the spectral classification of PMS stars could be misled by the presence of non-photospheric contributions. According to the spectral indices for F, G, and K type stars, e.g. Ca I , Fe I 4458, and Fe I 5329, the equivalent width of the lines increases with spectral type. If optical spectra of PMS stars with veiling exhibit decreased line depths, the equivalent widths of the spectral indices will appear to be that of earlier types. Therefore veiling would shift the spectral classification to earlier types. If the speculation is correct, the stars should exhibit a UV excess. We plot UV excess, , derived in Section 5, with respect to the discrepancy in the reddening in the right panel of Figure 5. The stars possibly classified as earlier spectral type are expected to be located in the lower left side of the panel. Indeed, they (F0 – K4 type PMS stars - circle, open square, and triangle) locate in the expected region, while stars without a UV excess are clustered at and .
However, K5 – M type stars show a systematic and opposite trend. As the strength of TiO and CaH bands are used for the classification of mid-K to M type stars, the spectral classification should be correct. In addition, these red bands would be little affected by non-photospheric contributions. As shown in the right panel of Figure 5, K5 – K9 type stars (filled square) are close to zero in , although most of them exhibit a UV excess. However, 3 (ID 10938, 13480, and 14932) out of 4 M type stars with and color indices show a small spectroscopic reddening of mag, which is an unrealistic value for IC 1848. We also checked the position of the stars in Figure 8 and found them to lie in the PMS locus. These facts imply that they have too-late a spectral type. According to Koenig & Allen (2011) those stars are identified as Class II objects with strong H emission, and our H photometry also tags them as H emission stars. They must be very young stars of IC 1848, and therefore we attribute this discrepancy to a gravity effect on the spectra of young PMS stars. Many studies (Luhman et al., 1997, 1998; Briceño et al., 1998; White et al., 1999) remark that the spectral features of young PMS stars between 6000 Å and 9000 Å resemble those of giant stars and we note that the inclusion in the spectral classification methodology of a Na I index, that is very gravity sensitive, would help discriminate between giant- and dwarf-like M spectra. Given the weaker TiO bands of MS stars compared to giant stars, it is possible that the stronger bands of a PMS star can lead to them being assigned a later dwarf spectral type.
The same trend as in Figure 5 can also be found in the published data ( and spectral type) of Koenig & Allen (2011). We investigated their values with respect to the spectral types. The values of G – K type stars appear to be higher than those of other spectral types. The mean of B – F0 type stars is about 1.5 mag, but the values of G5 type stars have a range of 2.0-2.6 mag. The differences between two groups with different spectral types in is about 0.21-0.45 mag. These values are in good agreement with those found in Figure 5. In addition, the values of K – M type stars decrease with the subclasses. The feature is the same as that found in Figure 5. These facts imply that the discrepancy found in Figure 5 originates from the published data of Koenig & Allen (2011). We therefore conclude that the application of our reddening map is more reliable than the reddening correction inferred from previously published spectral types in the current state and does not cause serious problems, except for a few PMS stars with nearly edge-on disks.
3.3 The Reddening Law
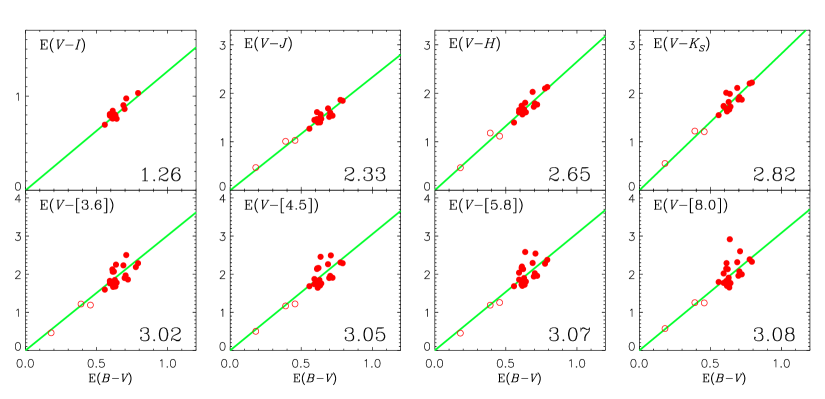
Dust evolution in star forming regions is one of the more interesting issues in astronomy, since the grain size is directly related to the reddening law toward an object of interest. Many studies (Rieke & Lebofsky, 1985; Guetter & Vrba, 1989; Lim et al., 2011) have confirmed that the extinction law in the Solar neighbourhood, the Galactic center, or in moderately young open clusters and associations is nearly the normal law (a total-to-selective extinction ratio of ). However the value is significantly larger for several extremely young star forming regions (see Table 3 in Greve 2010). For IC 1848 several previous photometric studies (Johnson et al., 1961; Becker & Fenkart, 1971; Moffat, 1972) have assumed a normal reddening law. Recently, Chauhan et al. (2011) found different in four different regions within W5 East. Since the ratio of total-to-selective extinction is a useful tool to study the state of dust evolution in star forming regions, and since the value is critical in the canonical determination of distance, we tested the reddening law in IC 1848 using color excess ratios.
Using the NIR 2MASS data and MIR Spitzer data of Koenig et al. (2008b) it is possible to determine the reddening law toward IC 1848 in a consistent way from the optical to the MIR photometry. To calculate the color excess ratios , observed color indices were compared with the intrinsic colors for the 2MASS bands, from Table 2 in Paper 0, and the Spitzer IRAC bands (Sung et al. 2013, in preparation). In this analysis, we used 21 of the most probable normal MS stars among 105 early-type members with color index smaller than -0.2 mag, to exclude the young active stars which could potentially affect the color excess ratios. In addition, three foreground stars were also used to investigate the foreground reddening law. The color excess ratios obtained from such stars are plotted in Figure 6.
We confirmed that the color excess ratios of foreground stars (open circle) and early-type members (dot) of IC 1848 are well-consistent with the solid line corresponding to the normal reddening law (). Unlike the optical band and the NIR band, there is a slightly large scatter in the MIR bands. There are two possible sources of scatter. We carried out PSF photometry for the point sources in four sets of the long-exposed Spitzer images (Program ID: 20300, PI: Allen, Lori) for the W5 region. The photometric data were compared with those of Koenig et al. (2008b) and the Glimpse 360 catalogue where 3.6 and 4.5 µm bands are available. The photometric data are consistent with each other within 0.05 mag in the zero points, except for the 4.5 µm band ( mag). We also found a scatter of 0.03-0.07 mag among MIR data, and therefore some stars can show a deviation of up to 0.1 mag. In addition, the inherent uncertainty of MIR photometric data arising from the nonlinearity of the MIR detector and the difficulty in the flux calibration is, in general, up to 10%. The photometric error could be also increased for some stars lying in crowded fields or PAH emission nebulae. On the other hand, it is a well-known fact that IR excess emission arises from a circumstellar disk or surrounding material of young stars. Thus, the scatter in the MIR bands may be partly due to uncertainties in the MIR photometry and partly due to circumstellar dust emission of the stars. Allowing for the excess emission, the ratios of total-to-selective extinction (), which we obtained here, are consistent for all wavelengths, and therefore the reddening law toward IC 1848 is normal. It implies that the size distribution of dust in IC 1848 is very similar to that of the general diffuse interstellar medium. Chauhan et al. (2011) found a normal reddening law toward the cluster around HD 18326 in the W5 East H II region, while the of bright-rimmed clouds shows various values from 2.8 to 3.5. The authors argued that the dust grains in the regions have inhomogeneously evolved. Given their results, the strength of UV radiation from O type stars in the clusters affects the evolution of dust grains in the natal cloud.
3.4 Distance to IC 1848
ZAMS fitting is the most important method to estimate the distance to open clusters. In order to obtain a reliable distance from all CMDs, reddening should be corrected for properly. As mentioned above, the total extinction in the band for individual early-type members was determined from . The mean value was (s.d.) mag. After correcting for the reddening and extinction, ZAMS fitting to the de-reddened CMDs was performed. Since multiplicity and evolution effects make stars brighter, ZAMS fitting to the lower ridge of the MS band is recommended, allowing for the photometric error. Several relatively faint early-type members (mid – late B type) appears to be bluer than the ZAMS color indices. Sung et al. (2002) have reported the correlation between UV excess and X-ray luminosity of MS stars in the intermediate-age open cluster NGC 2516 (age 160 Myr). According to them, the higher the X-ray luminosity, the bluer the and color indices. Due to the absence of X-ray observations for IC 1848, we could not obtain the X-ray luminosity of the blue early-type members. In the case of the young open cluster NGC 1893, the late B type MS stars with bluer color indices were found to be X-ray emitters (Lim et al. 2013, in preparation). If this property is universal, high X-ray luminosity is responsible for the bluer color indices. If the ZAMS relations were fitted to such blue MS stars, the distance would be overestimated. Thus, the most probable normal MS members (), as done in the previous section, were used in the ZAMS fitting procedure. From the ZAMS fitting to all reddening-corrected CMDs, the distance modulus of IC 1848 was estimated to be mag, which is equivalent to 2.2 kpc. In Figure 7, we also obtained the same result from four reddening-independent indices, as shown in Paper 0 (Equation 9 – 12). The uncertainty in the distance modulus may be 0.2 mag from Figure 7.
The distance derivations of previous investigators ranged from 1.7 kpc to 2.4 kpc. Sharpless (1955) obtained a distance of 1.7 kpc from their spectral types and photometric data for O stars. However, the author did not discuss the treatment of extinction correction nor considered binarity. The distance to the cluster from other photometric studies (Johnson et al., 1961; Becker & Fenkart, 1971; Moffat, 1972; Garmany & Stencel, 1992; Loktin et al., 2001; Chauhan et al., 2011) clusters around kpc, assuming the normal reddening law. There are two independent measurements. Georgelin & Georgelin (1976) constructed new Galactic rotation curves derived from the distances of exciting stars and H radial velocities for the northern and southern hemispheres, respectively. The authors obtained a distance of 2.3 kpc for IC 1848 from a of . This value is consistent with that of the photometric studies. However, the adopted galactocentric distance (10 kpc) of the Sun is rather larger than the currently accepted value.
On the other hand, Xu et al. (2006) measured a trigonometric parallax for 12-GHz methanol masers in the W3OH region and obtained a distance of kpc. Given the little annual variation of methanol masers, the result seems to be reliable. Although there is an implicit assumption that the distances to W3/W4/W5 are the same, no careful discussion of the assumption has been made. Sato et al. (2008) and Sakai et al. (2013) have measured the trigonometric parallax for the young open cluster NGC 281 and two H2O maser sources, IRAS 00259+5625 and IRAS 00420+5530, using VLBI Exploration of Radio Astrometry. According to their studies, the three H2O maser sources ( kpc, kpc, and kpc) are along the line of sight, sequentially (see Figure 5 in Sakai et al. 2013). From these measurements they could estimate the size of the expanding ring of molecular clouds, which was found by Megeath et al. (2002, 2003), where the diameter along the line of sight is larger than 650 pc. Given these studies, the difference between the distances estimated from the photometric methods and the trigonometric parallax for the W3OH region ( 250 pc) can be interpreted as the extent along the line of sight, and therefore the W3OH region is likely in front of the W3/W4/W5 complex. Since our result supports the estimates from previous photometric studies for IC 1848, we use the distance modulus (11.7 mag) obtained here. In Figure 3 we present the CMDs with a ZAMS obtained by adopting the mean reddening and distance.
3.5 The Hertzsprung-Russell Diagram and Age of IC 1848
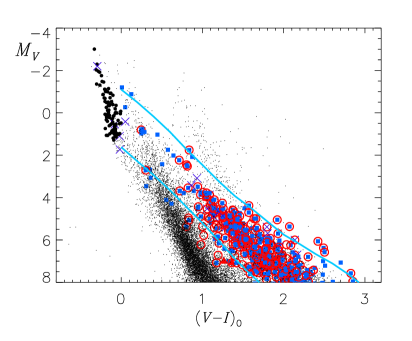
We directly corrected for the reddening of individual early-type members, while the reddening map (Figure 4) was used for the reddening correction of the other members. The dereddened CMD is presented in Figure 8. In order to constrain the upper limit of the IMF (see next section), the locus of PMS stars was defined as shown in the figure (solid lines).
We describe the calibrations required for the construction of the Hertzsprung-Russell diagram (HRD). For stars earlier than O9, the spectral type – effective temperature relation from Table 5 in Paper 0 was used to estimate the effective temperature. We applied the relation between and effective temperature of Bessell et al. (1998) to the PMS members with and another relation (Bessell, 1995) to the remaining PMS members to avoid the effects of the UV excess, arising from accretion activities, on the and/or colors. For the other stars we averaged the temperature derived from the spectral type – effective temperature relation and the color – effective temperature relations with an appropriate weight. Finally the bolometric corrections were obtained from the relations in Paper 0. We present the HRD of IC 1848 in Figure 9.
Several evolutionary tracks (dashed lines) with an initial mass and isochrones (solid lines) were over plotted in the figure. The stellar evolution models of Ekström et al. (2012), which take into account the effect of stellar rotation on the evolution of stars for a given mass, were used for post-MS and MS stars, while we used the models of Siess et al. (2000) for PMS stars. The isochrones (0.5, 2.0, and 5.0 Myr) have been constructed from the two models. The stars with masses larger than seem to be moving away from the MS stage, while intermediate-mass stars seem to be approaching the ZAMS. The isochrone with an age of 5 Myr well predicts the position of the most massive stars in the HRD. However, according to Hillwig et al. (2006), HD 17505, HD 17520, and BD+60 586 are binaries or multiple systems, and therefore it is probable that the turn-off age may be overestimated. We have conducted a deconvolution of the brightness of HD 17505 by assuming that the multiple system consists of an O6.5 III, two O7.5V stars, and an O8.5 V (Hillwig et al., 2006). As a result, the HD 17505 system (the O6.5III component deconvolved from the others) should be dimmed by mag from its current position, and is then well consistent with the 5 Myr isochrone. Although we adopted a luminosity class III for the brightest component of HD 17505, it is worth noting that the genuine luminosity may be very close to Ib or Iab supergiant because the deconvolved absolute magnitude is -6.29 mag (see Table 4. in Paper 0).
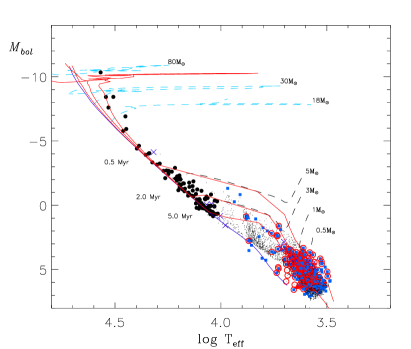
We have also estimated the age of IC 1848 from low-mass PMS stars using the PMS evolution models of Siess et al. (2000). Figure 10 shows the age distribution of PMS stars. The majority of PMS stars cover a span of 6 Myr with a median age of about 3 Myr. Given the age spread of 3 – 6 Myr found in other young open clusters, such as NGC 2244 (Park & Sung, 2002), NGC 2264 (Park et al., 2000), NGC 6530 (Sung et al., 2000), and Trumpler 14 and 16 (Hur et al., 2012), the age spread estimated in this work is reasonable, although the age determined for PMS stars strongly depends on the PMS evolution models used. In Figure 10, the long tail toward older age may arise from overestimating the age of stars in the Kelvin-Helmholtz contraction phase in the PMS models (Sung et al., 1997, 2004), and from stars with an edge-on disk lying below the PMS locus (Sung et al., 2008). It is worth noting that some of stars in the long tail may be real, old PMS stars, since the star formation history of the W5 region could be quite complex. In order to understand the star formation history in W5 West, including IC 1848, the age distribution based on more complete, membership selection is needed.
Karr & Martin (2003) estimated a lower limit of 2.4 Myr for the age of IC 1848, assuming a sound speed for the ionized gas, and an upper limit of 5 Myr, from the lifetime of O stars. Koenig & Allen (2011) inferred that the age of the W5 region is younger than 5 Myr using the evolution model of Siess et al. (2000). Our estimates are in good agreement with those of the previous studies. On the other hand, Moffat (1972) claimed that the age of IC 1848 could not exceed 1 Myr given the existence of the binary or multiple system, HD 17505, HD 17520, and BD+60 586. However, no supporting discussion of the luminosity class or the lifetime of such stars was provided in the study, and we believe that an age of 1 Myr is unlikely.

4 THE INITIAL MASS FUNCTION
As the IMF is a very important tool to understand star formation processes, a number of studies have attempted to derive the IMF in different star forming environments. Bastian et al. (2010) reviewed IMF studies and the relationship with environmental conditions and mass range. Since IC 1848 is one of the large-scale star forming regions in the Perseus spiral arm, this object must be an ideal laboratory to study the IMF in a low metallicity and low spatial density environment. Given the fact that the cluster contains a few massive stars it is possible to derive the IMF over a wide mass range.
For all post-MS or MS members, the masses were estimated by comparing their position in the HRD to post-MS evolutionary tracks. The mass of PMS stars, or stars in the PMS locus without any membership criterion, were estimated by comparing their position in the HRD to PMS evolution model tracks. In order to derive the IMF we counted stars within a given mass bin (). For the most massive bin, the bin size () was 0.64 because of the small number of massive stars. The star counts were then normalized by the logarithmic mass bins and the observed area. The IMF of IC 1848 is shown in Figure 11. To avoid the binning effect we shifted the mass bin by 0.1 and re-derived the IMF (open circles), using the same procedure as above.
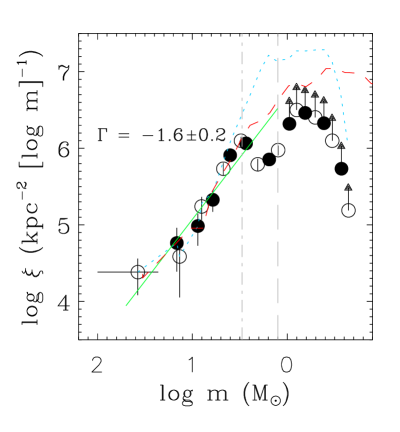
In the figure, the circle and dot represent the IMF of members with H emission or YSOs from Koenig et al. (2008b), while the dotted line corresponds to the IMF including all stars within the PMS locus. The shape of the IMF of members in the low-mass regime is very similar to that of previous studies for other young open clusters, such as NGC 2244 (Park & Sung, 2002), NGC 2264 (Park et al., 2000), NGC 6530 (Sung et al., 2000). With complete membership criteria, Sung & Bessell (2010) showed a smooth increase in the IMF of NGC 2264 down to 0.25 compared to that of Park et al. (2000). Sung et al. (2000) and Sung et al. (2009) have discussed the efficiencies of detecting PMS stars using H photometry (47 % from a single observation) and MIR excess (38 %), respectively. Hence we attribute the dip in the IMF of IC 1848 to the incomplete membership selection for the stars in the Kelvin-Helmholtz contraction phase, while the incompleteness of our photometry may influence the IMF in the lower mass regime (). The IMF of the members () should be a lower limit, whereas that of all stars within the PMS locus may be an upper limit in the same mass range.
We first derived the IMF of IC 1848 complete down to through this study. The slope () of the IMF is about for . It appears to be steeper than the single IMF (Salpeter, 1955) and the Kroupa IMF (Kroupa, 2002), but close to that of Scalo (1986) for massive stars. The slope of the IMF for IC 1848 is also steeper than that of other young open clusters ( for NGC 6530 – Sung et al. 2000, for NGC 2244 – Park & Sung 2002, for Orion Nebula Cluster (ONC) – Muench et al. 2002, for W5 East – Chauhan et al. 2011, for Trumpler 14 and 16 – Hur et al. 2012, for NGC 6231 – Sung et al. 2013a). On the other hand, the slope () and shape of the IMF for NGC 2264 (Sung & Bessell, 2010) are similar to those of IC 1848 in the same mass range. In order to arrive at a firm conclusion on the shape of the IMF down to subsolar mass regime, further deep optical and/or NIR observation with extensive X-ray observations are needed. The complete IMF of the cluster will give an insight into the star formation processes in the large-scale star forming region.
5 ACCRETION RATES OF PMS STARS WITH A UV EXCESS
The mass accretion rate gives important information on the disk evolution around PMS stars. Since the emergence of the magnetospheric accretion model for PMS stars, the physical quantities associated with the accretion process have been studied by observation and modeling UV excess emission or/and spectral lines such as H, Pa, Br, [O I] 6300 Å, etc, within such a paradigm. In this section we estimate the mass accretion rate of those PMS stars with a UV excess found from our photometric data using the relation between the accretion luminosity and -band brightness (Gullbring et al., 1998) and compare the results with that of other studies which used independent ways to estimate accretion luminosities for different star forming regions.
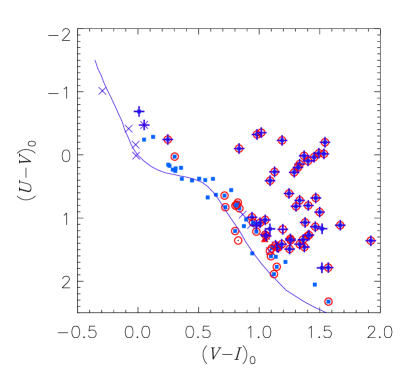
The first step is to find UV excess stars among PMS members which exhibit either H emission or a MIR excess. Several PMS stars exhibit a UV excess in the diagram as shown in Figure 12. The majority of stars with a UV excess are late-type members ( mag). These late-type members appear to be bluer in than normal MS stars without excess emission at a given . The deviation from the expected photospheric color of MS stars is larger than the value expected from differential reddening ( mag). Hence the large UV excess may be related to the intrinsic properties of late-type PMS stars rather than to inappropriate reddening corrections (we have further discussions on the reddening corrections for PMS members in Section 3.2). Similar features can be found in Rebull et al. (2000) for the low-mass members in the ONC. The authors discussed several sources affecting the calculated UV excess, such as chromospheric activity, accretion activity, and the difference between the intrinsic colors of MS and giant stars.
Rebull et al. (2000) have examined the influence of chromospheric activity on the size of the UV excess using field dMe stars and young stars in the Taurus-Auriga star forming region. They suggested that the limit of UV excess from chromospheric activity is about -0.5 mag. This value is adopted as a criterion for the PMS stars with a UV excess in the diagram. A total of 51 members were identified as PMS stars with a UV excess as shown in Figure 12 (plus symbols). We computed the magnitude expected for the photospheric color of MS stars, the extinction-corrected magnitude of stars with UV excess emission, then transformed them to luminosity ( and ) using a bandwidth (700 Å) and zero magnitude flux of Å-1 for the Bessell band (Cox, 2000). The accretion luminosity was estimated from the relation of Gullbring et al. (1998):
| (2) |
where .
In order to obtain mass accretion rates we estimated the mass of individual stars from the evolution models of Siess et al. (2000). The effective temperature and bolometric magnitude of PMS stars obtained above allow us to estimate the radii of the stars. With mass (), radius (), and accretion luminosity () the mass accretion rate of PMS stars is obtained by using the equation below (Hartmann et al., 1998; Gullbring et al., 1998):
| (3) |
where and represent the gravitational constant and mass accretion rate, respectively. We present the mass accretion rate of PMS members with UV excess in Figure 13. The mass range does not fully cover the low-mass stars () as shown in Rebull et al. (2000) and Manara et al. (2012) for the ONC, because IC 1848 is more distant than the ONC. In the same mass range our results are comparable to those studies by Rebull et al. (2000) and Manara et al. (2012) for the ONC. We also plotted results from other studies for different star forming regions (Hartmann et al. 1998; Natta et al. 2006; Mendigutía et al. 2011, and data therein). The authors used independent ways to estimate the accretion luminosity, such as modelled Balmer excess emission and the correlation between accretion luminosity and the strength of hydrogen recombination lines, Pa, and Br. The accretion luminosity and mass accretion rate in this study seem to be compatible with the estimates of other studies for different star forming regions.
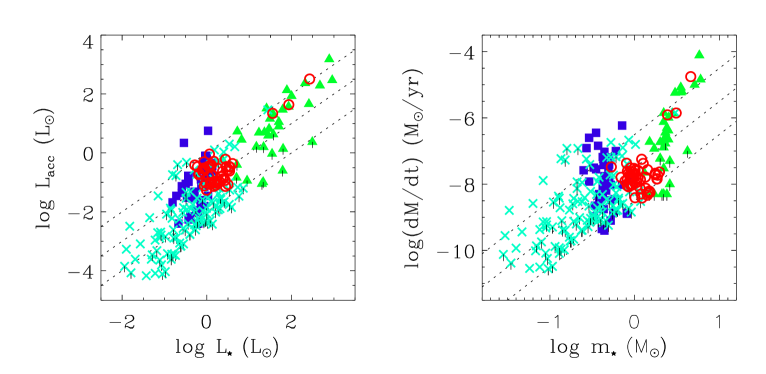
The mean mass accretion rate of stars in the mass range of to is about . Because of the limited mass range of our sample, we cannot confirm whether or not is proportional to (, Muzerolle et al. 2003, 2005; Natta et al. 2006). However, with the previous estimates for masses below our results are well consistent with the previously known correlation between the two quantities. On the other hand, as shown in Mendigutía et al. (2011), three intermediate-mass PMS stars exhibit higher mass accretion rates than expected from the correlation found for low-mass stars. In that study, the authors found that the age of Herbig Ae/Be stars in their sample is systematically younger than that of low-mass stars, and therefore the steep slope in the mass accretion rate with respect to stellar mass was interpreted as the active accretion of young intermediate-mass PMS stars. In this study, we also found that the PMS star (ID 5923) with the highest mass accretion rate is younger than the other intermediate-mass PMS stars (2.5-5 ). However, Garcia Lopez et al. (2006) obtained lower mass accretion rates for the same Herbig Ae stars. The estimates of Donehew & Brittain (2011) (except the upper limits), also reveal 3 times lower values for Herbig Ae/Be stars. The systematic difference in the mass accretion rate for the Herbig Ae/Be stars among authors may have arisen from many uncertain factors such as different uses of evolution models, calibration schemes, reddening correction, distance, disk geometry with mass, etc. However the details are not within our scope of study based on limited data.
Unlike low-mass star forming regions, our target is a young open cluster hosting several high-mass MS stars. Thus, the fundamental parameters, such as reddening and distance, can be constrained very well to estimate the mass accretion rate of PMS stars (). Furthermore, in forthcoming papers as part of the SOS project, homogeneous photometric data for many young open clusters within 3 kpc from the Sun will provide homogeneous estimates of the mass accretion rates and contribute to understanding the evolution of the circumstellar disks of PMS stars and formation of planetary systems.
6 SUMMARY
IC 1848 is one of the most interesting targets in the large-scale star forming environment of the Cas OB6 association. We carried out and H photometry for the young cluster IC 1848 in the W5 West region as part of the SOS project. This study provided not only homogeneous photometric data but also detailed and comprehensive results for IC 1848 as shown below.
Using the photometric properties of early-type stars, a total of 105 stars were selected as members. We identified 397 young stars with MIR excess emission from the Spitzer IRAC data (Koenig et al., 2008b) and using our H photometry and spectroscopy by Koenig & Allen (2011), 257 H emission stars were also identified. A total of 462 PMS stars were selected as PMS members.
From the diagram we obtained the reddening of individual early-type stars yielding a mean reddening of mag. In common with most young star clusters or associations, differential reddening was not negligible in the observed regions. We constructed the reddening map to correct the reddening of PMS members. The photometric data from the optical to MIR for the early-type stars () in the observed regions allowed us to examine the reddening law of IC 1848. We obtained a consistent ratio of total-to-selective extinction of over a wide wavelength coverage from the optical to the MIR, and concluded that the reddening law toward IC 1848 is normal.
In order to determine the distance to the cluster, ZAMS fitting to the lower boundary of the MS band was carried out both in the reddening-corrected and reddening-independent CMDs, and we obtained a distance modulus of mag, which is in good agreement with that of previous photometric studies. The isochrone fitting to the evolved stars gives an age of 5 Myr, while the age distribution of PMS stars shows a median age of 3 Myr with an age spread of 6 Myr.
The IMF complete down to was derived from cluster members for the first time. Due to the incomplete membership selection of low-mass PMS stars, the slope of the IMF () was computed for the limited mass range (). That was similar to the Scalo IMF rather than the Salpeter/Kroupa IMF. We also found that the IMF of IC 1848 closely resembles that of NGC 2264 (Sung & Bessell, 2010) among many young open clusters in the same mass range.
We found 51 PMS stars with a strong UV excess from our photometry. The luminosity was transformed to an accretion luminosity by adopting an empirical relation from the literature. Finally the mass accretion rate of the PMS stars was estimated by using the accretion luminosity, the computed stellar radius, and the stellar mass inferred from the PMS evolution models. The stars in the mass range of 0.5 to 2 exhibit a mean mass accretion rate of . Our result is well consistent with the estimates of other studies for different star forming regions. We also found that high-mass stars show a higher mass accretion rate than the accretion rate expected from the correlation.
acknowledgments
The authors express deep thanks to the anonymous referee for many useful comments and suggestions and Dr. Colette Salyk for useful discussions. This work was supported by a National Research Foundation of Korean (NRF) grant funded by the Korea Government (MEST) (Grant No.20120005318).
References
- Bastian et al. (2010) Bastian, N., Covey, K. R., & Meyer, M. R. 2010, ARAA, 48, 339
- Becker & Fenkart (1971) Becker, W., & Fenkart, R. 1971, A&AS, 4, 241
- Bessell (1990) Bessell, M. S. 1990, PASP, 102, 1181
- Bessell (1995) Bessell, M. S. 1995, in Proc. ESO Workshop, The Bottom of the Main Sequence and Beyond, ed. C. G. Tinney (Berlin: Springer), 123
- Bessell & Brett (1988) Bessell, M. S., & Brett, J. M. 1988, PASP, 100, 1134
- Bessell et al. (1998) Bessell, M. S., Castelli, F., & Plez, N. 1998, A&A, 333, 231
- Bigay (1963) Bigay J. H. 1963, Journal des Observateurs, 46, 319
- Briceño et al. (1998) Briceño, C., Hartmann, L., Stauffer, J., & Martín, E. 1998, AJ, 115, 2074
- Carpenter et al. (2000) Carpenter, J. M., Heyer, M. H., & Snell, R. L. 2000, ApJS, 130, 381
- Chauhan et al. (2011) Chauhan, N., Pandey, A. K., Ogura, K., et al. 2011, MNRAS, 415, 1202
- Conti & Leep (1974) Conti, P. S., & Leep, E. M. 1974, ApJ, 193, 113
- Cousins (1978) Cousins, A. W. J. 1978, MNSSA, 37, 62
- Cox (2000) Cox, A. N. (ed.) 2000, in Allen’s astrophysical quantities (4th ed; New York: Springer), p387
- Donehew & Brittain (2011) Donehew, B., & Brittain, S. 2011, AJ, 141, 46
- Ekström et al. (2012) Ekström, S., Georgy, C., Eggenberger, P., et al. 2012, A&A, 537, 146
- Elmegreen & Lada (1977) Elmegreen, B. G., & Lada, C. J. 1977, ApJ, 214, 725
- Fehrenbach (1966) Fehrenbach, C. 1966, Publ. Obs. Haute-Provence, 8, 25
- Flaccomio et al. (1999) Flaccomio, E., Micela, G., Sciortino, S., et al. 1999, A&A, 345, 521
- Garcia Lopez et al. (2006) Garcia Lopez, R., Natta, A., Testi, L., & Habart, E. 2006, A&A, 459, 837
- Garmany & Stencel (1992) Garmany, C. D., & Stencel, R. E. 1992, A&AS, 94, 211
- Georgelin & Georgelin (1976) Georgelin, Y. M., & Georgelin, Y. P. 1976, A&A, 49, 57
- Greve (2010) Greve, A. 2010, A&A, 518, 62
- Guetter & Vrba (1989) Guetter, H. H., & Vrba, F. J. 1989, AJ, 98, 611
- Gullbring et al. (1998) Gullbring, E., Hartmann, L., Briceño, C., & Calvet, N. 1998, ApJ, 492, 323
- Johnson & Hiltner (1956) Johnson H.L., & Hiltner, W.A, 1956, ApJ, 123, 267
- Johnson et al. (1961) Johnson, H. L., Hoag, A. A., Iriarte, B., Mitchell, R. I., & Hallam, K. L. 1961, Lowell Obs. Bull., 5, 133
- Hartmann et al. (1998) Hartmann, L., Calvet, N., Gullbring, E., & D’Alessio, P. 1998, ApJ, 495, 385
- Haug (1970) Haug U. 1970, A&AS, 1, 35
- Hernández et al. (2004) Hernández, J., Calvet, N., Briceño, C., Hartmann, L., & Berlind, P. 2004, AJ, 127, 1682
- Hillwig et al. (2006) Hillwig, T. C., Gies, D. R., Bagnuolo, Jr., et al. 2006, ApJ, 639, 1069
- Hoag et al. (1961) Hoag A. A., Johnson H. L., Iriarte B., et al. 1961, Publ. U.S. Naval Obs., 17, 347
- Hoag & Applequist (1965) Hoag, A. A., & Applequist, N. L. 1965, ApJS, 12, 215
- Hg et al. (2000) Hg, E., Fabricius C., Makarov V. V., et al. 2000, A&A, 355, L27
- Hur et al. (2012) Hur, H., Sung, H., & Bessell, M. S. 2012, AJ, 143, 41
- Im et al. (2010) Im, M., Ko, J., Cho, Y., et al. 2010, JKAS, 43, 75
- Karr & Martin (2003) Karr, J. L., & Martin, P. G. 2003, ApJ, 595, 900
- Koenig et al. (2008a) Koenig, X. P., Allen, L. E., Kenyon, S. J., Su, K. Y. L., & Balog, Z. 2008, ApJ, 687, L37
- Koenig et al. (2008b) Koenig, X. P., Allen, L. E., Gutermuth, R., et al. 2008, ApJ, 688, 1142
- Koenig & Allen (2011) Koenig, X. P., & Allen, L. E. 2011, ApJ, 726, 18
- Kook et al. (2010) Kook, S.-H., Sung, H., & Bessell, M. S. 2010, JKAS, 43, 141
- Kroupa (2002) Kroupa, P. 2002, Science, 295, 82
- Lada et al. (1978) Lada, C. J., Elmegreen B. G., Cong, H.-I., & Thaddeus, P. 1978, ApJ, 226, 39
- Lasker et al. (2008) Lasker, B. M., Lattanzi, M. G., McLean, B. J., et al. 2008, AJ, 136, 735
- Lefloch et al. (1997) Lefloch, B., Lazareff, B., & Castets, A. 1997, A&A, 324, 249
- Lim et al. (2008) Lim, B., Sung, H., Karimov, R., & Ibrahimov, M. 2008, PKAS, 23, 1
- Lim et al. (2009) Lim, B., Sung, H., Bessell, M. S., Karimov, R., & Ibrahimov, M. 2009, JKAS, 42, 161
- Lim et al. (2011) Lim, B., Sung, H., Karimov, R., & Ibrahimov, M. 2011, JKAS, 44, 39
- Lim et al. (2013) Lim, B., Sung, H., Chun, M.-Y., et al. 2013, AJ, 145, 46
- Loktin et al. (2001) Loktin, A. V., Gerasimenko, T. P., & Malysheva, L. K. 2001, Astron. Astrophys. Trans., 20, 607
- Loren & Wootten (1978) Loren, R. B., & Wootten, H. A. 1978, ApJ, 225, 81
- Luhman et al. (1998) Luhman, K. L., Briceño, C., Rieke, G. H., & Hartmann, L. 1998, ApJ, 493, 909
- Luhman et al. (1997) Luhman, K. L., Liebert, J., & Rieke, G. H. 1997, ApJ, 489, 165
- Manara et al. (2012) Manara, C. F., Robberto, M., Rio, N. D., et al. 2012, ApJ, 755, 154
- Massey et al. (1995) Massey, P., Johnson, K. E., & DeGioia-Eastwood, K. 1995, ApJ, 454, 151
- Megeath et al. (2002) Megeath, S. T., Biller, B., Dame, T. M., et al. 2002, in ASP Conf. Ser. 267, Hot Star Workshop III: The Earliest Stages of Massive Star Birth, ed. P. A. Crowther (San Francisco: ASP), 257
- Megeath et al. (2003) Megeath, S. T., Biller, B., Dame, T. M., et al. 2003, Rev. Mex. Astron. Astrofis., Ser. Conf., 15, 151
- Mendigutía et al. (2011) Mendigutía, I., Calvet, N., Motesinos, B., et al. 2011, A&A, 535, 99
- Menzies et al. (1991) Menzies, J. W., Marang, F., Laing, J. D., Coulson, I. M., & Engelbrecht, C. A. 1991, MNRAS, 248, 642
- Moffat (1972) Moffat, A. F. J. 1972, A&AS, 7, 355
- Morgan et al. (1955) Morgan, W. W., Code, A. D., & Whitford A. E. 1955, ApJS, 2, 41
- Muench et al. (2002) Muench, A. A., Lada, E. A., Lada, C. J., & Alves, J. 2002, ApJ, 573, 366
- Muzerolle et al. (2003) Muzerolle, J., Hillenbrand, L., & Calvet, N. 2003, ApJ, 592, 266
- Muzerolle et al. (2005) Muzerolle, J., Luhman, K. L., Briceño, C., Hartmann, L., & Calvet, N. 2005, ApJ, 625, 906
- Natta et al. (2006) Natta, A., Testi, L., & Randich, S. 2006, A&A, 452, 245
- Niwa et al. (2009) Niwa, T., Tachihara, K., Itoh, Y., et al. 2009, A&A, 500, 1119
- Normandeau et al. (1997) Normandeau, M., Taylor, A. R., & Dewdney, P. E. 1997, ApJS, 108, 279
- Park & Sung (2002) Park, B.-G., & Sung, H. 2002, AJ, 123, 892
- Park et al. (2000) Park, B.-G., Sung, H., Bessell, M. S., & Kang, Y. H. 2000, AJ, 120, 894
- Rebull et al. (2000) Rebull, L. M., Hillenbrand, L. A., Strom, S. E., et al. 2000, AJ, 119, 3026
- Reed (2003) Reed, B. C. 2003, AJ, 125, 2531
- Rieke & Lebofsky (1985) Rieke, G. H., & Lebofsky, M. J. 1985, ApJ, 288, 618
- Sakai et al. (2013) Sakai, N., Sato, M., Motogi, K., et al. 2013, arXiv:1308.3004
- Salpeter (1955) Salpeter, E. E. 1955, ApJ, 121, 161
- Sana et al. (2006) Sana, H., Rauw, G., Nazé, Y., Gosset, E., & Vreux, J.-M. 2006, MNRAS, 372, 661
- Sato et al. (2008) Sato, M., Hirota, T., Honma, M., et al. 2008, PASJ, 60, 975
- Scalo (1986) Scalo, J. M. 1986, Fundam. Cosm. Phys., 11, 1
- Sharma et al. (2007) Sharma, S., Pandey, A. K., Ojha, D. K., et al. 2007, MNRAS, 380, 114
- Sharpless (1955) Sharpless, S. 1955, AJ, 1955, 60, 178
- Siess et al. (2000) Siess, L., Dufour, E., & Forestini, M. 2000, A&A, 358, 593
- Skrutskie et al. (2006) Skrutskie, M. F., Cutri, R. M., Stiening, R., et al. 2006, AJ, 131, 1163
- Sung & Bessell (1999) Sung, H., & Bessell, M. S. 1999, MNRAS, 306, 361
- Sung & Bessell (2004) Sung, H., & Bessell, M. S. 2004, AJ, 127, 1014
- Sung & Bessell (2010) Sung, H., & Bessell, M. S. 2010, AJ, 140, 2070
- Sung et al. (2002) Sung, H., Bessell, M. S., Lee, B.-W., & Lee, S.-G. 2002, AJ, 123, 290
- Sung et al. (2004) Sung, H., Bessell, M. S., & Chun, M.-Y. 2004, AJ, 128, 1684
- Sung et al. (2008) Sung, H., Bessell, M. S., Chun, M.-Y., Karimov, R., & Ibrahimov, M. 2008, AJ, 135, 441
- Sung et al. (1997) Sung, H., Bessell, M. S., & Lee, S.-W. 1997, AJ, 114, 2644
- Sung et al. (1998) Sung, H., Bessell, M. S., & Lee, S.-W. 1998, AJ, 115, 734
- Sung et al. (2000) Sung, H., Chun, M.-Y., & Bessell, M. S. 2000, AJ, 120, 333
- Sung et al. (2013b) Sung, H., Lim, B., Bessell, M. S., et al. 2013, JKAS, 46, 103 (Paper 0)
- Sung et al. (2013a) Sung, H., Sana, H., & Bessell, M. S. 2013, AJ, 145, 37
- Sung et al. (2009) Sung, H., Stauffer, J. R., & Bessell, M. S. 2009, AJ, 138, 1116
- Thronson et al. (1980) Thronson, H. A., Thompson, R. I., Harvey, P. M., Rickard, L. J., & Tokunaga, A. T. 1980, ApJ, 242, 609
- Thompson et al. (2004) Thompson, M. A., White, G. J., Morgan. L. K., et al. 2004, A&A, 414, 1017
- Vallée et al. (1979) Vallée J. P., Hughes, V. A., & Viner, M. R. 1979, A&A, 80, 186
- Westerhout (1958) Westerhout, G. 1958, Bull. Astron. Inst. Netherlands, 14, 215
- White et al. (1999) White, R. J., Ghez, A. M., Reid, I. N., & Schultz, G. 1999, ApJ, 520, 811
- Wilking et al. (1984) Wilking, B. A., Harvey, P. M., Lada, C. J., Joy, M., & Doering, C. R. 1984, ApJ, 279, 291
- Xu et al. (2006) Xu, Y., Reid, M. J., Zheng, X. W., & Menten, K. M. 2006, Science, 311, 54