Interest communities and flow roles in directed networks: the Twitter network of the UK riots
Abstract
Directionality is a crucial ingredient in many complex networks in which information, energy or influence are transmitted. In such directed networks, analysing flows (and not only the strength of connections) is crucial to reveal important features of the network that might go undetected if the orientation of connections is ignored. We showcase here a flow-based approach for community detection in networks through the study of the network of the most influential Twitter users during the 2011 riots in England. Firstly, we use directed Markov Stability to extract descriptions of the network at different levels of coarseness in terms of interest communities, i.e., groups of nodes within which flows of information are contained and reinforced. Such interest communities reveal user groupings according to location, profession, employer, and topic. The study of flows also allows us to generate an interest distance, which affords a personalised view of the attention in the network as viewed from the vantage point of any given user. Secondly, we analyse the profiles of incoming and outgoing long-range flows with a combined approach of role-based similarity and the novel relaxed minimum spanning tree algorithm to reveal that the users in the network can be classified into five roles. These flow roles go beyond the standard leader/follower dichotomy and differ from classifications based on regular/structural equivalence. We then show that the interest communities fall into distinct informational organigrams characterised by a different mix of user roles reflecting the quality of dialogue within them. Our generic framework can be used to provide insight into how flows are generated, distributed, preserved and consumed in directed networks.
I Introduction
The increasing availability of large-scale relational datasets in a variety of fields has led to the widespread analysis of complex networks. In particular, the current interest in quantitative social sciences has been fuelled by the importance of social networks and by the wealth of socio-economic datasets widely available today Brossard2013 ; Davidian2012 ; Garcia-Herranz2012 ; Giles2012 ; Goel2010 ; Huberman2012 ; King2013 ; Zhou2010 ; Porter2009 . Due to the sheer complexity of these networks, it has become crucial to develop tools for network analysis that can increase our insight into such data. A key direction in this area is that of community detection, which aims at extracting a simplified, yet meaningful, coarse-grained representation of a complex network in terms of ‘communities’ of nodes at different levels of resolution Fortunato2010 .
A common characteristic of many social, engineering and biological networks is the importance of directionality. Clearly, it is not the same to ‘follow’ a widely known personality in Twitter than to be followed by one. Directionality is also key in food-webs Stouffer2012 , brain networks Bock2011 , economics datasets Schweitzer2009 , protein interaction networks Schweitzer2009 , and trade networks Kaluza2010 , to name but a few. Failure to consider directionality when present in the data, as is commonly done in numerous network analyses, entails ignoring the true nature of the asymmetric relationships and information propagation. From a methodological perspective, however, the analysis of directed networks presents unique challenges that put them beyond standard methodologies. In particular, it is difficult to extend the structural notion of community (i.e., a group of nodes with strong connectivity within and with weaker connectivity to the outside) to the case of directed networks.
Here we show how the analysis of flow patterns on a network can be integrated to provide a framework for community Delvenne2010 ; Lambiotte2008 and role Cooper2010 detection. This framework is naturally applicable to directed networks where flow is an intrinsic feature of the system they represent. Our analysis is able to reveal a layered view of the data from four complementary perspectives: interest communities of nodes at different levels of resolution; a personalised view of interest in the network from any vantage point; the identification of user roles in the network based on directed flows; and a classification of the interest communities into distinctive information organigrams. Our framework is applicable to generic directed networks, but we showcase our approach through the analysis of the Twitter network of influential Twitter users during the 2011 riots in England, compiled from the list published by the British newspaper The Guardian.
I.1 The directed network of influential Twitter users during the UK riots
The riots of August 6-10 2011 in England were followed by an intense public debate about the role and influence of social media during the unrest. Politicians, journalists, pundits and bloggers alike weighed in on the issue but few arguments were based on data Tonkin2012 . A few months after the riots, The Guardian made available to the public a list of the 1000 ‘most influential’ (i.e., most re-tweeted) Twitter users during the riots Evans2011 . The Guardian’s list comprised a diverse set of Twitter users including newspapers, broadcasting services, news agencies, as well as individual accounts of journalists, politicians, entertainers, global and local activists, and members of the public.
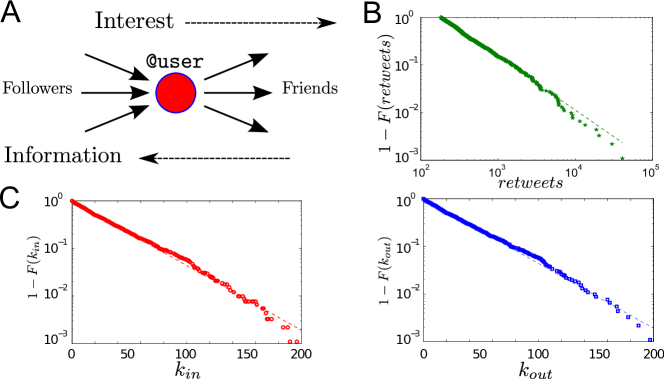
To enable a quantitative analysis of The Guardian’s list, we mined Twitter in February 2012 and recovered the directed network of followers within the list (see SI). Henceforth we study the largest connected component of this network consisting of nodes (Twitter users). The remaining 86 users were either disconnected (i.e., they did not follow nor were followed by anyone on the list) or their accounts had been since deleted. In our network, an edge indicates that the source node is subscribed to the tweets of the target node, i.e., the direction of the edge indicates the declared interest whereas information and content travel in the opposite direction (Fig. S1 in the SI).
II Results
II.1 Flow-based ‘interest communities’: a view of the network at different resolutions
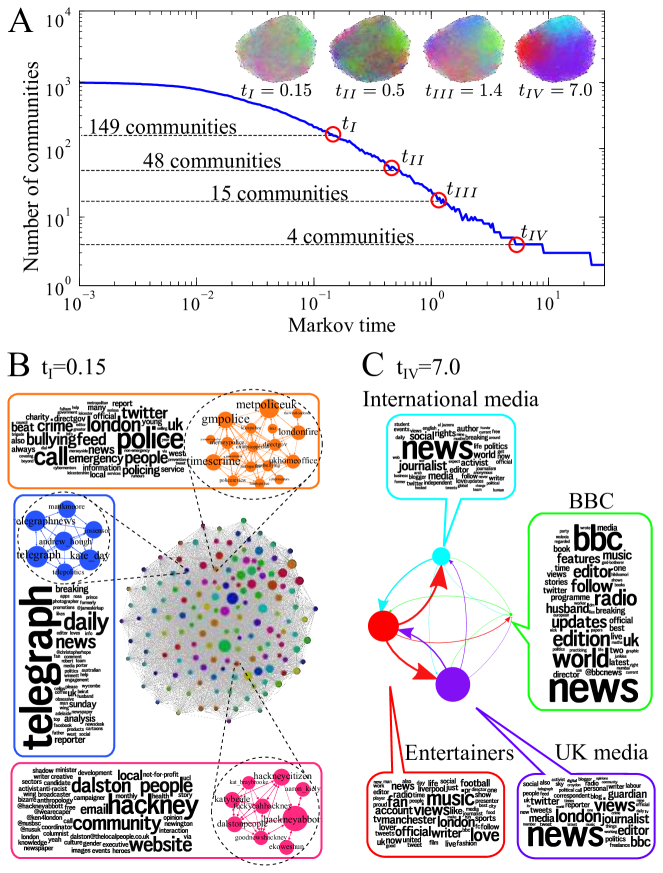
To gain a structured view of the communities in the network at different levels of resolution, we use Markov Stability community detection Delvenne2010 ; Schaub2012 which has been extended to deal with directed networks (see Methods, SI and Ref. Lambiotte2008 ). A key advantage of Markov Stability is that it is based on a quantitative criterion that relies on flow propagation and containment, and thus identifies flow communities. The communities so found correspond to ‘interest communities’, insomuch as information, interest and influence are propagated, retained and reinforced within them following the edges. If edge directionality is ignored, the community structure is blurred and the analysis severely hindered, as shown below. A second advantage of our method is that the network is scanned for structure at all scales, and flow communities are found to be relevant at different levels of resolution. Figure 1A illustrates how, as the network is swept by a continuous-time diffusion process, the method goes from detecting many small, granular communities (at short Markov times) to fewer and coarser communities (at longer Markov times). As a visual aid to interpret the theme of the communities, we create ‘word clouds’ from the most frequently-used words in the Twitter self-biographies of the users in each community. It is important to remark that the biographies are not used in the network analysis, i.e., the word clouds serve as an independent, a posteriori annotation or ‘self-description’ of the communities found (see SI).
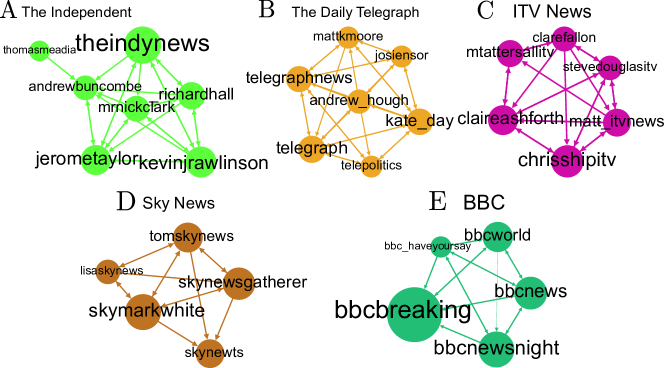
An example of a highly granular partition (149 communities) at short Markov times is shown in Fig. 1B (and Figs. S3 and S4 in the SI). At this resolution, some communities are defined by the geographic origin of the Twitter accounts (e.g., Midlands, Manchester, Liverpool, even Croydon and Hackney within London); others are determined by employer or institution (e.g., media such as The Independent, ITV, Channel 4, or The Daily Telegraph); while others correspond to interest groups (e.g., a community grouping together police forces and fire departments of riot areas with crime reporters and civil organisations highlights the police’s use of Twitter during the riots Denef2013 ).
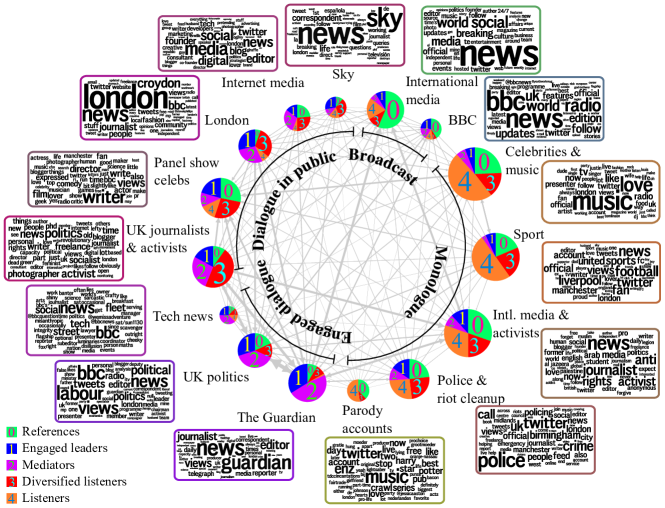
As the Markov time increases, we find coarser partitions with larger communities. At we find 48 communities, including a football/sports community (clubs, athletes, sports journalists and supporters), a politics/Labour community, and a relatively small BBC community (Fig. S5 in the SI). At a longer Markov time (), we find a partition into 15 communities including the BBC community, a Sky community, a community of Guardian journalists, a community of international and alternative media/journalists/activists (including Wikileaks, Al Jazeera, and Anonymous-related accounts), among other topical communities (see Fig. 6).
At even longer Markov times, we show in Fig. 1C a coarse partition with four communities corresponding broadly to UK media/activism, international media/activism, entertainment/sports, and the BBC, which remains as a distinct community across a large span of Markov times. We provide a Supplemental Spreadsheet with all partitions of the network at all Markov times so that interested parties can explore the all-scale structure of interest communities in the network. Furthermore, we have carried a similar analysis using the well-known information-theoretic Infomap community detection algorithm Rosvall2008 ; Rosvall2011 , which in this case leads to an overpartitioned description with non-optimal compression (i.e., a large compression gap) and unbalanced partitions (see SI for a discussion) Schaub2012 ; Schaub2012a .
II.2 The importance of directionality in detecting interest communities
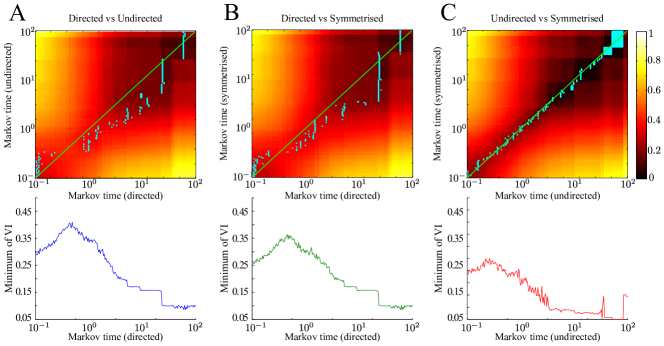
In systems that are represented as directed networks, such as Twitter, the directionality of the edges is central to their function. The full consideration of edge directionality, which is naturally incorporated in our analysis, is crucial for the community structure detected. To illustrate this phenomenon, we compare the communities found in the original, directed Twitter network with those obtained when edge orientation is ignored. We have analysed both versions of the network (directed and undirected) using the extended Markov Stability method which can deal with both types of networks. See the SI (Fig. S6) for a discussion of the differences in community structure between the directed and undirected versions of this Twitter network. Importantly, relevant communities can go undetected if one uses standard approaches for community detection based on undirected structural notions (typically density of connections Schaub2012a ).
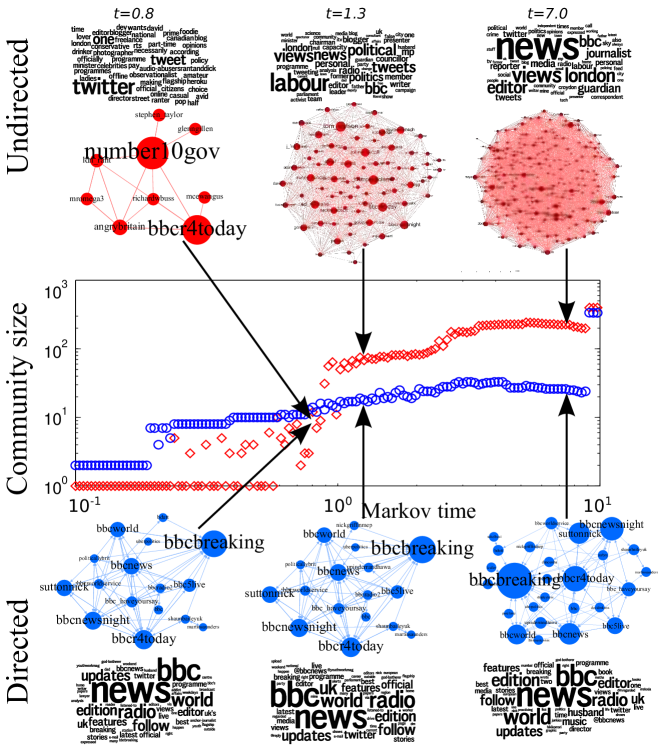
As stated above, the BBC is an example of a flow community that stands out in its persistency. In Fig. 2, we show how the community of BBC’s Today show (a morning news broadcast with a broad audience) remains consistently grouped across many levels of resolution in the analysis of the directed network: from an early Markov time, BBC-related accounts are grouped together and remain so all the way up to the top levels of resolution, with consistent word clouds throughout. This phenomenon depends strongly on the directionality of the flows: the nodes in the BBC community are among the most important in the network (high in-degree and PageRank), attracting flow (attention) from elsewhere in the network and retaining it for long periods of Markov time. In a symmetrised network, such communities can go undetected, as shown in Fig. 2, where the corresponding undirected community of the BBC’s Today show is quickly blurred across Markov times and gets mixed with a variety of users with little in common, consisting mainly of politicians from the Labour Party and journalists.
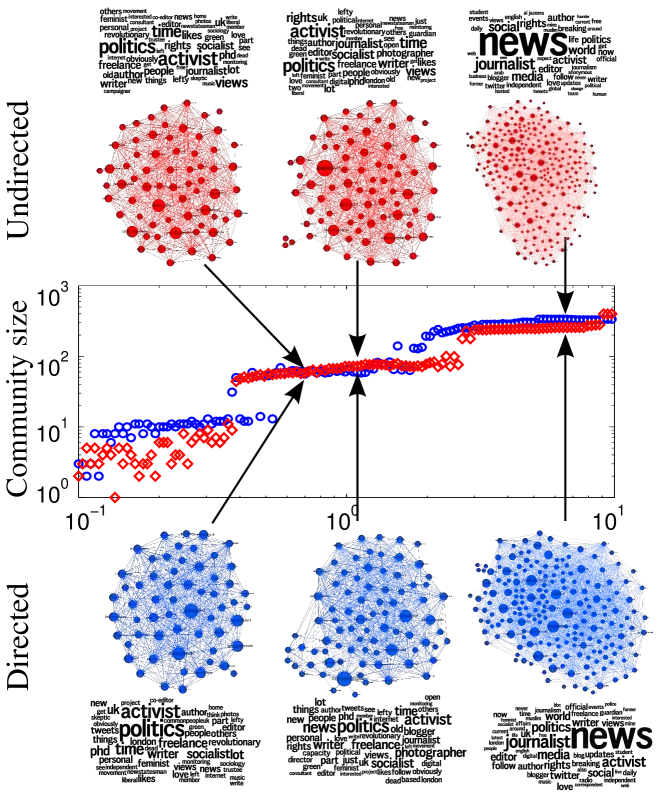
Interestingly, this drastic difference between directed and undirected communities is not observed for all communities in the network. There are communities, such as the one including Guardian columnist George Monbiot, which behave in an essentially similar fashion in both cases across levels of resolution (see Fig. 3). This difference between communities that are sensitive or insensitive to directionality persists across time scales, signalling the fact that some groupings (such as the BBC community) are fundamentally based on retention of directed flows, while others (such as the Monbiot community) follow from a balanced flow and, thus, can be captured by standard undirected measures. We note that the directed Markov Stabilty method is able to detect both types of communities simultaneously.
II.3 Interest distance between nodes: the view of the network from a vantage point
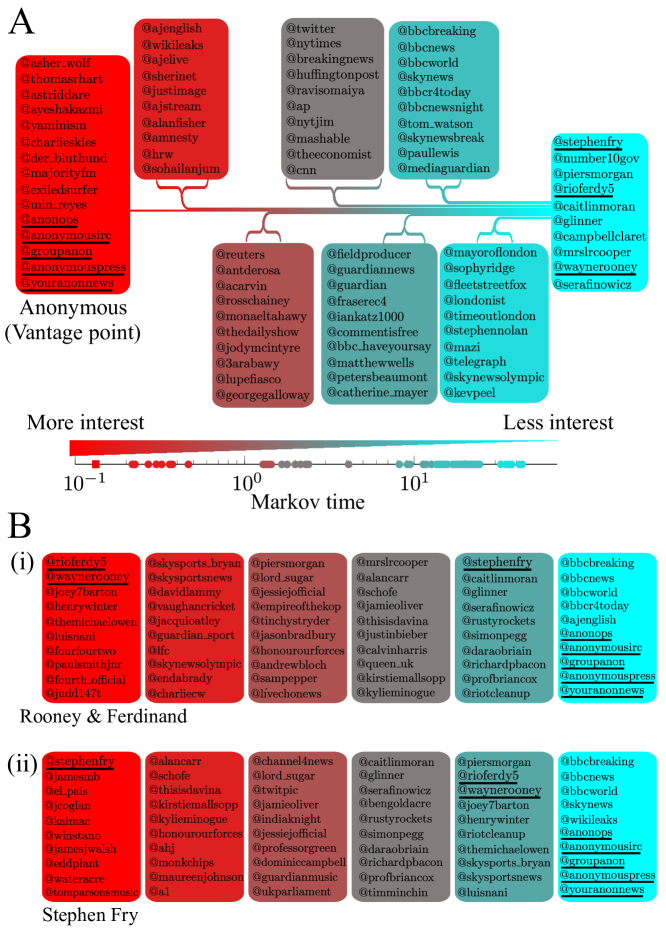
As the Markov diffusion explores the network, it can provides us with information of how interesting the members of the network are to a given node or groups of nodes (denoted the ‘vantage point’). Using our flow-based communities, we establish the interest distance from the vantage point to any node in the network as the earliest Markov time at which the node belongs to the same community as the vantage point (i.e., we compute how ‘near’ they are in an ultrametric space Carlsson2013 ). In Fig. 4A, we show the computed interest distance from the vantage point of the Anonymous community (from onwards). Consistent with other studies Coleman2011 ; Milan2012 , the closest nodes to Anonymous include Wikileaks, Human Rights Watch, Al Jazeera and Amnesty International, followed by a mix of activists and writers, mainstream international media, and the UK media. Of least interest to Anonymous are celebrities, UK politicians and footballers.
Unsurprisingly, the picture is starkly different from the vantage point of the nodes that are of least interest to Anonymous. Figure 4B shows the interest distance from the vantage point of footballer Wayne Rooney (of little interest to Anonymous) whose neighbourhood of interest is dominated by football, sports and TV celebrities, with news and activists as distant interests. The computed interest distance is able to capture the nuanced information provided by all the directed paths in the network. This is shown by the fact that Stephen Fry (English actor, TV personality and writer) is distant from both Wayne Rooney and Anonymous (Fig. 4B), while Rio Ferdinand (Rooney’s ex-teammate at Manchester United) is always close to Rooney. These examples highlight the sensitivity of our Markov exploration and how the use of vantage points can be used to provide personalised information about the system.
II.4 Finding flow-based roles of nodes in directed networks
A flow-based analysis of directed networks also provides a different angle for the classification of nodes according to their role in generating and disseminating information. Conceptually, it is clear that an account with millions of followers, such as BBC News, acts as a source of information (i.e., a reference) while a personal account with only a handful of followers yet with subscriptions to media outlets acts mostly as a sink of information (i.e., a listener). To go beyond this source/sink dichotomy, or the traditional leader/follower and hub/authority Kleinberg1999 categories, we use here the full structure of flows in the network to develop a quantitative methodology that reveals ‘flow roles’ in the network without imposing the number of roles a priori. Our algorithm starts by building the role-based similarity (RBS) matrix (see Methods below) Cooper2010 ; Cooper2010a . A feature vector for each node is constructed from the scaled pattern of incoming and outgoing paths of all lengths and the pairwise cosine similarities () between all such vectors (see Methods) are stored in the similarity matrix . Nodes with similar profiles of incoming and outgoing flows of all lengths are classified as having similar flow roles in the network (i.e., when is close to 1). The extreme cases correspond to the standard ’sources’ and ’sinks’, but an assortment of nuanced roles spanning these two extremes emerges in our results. This analysis provides a complementary use of flows to infer different properties of nodes: instead of grouping nodes according to flow persistence (as in the detection of interest communities described above), RBS provides a grouping of nodes according to their function in information propagation.
We have extended the RBS method by using the Relaxed Minimum Spanning Tree (RMST) algorithm to extract a role similarity graph from the matrix (Fig. 5A). This novel algorithm creates a new graph by emphasising strong similarities between nodes and downplaying weaker, redundant similarities based on local continuity and global geometric properties of the data similarity (see Methods). Note that in this RMST-RBS role similarity graph (which is generated from the Twitter graph but is distinct from it), nodes with similar connectivity patterns lie close to each other regardless of how close they are (in a geodesic way) in the original network. We then apply graph-theoretical community detection algorithms (such as Markov Stability) to the RMST-RBS graph and, in doing so, we reveal groups of nodes (the communities in the role similarity graph) with similar in- and out-flow patterns corresponding to flow-based roles. The number of communities on the role similarity graph correspond to the number of roles in the network. Note that this procedure does not impose an a priori number of roles to be detected (see SI).
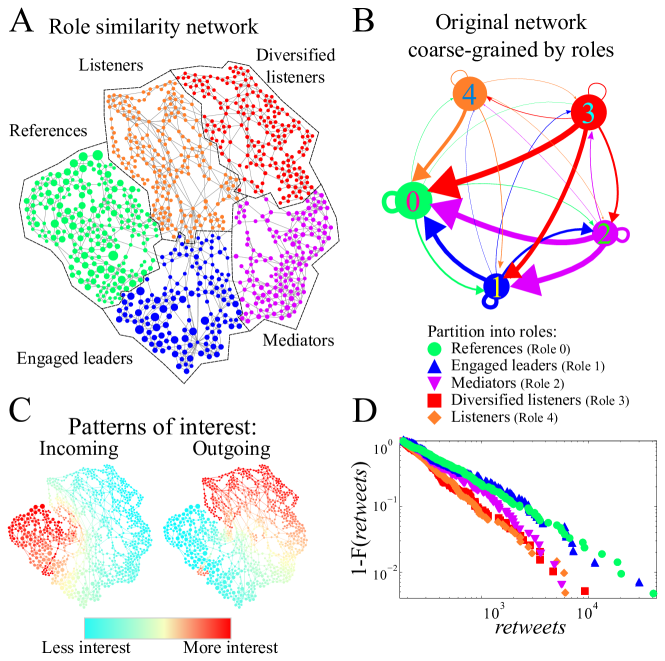
Our RMST-RBS analysis finds that there are five flow-based roles for the nodes in this Twitter network. Examination of their incoming and outgoing flow patterns reveals that some of the groups identified correspond to traditional roles such as listeners (‘followers’) or references (‘leaders’), but also distinguishes between different types of leaders, followers and intermediate roles (Fig. 5A-B). The description of the five flow role categories we obtained is as follows:
-
References: Typically, institutional accounts, important sources of content, or well-known personalities with many followers who follow few accounts, e.g., BBC Breaking News, Al Jazeera, Stephen Fry, or the New York Times.
-
Engaged leaders: Accounts with large number of followers who, unlike references, also follow other users. This category includes institutional and personal accounts often meant to interact with the public, e.g., Sky News, the British Prime Minister’s office, Tom Watson (a British MP), or Paul Lewis (Guardian editor).
-
Mediators: Users who interact with the two leader categories (i.e., they follow and are followed by high profile accounts), as well as with nodes in the listener categories below. Many such accounts belong to journalists and reporters. Examples of mediators include Ross Chainey (Reuters employee), BBC-have-your-say and the London Fire Brigade.
-
Diversified listeners: Accounts with few followers that follow many nodes from all categories, suggesting diversity in their interests and sources of information.
-
Listeners: Accounts with few followers (within this network, not necessarily over the whole of Twitter) who follow mostly Reference nodes. Within this particular network, they can be considered as passive recipients of mainstream content.
In the Supplemental Spreadsheet we give the roles of all nodes in the network. We remark that this classification of nodes into roles is pertinent only in the context of the network within The Guardian’s list; it is possible that the role of certain users will be different if considered embedded in the wider Twitter network, since the pattern of paths of different lengths attached to each node is likely to change.
Figure 5C illustrates the mathematical basis for the classification of nodes into roles by our RMST-RBS algorithm: the patterns of incoming and outgoing flow at all path lengths are combined to reveal the different flow roles. Because RMST-RBS takes into account the whole spectrum of short to long paths (from length 1 to in this case, and everything in between) our classification goes beyond similarity scores that only use single features, such as in- and out-degrees of the nodes (which appear as the paths of length 1 in columns 1 and of the matrix in equation (5)) or eigencentrality-type stationary flow metrics (columns and ). Therefore our method obtains information which is not apparent if we just rank the nodes according to in/out degree or centrality and then split them into groups. For example, ranking the nodes according to PageRank is not enough to distinguish the ‘Reference’ and ‘Engaged leader’ categories, or to separate ’Mediator’ from ’Engaged leader’ or ’Diversified listener’ (see Fig. S8 in the SI and Supplemental Spreadsheet). To confirm the relevance of our findings, we examine the cumulative distribution of retweets attained by each node class (Fig. 5D), where we see a clear separation between the leader (reference and engaged leader nodes) and follower (diversified listeners and listeners) categories, with the mediators lying in between both groups. It is important to remark that the retweet data in Fig. 5D is not part of our role detection and is only used a posteriori to inform our understanding of the flow roles obtained (see also Fig. S8 in the SI).
The flow roles we find here are conceptually and practically different from those obtained using well established theories in social network analysis, e.g. Structural Equivalence (SE) Lorrain1971 and Regular Equivalence (RE) Everett1994 ; Everett1996 ; Luczkovich2003 ; Borgatti1993 . SE bases node similarity on overlapping sets of neighbours (i.e., two nodes are similar if many of their neighbours are the same), while RE-based methods rely on node colorations and neighbourhoods (i.e., two nodes have the same role if the colours of their neighbours are the same, regardless of the number of common neighbours). Hence SE and RE are essentially short-path methods and not suitable for networks like the one studied here where the full structure of flow is essential (see SI for a detailed description of RE and SE roles and their lack of information content in this network). Furthermore, RE methods are not robust to small random perturbations in network connectivity due to their combinatorial nature.
II.5 Interest communities and their distinct mix of roles
Heretofore, our two-pronged flow-based analysis has led to groupings of the nodes according to two criteria: interest communities (at different resolutions) and flow roles . Both perspectives present complementary views of the information in the network and can be combined to characterise the internal organisation of interest communities in terms of the mix of roles of their members. Figure 6 presents this integrated view for the 15 interest communities at medium resolution (Markov time ), and the five node roles found through RBS-RMST. Using a simple -means clustering of their role-mixes, we find that the 15 communities fall into four types of informational organigrams (see SI). Two of these organigrams broadly conform to communities formed mostly by leaders (‘references’) and their followers (‘listeners’), though with some important differences: “monologue communities” are predominantly composed of references with a set of loyal (non diversified) listeners with information flowing mostly in one direction (e.g., ‘Celebrities/Entertainers’, ‘Sport’, ’Parody accounts’), while in “broadcast communities” most members are references delivering content broadly to a wide variety of users in the network (e.g ‘BBC’ and ‘International media’). In addition, there exist two organigrams with a more balanced dialogue structure: “dialogue in public”, which involves many diversified listeners (e.g., ‘Panel show celebrities’, ‘London’, or groups heavily based on Internet interaction such as ‘UK journalists & activists’); and “engaged dialogue”, which is dominated by engaged leaders and mediators (e.g., ‘Politics’ and ‘The Guardian’). These two dialogue organigrams reflect the importance of online interaction in information networks, where bottom-up grassroots associations, bloggers and commentators from the public interact directly with accounts linked to news outlets and official political organisations.
III Discussion
In this work, we have used the Twitter network constructed from the list of influential users during the UK riots of 2011 collected by The Guardian to showcase how flow-based methods in directed networks can lead to enhanced insight into the structure of data. Our analysis reveals interest communities into which users fall at different levels of resolution. The interest communities found confirm the relevance of news organisations and media, yet providing a layered view in terms of their focus (UK/international, mainstream/alternative) and of relationships to each other and to the overall network. The enhanced sensitivity of our multi-resolution analysis allows us to uncover small but significant groups related to local organisations or clean-up groups in riot areas which appear close to police and law enforcement groupings. In addition, our analysis reveals groupings that have an unexpected relevance in a network that was selected on the basis of ‘retweeting’ importance during an event of civil unrest. In particular, a significant grouping of celebrities, sport personalities and pop musicians act as the center of a significant interest community. Also intriguing is the role of interest groups based on humour in such situations, as represented by communities of comedians and parody accounts. Our work points at future studies on how to use this type of analyses to improve and tailor communication strategies during times of unrest, in particular with regards to providing a personalised view of the network from any given vantage point (i.e., from any node or group of nodes) based on the interest distance of information flow. These results can be a starting point to examine textual information and analyse the influence of groups of interest on observed behaviors in this and similar datasets.
Using flow transfer in the network, we find that the Twitter users in this network fall into a palette of five flow roles, whereas interest communities exhibit distinct mixes of such roles reflecting diverse communication patterns within them. Some communities contain one-way communication patterns (e.g., celebrities and their followers), whereas other communities harbour more balanced dialogue patterns. In particular, our analysis highlights the differences between media organisations and their distinct patterns of interaction with the influential users in this network. For instance, international mainstream media tend to fall into the Broadcast and Monologue categories, as would be expected in a network of UK-based events. On the other hand, the UK and specialised media exhibit a more diverse pattern of interactions with their followers: some of them are highly engaged with mediators and diversified listeners whereas others largely maintain the more traditional role of publishing content.
This work also highlights the use of multiscale network analyses, which go beyond local information of individual users towards aggregate global metrics, to deliver an enriched view of information dissemination in social networks, thus uncovering relationships and roles of nodes and providing concise coarse-grained descriptions of the network. We hope that our results (all available in the Supplemental Material) could be a helpful resource to aid in the study of online interactions during the UK riots of 2011.
More generally, our work highlights the importance of directionality in network analysis. When the notion of flows (e.g., of people, information, energy, goods) is central to a network, ignoring directionality destroys information, ‘blurring’ the structure, especially at the finer levels of resolution, so that key communities (e.g., the BBC, Sky, and geographical communities in our analysis) will go undetected. The formulation of community and role detection in terms of flow dynamics thus provides an integrated methodology for the analysis of systems (natural or man-made) with directed network representations.
Appendix A Methods
A.1 Community detection with Directed Markov Stability
We give here a summary of the theoretical ideas and computations underpinning our analysis of interest communities using directed Markov Stability. For a full explanation of the method, see Refs. Delvenne2010 ; Lambiotte2008 ; Schaub2012 . The code for the Markov Stability algorithm can be downloaded from StabilityWebsite . For an expository article, see Ref. Delvenne2013 .
A.1.1 Graph theoretical definitions
Let be the adjacency matrix of a directed network ( in the riots Twitter network), where if node has an edge to node and 0 otherwise. Note that in general. In a directed network, each node has an in-degree (, where is the vector of ones) and an out-degree () which are the number of edges directed at the node and departing from the node, respectively.
A.1.2 Random walks on directed graphs
A Markov chain on the graph is usually defined by the transition matrix , where is the diagonal matrix of node out-degrees. For nodes where , the convention is to set . The evolution of a discrete-time Markov chain is given by
| (1) |
and, alternatively, a Markov process in continuous time is governed by the Kolmogorov equation:
| (2) |
Here denotes the dimensional probability vector, is the identity matrix, and is the (combinatorial) Laplacian matrix of the graph. We can view both these processes as defining a random walk taking place on the graph.
To ensure that the random walk is ergodic, we add a ‘teleportation’ component to the dynamics Lambiotte2008 to obtain a new transition matrix
| (3) |
Here is the probability that a random walker arriving at a node will follow an outgoing edge, while the walker will be ‘teleported’ (i.e., it will jump to any other node in the network chosen at random) with probability . In this work, we use throughout. The probability that any node is visited by a teleported random walker is drawn from a uniform distribution (i.e., each node has the same probability of being visited, though other choices are possible Lambiotte2012 ). The vector is an indicator for dangling nodes: if and otherwise. Upon visiting a dangling node, a random walker will be teleported with probability 1.
In this work we consider the continuous time process in equation (2) with transition matrix :
The steady-state is given by the leading left-eigenvector of (associated by the eigenvalue 1), and the time-dependent transition matrix is .
A.1.3 Directed Markov Stability and community detection
We have recently introduced the community detection method known as Markov Stability. The basic idea is that the study of the dynamics of diffusion processes on networks can be used to identify meaningful partitions at different resolutions Delvenne2010 ; Lambiotte2008 . This notion can be illustrated by the example of observing how a droplet of ink would diffuse in a container. If the container has no structure, the ink diffuses isotropically. If the container is compartmentalised, the dye would not spread isotropically but would rather get transiently trapped for longer times in certain parts of the container until it eventually becomes evenly distributed throughout the whole vessel. Hence the time dynamics of this diffusion process provides us with valuable information about the structural organisation of the container. A similar idea can be applied to the diffusion on a graph.
From this dynamical perspective, the Markov time acts as a means to scan the structure of the graph at all scales, thus providing a dynamical zooming over the structure of the graph. In this process of zooming, the diffusion explores increasingly larger sections of the graph and identifies increasingly coarser partitions. Communities are identified as subgroups within which the probability flow is well mixed yet the flow remains contained over particular time scales. The communities are found by finding the partitions that optimise a time-dependent cost function. As the diffusion progresses, this cost function optimisation allows us to rank the goodness of partitions and to identify which partitions are relevant over different time scales. Relevant partitions appear as robust, because they are optimal over extended time-intervals and/or in terms of the basin of attraction of the optimisation process.
A partition of a network into communities can be encoded into the indicator matrix , where if node belongs to community and 0 otherwise. Then the Markov Stability of the partition is defined as the trace of the clustered autocovariance of the diffusion process taking place on the graph Delvenne2010 :
| (4) |
where .
We find the communities in the network at all scales by optimizing the Markov Stability (4) for any given value of (the Markov time) over all partitions . This is an NP-complete combinatorial problem Delvenne2010 and to provide optimised solutions, we use the Louvain greedy optimisation heuristic Blondel2008 , which works well in practice. Note that although the original Louvain method is formulated only for symmetric , we have shown that the optimisation of the Markov Stability in the case of directed networks can be reformulated in terms of the symmetrised matrix , where , which follows from Lambiotte2008 .
The Markov Stability framework explores the community structure of a network at all scales through the dynamic zooming provided by the duration of the diffusion process : if is small, the diffusion process is short and the optimal partitions consist of many small communities; for larger values of the diffusion process explores the network further and, consequently, we find fewer and larger communities (see Fig. 1 and SI) Delvenne2010 ; Lambiotte2008 . The fact that Markov Stability is based on the analysis of flows diffusing in the network allows us to extend seamlessly the analysis of communities to directed networks. In our framework, the defining characteristic of communities is the persistence of flow (contained and well-mixed) within the community over a given timescale. Importantly, because Markov Stability is based on the concept of flow, it can detect non-cliquish communities, i.e., communities that are not characterised by density of links but by retention of flow Schaub2012 . As we show in the Main Text and the SI, this property is vital for the analysis of networks with flows of information, particularly in the directed case.
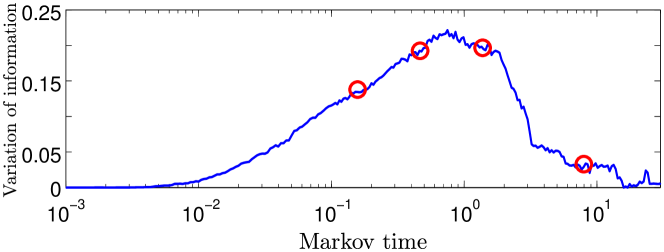
As our method scans dynamically through Markov time, it enables us to find communities defined by their flow patterns at all scales through the optimisation of the stability for a range of spanning several orders of magnitude. Briefly, for each value of we find the partition of the network that maximises using the Louvain method Blondel2008 from 100 different random initial guesses. The consistency and robustness of the 100 partitions obtained from the optimisations is assessed with the normalised variation of information (VI) Meila2007 , as described in Refs. Lambiotte2008 ; Schaub2012 ; see Fig. S2 in the SI. The VI allows us to gauge the consistency of the partitions obtained from optimising at each . A decrease in VI (or an inflection point) at a particular value of suggests relevant community structure at this time scale.
The computational complexity of Markov Stability in its full form (as used here) is slightly better than due to the computation of the matrix exponential. This is appropriate for graphs up to several thousands of nodes. For larger graphs, Refs. Lambiotte2008 ; Delvenne2013 discuss an approximate (linearised) version of Markov Stability which is approximately and can be applied to much larger graphs LeMartelot2013 .
A.2 Finding flow roles in directed networks with RBS-RMST
To classify the nodes according to roles, we combine role-based similarity Cooper2010 ; Cooper2010a with the relaxed minimum spanning tree algorithm and Markov Stability. We start by creating the role-based similarity (RBS) matrix, which exploits the directed structure of the graph to obtain a similarity score that measures how alike the flow connectivities of nodes are.
For each node, we obtain a profile vector that contains the number of incoming and outgoing directed paths (incoming and outgoing) of lengths from 1 up to for all nodes. The number of paths corresponding to each node is scaled by a constant and stored as row vectors to create the matrix:
| (5) |
where , and is the largest eigenvalue of . The cosine distances between any two rows of are stored in the similarity matrix :
| (6) |
By construction with whenever nodes and have very similar profiles of incoming and outgoing paths of all lengths, i.e., when nodes and play similar roles in the network in terms of flow generation, distribution and consumption. If we choose a small , the terms converge quickly and the maximum path length () is small. Hence we would classify nodes according only to their immediate neighbourhoods (in the limit of , nodes are classified according to and only). If, on the other hand, is close to 1, the resulting is larger, thus including global information of the network to classify the nodes. We have followed the iteration prescription detailed in Cooper2010 and used , which gives . In its current form, t he computational complexity of RBS in its current form is slightly better than . Further algorithmic improvements of this method will be the object of upcoming publications.
A.3 The relaxed minimum spanning tree similarity graph
The similarity matrix is then transformed into a role similarity graph (Fig. 5) by using the RMST algorithm, which uses a geometric graph embedding based on the iterative addition of relevant edges to the backbone of the minimum spanning tree: edges are only added if there is no alternative path on the tree with a lower distance. This construction attempts to preserve the continuity of the dataset, thus unfolding the structure of the data. The similarity network thus constructed is then analysed for communities using Markov Stability.
In sum, from the original adjacency matrix of the network we use RBS to compute the pairwise similarity between the nodes in the matrix ; then we use the RMST to extract the role similarity graph; and on this graph we perform community detection to obtain the roles of the nodes. We find that the similarity graph of the Twitter network has a robust partition into five types of roles (at Markov time , with zero variation of information, see SI). The role classification for every node is provided in the Supplemental Spreadsheet.
The basic idea of RMST is that weak cosine similarities between high dimensional vectors are non-informative and do not contribute to our understanding of the structure of the dataset—in high dimensional space weak similarities are commonplace thus clouding the relationships in the network. Our strategy for the role similarity graph primes the importance of strong similarities: two nodes will not be linked directly in the role similarity graph, if there is already a chain of strong similarities (a weighted path) that links them. More precisely, consider the distance matrix , where is the distance between nodes and according to their flow profile vectors. The classical strategy for network construction from a distance matrix is to include an edge between two points if the pairwise distance is less than a threshold value (e.g., if ). The problem with this crude strategy is that it does not recover the geometry of the data when the points are not homogeneously distributed Tenenbaum2000 . If the threshold is small, the network will consist of several disconnected components. If the threshold is large then the network will contain densely connected components, which would take us back to the same problem we had with the full matrix. These problems appear because of the local nature of such an approach, which is exclusively based on local distances.
Instead, we use a global strategy for the construction of the role similarity graph using the Relaxed Minimum Spanning Tree (RMST) algorithm, a method well-suited for extracting meaningful networks from datasets that are not homogeneously distributed in a high-dimensional space (in this case ). We begin with a Minimum Spanning Tree (MST) as the initial backbone of the graph, and we add edges iteratively using the following simple heuristic (note that the MST is such that the sum of edges in the tree is minimal, and a path in the MST is the path between two nodes that minimises the maximal edge weight). At each step of the iteration, we consider whether the MST path between any pair of nodes and is a significantly better model compared to the direct edge . If the maximal edge weight in the MST path is significantly smaller than , the MST path is considered a better model based on the continuity achieved through short distances. If, on the contrary, the maximal edge weight along the MST path is comparable to , then we consider that there is not sufficient evidence to say that the MST path is a better model for data continuity and we add an edge between and in the RMST. Therefore, the edges in the RMST are generated as:
| (7) |
where is the maximal edge weight in the MST path between nodes and , is the distance from node to its -th nearest neighbour, and is a positive constant (here, and ). The factor approximates the local distribution of data points around every point. Our approximation of the local distribution around a point is motivated by the Perturbed Minimum Spanning Tree algorithm Carreira2005 . This iteration is continued until no more edges are added to the RMST. We call this the role similarity graph. The complexity of the RMST algorithm is .
Acknowledgments
MBD, SNY and MB acknowledge support from the UK EPSRC through grant EP/I017267/1 under the Mathematics Underpinning the Digital Economy program. BV was funded by a PhD studentship of the BHF Centre for Research Excellence. MBD also acknowledges support from the James S. McDonnell Foundation Postdoctoral Program in Complexity Science/Complex Systems-Fellowship Award (#220020349-CS/PD Fellow). The authors thank Michael Schaub for many useful conversations.
Supplementary Information
The Supplementary Spreadsheet accompanying this text can be downloaded from: http://www2.imperial.ac.uk/~mbegueri/Docs/riotsCommunities.zip or http://rsif.royalsocietypublishing.org/content/11/101/20140940/suppl/DC1
Appendix S1 The UK riots Twitter network
S1.1 The Guardian’s list of influential user during the UK riots of 2011
Recently, the British newspaper The Guardian announced that it possessed a database of 2.5 million Twitter messages (tweets) related to the riots that took place in England during the summer of 2011. In December 2011, The Guardian made public a list of the 1000 most influential Twitter users according to the number of forwarded (re-tweeted) status updates during the riots Evans2011 . This diverse list of Twitter users includes large news and media outlets, social and political organisations, as well as personal accounts of politicians, journalists, activists, celebrities, and parody accounts. In addition, a considerable fraction of the list is formed by regular individuals whose tweets received attention during the riots, and about whom little is known. The list provided by The Guardian contains the Twitter user name, the number of re-tweets, and a mini-biography of at most 140 characters which Twitter users can provide to describe themselves.
S1.2 Creating the Twitter network from The Guardian’s list
We created the network from The Guardian’s list (Figure 1 of the Main Text) by mining Twitter in February 2012 and obtaining the “friends” of all users in the list, i.e., the Twitter accounts to which each user is subscribed, which is publicly available information. A directed, unweighted network was obtained by intersecting the list of friends with the members of the list. In this network, the information flows from target to source along each edge, i.e., opposite to the direction of the edge, which represents the declared interest of the source node (Fig. S1A). The resulting directed network has a giant component of 914 nodes. The remaining 86 nodes are either completely disconnected (i.e., they do not follow nor are followed by anyone on the list), or their accounts have since been discontinued. All the subsequent work in this paper uses this 914-node network.
S1.3 Some statistics of the network
The distribution of the number of retweets of the members of the list (Fig. S1B) is compatible with a power-law with exponent (, using the criterion in Ref. Clauset2009 ), which is consistent with previous analyses of Twitter data sets Zhou2010 . The cumulative in- and out-degree distributions of the connected component are shown in Fig. S1C. Although both distributions appear exponential with, respectively, parameters and , a Kolmogorov-Smirnov statistic does not provide statistically significant support for this hypothesis (). The distributions of and in this data are less skewed than other published results Kwak2010 . Note also that the in- and out-degrees are similarly fat-tailed, in contrast with other studies in which was found to be more skewed than Wu2011 . These differences of our distributions with other published reports may be due to the fact that our relatively small user list corresponds to a subset of users with a high number of retweets in The Guardian’s riot tweet database, and may not be representative of the wider network of all Twitter users.
Appendix S2 Interest communities at different levels of resolution in the Twitter network of the 2011 UK riots
As a relevant application of current interest, we use the Markov Stability framework to analyse a directed graph derived from a social network: the Twitter network derived from The Guardian list of influential users during the UK riots.
In Fig. 1A of the Main Text we show the number of communities and in Fig. S2, we show the variation of information (VI) obtained after optimising stability for Markov times between and . Below we provide some examples of communities found at different Markov times (marked with red circles on the variation of information (VI) in Fig. S2). These examples were highlighted due to the relative robustness of the communities, as well as a means to showcase the different types of communities found at different levels of resolution.
In the Supplementary Spreadsheet, we provide a spreadsheet with all the communities found at all Markov times. The convention we have followed to name the communities is T[Markov time]-C[community number].
S2.1 Communities at high level of resolution
At short Markov times (), we find a revealing partition with 149 communities. Though granular, the community structure of the partition shows interesting features. Some of the communities in this partition correspond to a precise geographical location in England or within a city (Fig. S3). For example, there are communities from Hackney (where the riots began) and Croydon. The latter includes the account of London’s Mayor (mayoroflondon). Other geographically homogeneous communities are from the Midlands, Liverpool, and Manchester (T0.15-C10, T0.15-C11 and T0.15-C28).
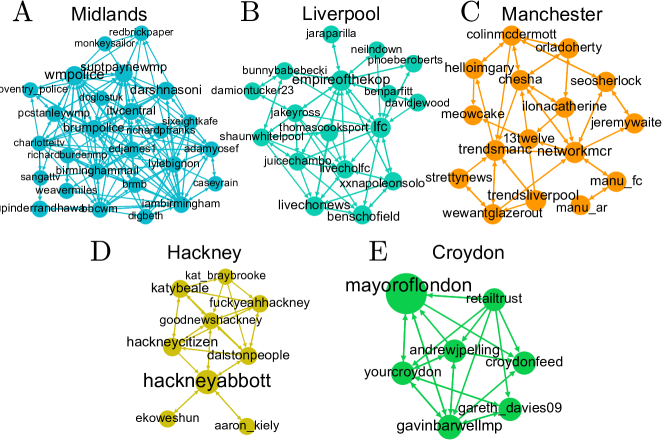
Coexisting with those geographical communities at this level of resolution, we also find journalists and media outlets in other communities defined by their affiliation. Figure S4 shows communities from The Daily Telegraph, The Independent, ITV, Sky and the BBC. Other interesting communities in this partition are, for example, formed by UK activists (T0.15-C0), and another formed by the Anonymous Internet activist group (T0.15-C12), see the Supplemental Material.
S2.2 Communities at medium level of resolution
As the Markov time grows, the communities become coarser. In Fig. S5, we show the partition of the network at Markov time , when there are 48 communities in the riot network. The largest community in this partition (T0.5-C0) with 57 members is the ‘Sports’ community. Other examples of communities found at this level of resolution include a community of ‘Comedians, writers and presenters’; a ‘Parody’ community; a community of ‘Music journalists and artists’; a community of ‘Police forces and crime journalists’; a ‘London’ community; a community of ’Activist, students and journalists with a focus on the Middle East’; and an ’Online media’ community of (mostly) Internet media outlets, individuals and companies.

S2.3 Communities at a coarser level of resolution
When the Markov time is longer () we find a partition into 15 communities in the network. In Fig. 6 of the Main Text we present a coarse-grained overview of the communities, their relationships, and their word cloud self-descriptions. This partition, its communities, and the global view of the network it provides are discussed at length in the Main Text.
S2.4 Communities at low level of resolution
Finally, at long Markov times (), we find the partition into 4 communities shown in Fig. 1C of the Main Text. At this level of resolution there are three large communities consisting of nodes with prevailing interest in ‘Media an entertainment’ (T7.4-C0), ‘UK politics, activism and journalism’ (T7.4-C1), and ‘International media and activism’ (T7.4-C2). In stark contrast, the fourth community (T7.4-C3) is small and contains only 26 nodes mostly related to the BBC.
S2.5 The change in the community structure when directionality is ignored
As discussed in the Main text, the community structure detected is significantly different if the directionality of the edges is ignored. This phenomenon was exemplified through two examples: the BBC community (in Fig. 2 of the Main Text, which was heavily affected when directionality was neglected) and the Monbiot community (in Fig. 3 of the Main Text, which remained relatively unaffected).
To complement this view, we show here the comparison of the communities found at all Markov times for the directed riots network and two undirected versions of it: an undirected network obtained by simply ignoring the direction of the edges, and a symmetrised version of the network whose adjacency matrix is (i.e., reciprocal edges have twice the weight of nonreciprocal ones). In Fig. S6A-B, we show that the partitions found in the directed network are different from those found in the undirected and symmetrised versions across all Markov times, whereas both symmetrised versions are similar to each other (Fig. S6C). The differences between the directed and undirected versions are high at small Markov times and, as expected, they become smaller as the Markov time grows (i.e., at lower resolutions). Hence the most prominent effect of ignoring directionality in this network is to blur the fine structure of the flow communities.
For ease of comparison, the full sets of partitions for both the directed and undirected graphs at all Markov times is given in the Supplementary Spreadsheet.
S2.6 Comparison with other community detection methods—Infomap
As a comparison with our directed Markov Stability methodology, we analysed the community structure of the directed Twitter network using Infomap Rosvall2008 ; Rosvall2011 , as downloaded from http://www.mapequation.org/. Infomap is a well-known method for community detection in directed and undirected networks based on information compression, which has been shown to perform well in some benchmarks with clique-like communities.
In this case, Infomap obtains partitions only at two levels of resolution. The finer of these two partitions consists of 342 communities: 318 communities contain only one node; 50 communities contain only two nodes; and the largest community contains 60 nodes. The coarser of these two partitions has 60 communities: 26 communities still have only one node while the largest community has 342 nodes, i.e., more than a third of the nodes in the network. Hence, in this case, the communities obtained by Infomap lead to an over-partitioned description of our Twitter network.
We provide all the partitions obtained with Infomap in the Supplemental Spreadsheet.
These results of Infomap are consistent with the analysis presented in Refs. Schaub2012a ; Schaub2012 , where it is shown that Infomap is a one-step method, which is highly efficient for the detection of clique-like communities but which may lead to over-partitioning when the communities are non-clique like. In contrast, Markov Stability makes use of the full transients (i.e. the complete dynamics with paths of all lengths, as shown in Fig. S8A and Fig. 1 from the Main text) to unfold the community structure across scales. This tendency of Infomap to over-partitioning in some networks is signalled by a large compression gap Schaub2012a with respect to the optimal compression. In this particular case, the code-length of the Infomap partition is 8.3977 bits (after 500 trials) and the compression gap is 0.3647, which is more than three times larger than is achieved for clique-like communities Schaub2012a . Hence, although in other instances and benchmarks Infomap performs very well, for this network it does not produce the nuanced description at different levels of resolution that our method delivers through the full use of flow transients Schaub2012a ; Schaub2012 . If the direction of the edges is ignored, this over-partitioning effect of Infomap is even more striking. For the undirected graph, Infomap obtains two partitions (code-length: 9.22 bits, compression-gap: 0.455), with 800 communities in the finer partition and 6 communities in the coarser partition, one of which contains 894 nodes.
Appendix S3 Self-descriptions from Twitter biographies
Interpreting the communities found in the analysis by looking through all their members is mostly impractical. As an aid to assess the quality and intrinsic content of the communities found, we tap into the information contained in the mini-biographies provided by the users. Our premise is that we can learn valuable information about a community from the small texts that the members write about themselves. To do this in a more systematic manner, we collect all the biographies of a community in a single file (removing urls, emails, numbers, function words, and other nonstandard characters) and count the occurrences of all words. We then compile the most frequently used words as an aid in the characterisation of each community and construct word cloud visualisations WordCloudWebsite of the word-frequencies of the 50 most used words in each community. The word frequencies (and their word-cloud representation) acts as a ‘self description’ of each community.

In some cases, the self-descriptions of the users in a community share highly indicative words, which appear prominently in the word clouds. Figure S5 shows that the word clouds of several communities at all represent well their character. For example, the members of the ’Middle-East activism’ community describe themselves using a consistent vocabulary representing their interests, as shown in Fig. S7A.
On the other hand, other communities are more heterogeneous in the self-descriptions of their members. For instance, the members of the ‘Parody’ community do not use a common vocabulary to describe themselves (Fig. S7B), so in this case the word frequencies do not help establish the nature of the community. Indeed, this group does not share a common thematic content but are otherwise linked by their acting as ironic reflections of a variety of celebrities. This is reflected in their identification as an interest community. If we analyse the membership of the community carefully, one can see that the community contains many parody accounts (e.g., parodies of the Queens of England and the Netherlands, and Star Wars and Lord of the Rings characters).
In general, given the small amount of text available in the self-descriptions, the word frequencies and word-clouds must be used judiciously. However, they can be of great aid in providing a simple visual interpretation of the communities, as shown in the figures in this Supplemental Information and the Main Text.
Appendix S4 Using the RMST-RBS similarity graph to uncover roles in the network
The RMST-RBS graph thus constructed is a new graph (undirected and unweighted), which captures geometrically how similar two nodes are, based on their vectors of incoming and outgoing flow profiles. Clearly, this role similarity graph is distinct from the original graph that originated it: two nodes are connected in the role similarity graph only if they have similar profiles of incoming and outgoing paths in the Twitter network, regardless of whether they are neighbours in the original network. Figure 5 in the Main Text shows the role similarity graph constructed from the Twitter riot network.
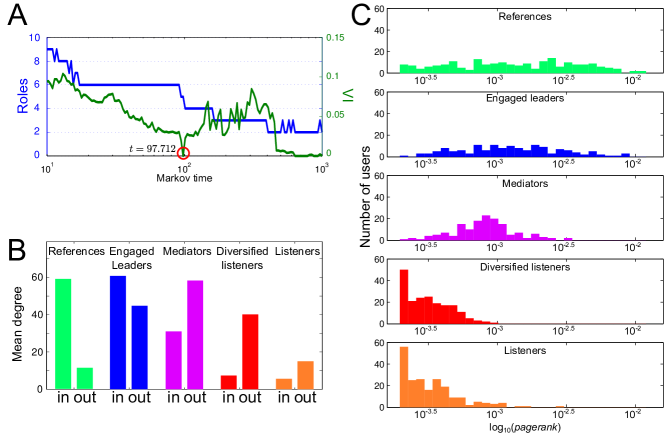
We apply a graph-theoretical community detection method (in this case undirected Markov Stability) to the role similarity graph to find if there any significant groups of nodes with similar flow profiles, without imposing their number or type a priori. Figure S8A shows that the Markov Stability analysis of the role similarity graph finds a very robust partition into five communities of approximately similar sizes at . At this Markov time, the variation of information is 0, which means that in all of the 100 times we ran the community detection algorithm we obtained the exact same partition. These five communities in the role similarity graph correspond to classes (or types) of roles in the network. In the Supplemental Material we provide the full classification of nodes according to these roles.
To interpret the five clusters found by our analysis, we examine a posteriori different characteristics of their members. Figure S8B shows the mean in and out degree in the original Twitter network of the nodes in each class found. Two of the groups found have higher mean in-degree (i.e., Twitter followers) than out-degree, while for the other three groups the reverse is true (i.e., they follow more than they are followed by). If we coarse-grain the original Twitter network lumping together all the nodes with the same role (as in Fig. 5 of the Main Text), a striking pattern of connectivity is revealed with classes of nodes mostly receiving attention (sinks of interest or sources of information), other classes mostly behaving as sources of interest (recipients of information) and other classes in between. This leads to our renaming our role classes as: references, engaged leaders, mediators, diversified listeners, and listeners (see Main Text for more details). Finally, the PageRank distributions shown in Fig. S8C also help illustrate the differences between leader, follower, and mediator roles, but would not be able to discriminate between the roles obtained from our analysis of the role similarity graph.
S4.1 Comparison to other classic notions of roles in social network analysis
The notion of node roles in graphs has been studied from different perspectives, especially in social network analysis. A classic example is structural equivalence (SE) in which two nodes have the same role if they share the same neighbours Lorrain1971 ; Leicht2006 , i.e., if they are swapped the network remains the same. One can compute how similar (in the SE sense) are two nodes based on the number of common neighbours. SE roles are thus based on computing the number of common immediate neighbours and bear no resemblance to the flow roles detected via the RMST-RBS approach. In particular, our approach allows nodes with no common neighbours to have the same role, counter to the SE definition.
Another classic notion of role in social networks stems from the theory of regular equivalence (RE). RE uses node colorations (or labellings) to find groups of nodes with the same role White1983 ; Everett1994 ; Everett1996 . Suppose is a node in the network with in-neighbours and out-neighbours . The colour of is and the colour of the in and out-neighbourhoods are and respectively. A coloration is said to be (exactly) regular Everett1994 if for any two nodes and
| (S1) |
In a regular (or approximately regular) coloration of a network, nodes with the same colour are said to have the same role Everett1996 ; Luczkovich2003 . In its strict sense, the RE definition of role is combinatorial (and thus lacking robustness in many real-world networks networks). Furthermore, it is only based on the consideration of the coloration of immediate neighbourhoods of each node. Hence it leads to a very different classification of roles to that obtained with the RMST-RBS algorithm.
We have obtained the roles of nodes in the riots network obtained using RE models, and compared them to the RMST-RBS roles obtained above. To obtain the RE classes we use two well-known algorithms: REGE Borgatti1993 , which obtains similarities between the nodes based on RE, and EXCATRE Everett1996 which produces a sequence of regular (or approximately regular) colorations. We have included the EXCATRE and REGE partitions in the Supplemental Spreadsheet.
The EXCATRE algorithm applied to the riots network finds only one non-trivial coloration with 734 roles. (Two trivial colorations are also obtained: all nodes with the same colour and each node with its own colour.) On closer investigation, the roles identified by EXCATRE correspond trivially to nodes with identical in and out-degree, and hence it corresponds to considering only immediate neighbourhoods in the graph (i.e., it would be found by RMST-RBS setting both and equal to 1 so that only paths of length one are considered). In our analysis above, we used (which converges at ), and the roles obtained by RMST-RBS incorporate global flow information from the graph.
The REGE algorithm iteratively constructs a similarity matrix between nodes based on the similarities between their neighbours. The similarity matrix is then clustered using hierarchical clustering techniques to obtain roles Luczkovich2003 . We apply the REGE algorithm to the riots network (which converges after 6 iterations) and obtain five clusters (or roles) with 806, 59, 46, 2 and 1 nodes each. These roles are not informative: the cluster with 59 nodes contains all the source nodes (in-degree 0); the cluster with 46 nodes contains all the sink nodes (out-degree 0); while almost all the nodes in the network fall in the cluster with 806 nodes which lies between them. The two small clusters with 2 and 1 nodes lie in slightly different positions with respect to the sink and node clusters. As with EXCATRE, these roles are the result of an analysis based on immediate neighbourhoods (in and out-paths of length one).
Although RE-based methods and RMST-RBS attempt to find roles in networks, their conceptual foundation is different. Both approaches aim to identify the ‘types’ of nodes that exist in the network (allowing for the possibility that two nodes on opposite ends of the network and no common neighbours could be of the same type) but they use different information to do so. RE-based methods analyse the similarities between neighbourhoods under colorations, while RMST-RBS identifies similarities in the transient pattern of long-range flows though each node. Because of the use of flows at all scales in the network, from local to global neighbourhoods, the RMST-RBS method provides a more balanced classification into node classes. In addition, RMST-RBS is less sensitive to small changes in connectivity, and thus more robust for the analysis of realistic networks. For example, if we create an edge from a node in the 806-node REGE cluster to the 59-node cluster of sources (e.g., when a Twitter user decides to ’follow” another user), this node would change roles immediately. Hence in this specific context, a RE-based analysis of the network is non robust.
Appendix S5 Integrating interest communities and roles: informational organigrams
Our two analyses (interest communities and user roles) can be brought together to classify the informational organisation of communities, as given by the different mix of roles within each community. In Fig. 6 of the Main Text we show that the 15 communities obtained at can be broadly classified into four organigrams, which go from a purely broadcast community (of references and listeners) to other communities that involve dialogue between engaged leaders, mediators and diversified listeners.
The four organigrams were found by using the mix of roles of each community (a five-dimensional vector containing the proportion of nodes in the community that belong to each role-class) and performing a simple k-means clustering on the communities. In other words, each community can be represented by a point inside the unit cube in , and with k-means we identify the clusters of communities whose role mixes are similar.
References
- (1) V. D. Blondel, J.-L. Guillaume, R. Lambiotte, and E. Lefebvre, Fast unfolding of communities in large networks, Journal of Statistical Mechanics: Theory and Experiment, 2008 (2008), p. P10008.
- (2) D. D. Bock, W.-C. A. Lee, A. M. Kerlin, M. L. Andermann, G. Hood, A. W. Wetzel, S. Yurgenson, E. R. Soucy, H. S. Kim, and R. C. Reid, Network anatomy and in vivo physiology of visual cortical neurons., Nature, 471 (2011), pp. 177–182.
- (3) S. P. Borgatti and M. G. Everett, Two algorithms for computing regular equivalence, Social Networks, 15 (1993), pp. 361 – 376.
- (4) D. Brossard and D. A. Scheufele, Social science. science, new media, and the public., Science, 339 (2013), pp. 40–41.
- (5) G. Carlsson, F. Mémoli, A. Ribeiro, and S. Segarra, Axiomatic Construction of Hierarchical Clustering in Asymmetric Networks, in Proc. Int. Conf. Acoustics Speech Signal Process, Vancouver, Canada, May 2013.
- (6) M. A. Carreira-Perpiñán and R. S. Zemel, Proximity graphs for clustering and manifold learning, in Advances in Neural Information Processing Systems 17, L. K. Saul, Y. Weiss, and L. Bottou, eds., MIT Press, Cambridge, MA, 2005, pp. 225–232.
- (7) A. Clauset, C. Shalizi, and M. Newman, Power-law distributions in empirical data, SIAM Review, 51 (2009), pp. 661–703.
- (8) G. Coleman, Hacker politics and publics, Public Culture, 23 (2011), pp. 511–516.
- (9) K. Cooper, Complex Networks: Dynamics and Similarity, PhD thesis, University of London, 2010.
- (10) K. Cooper and M. Barahona, Role-based similarity in directed networks, arXiv:1012.2726, (2010).
- (11) M. Davidian and T. A. Louis, Why statistics?, Science, 336 (2012), p. 12.
- (12) J.-C. Delvenne, M. T. Schaub, S. N. Yaliraki, and M. Barahona, The stability of a graph partition: A dynamics-based framework for community detection, in Time Varying Dynamical Networks, N. Ganguly, A. Mukherjee, M. Choudhury, F. Peruani, and B. Mitra, eds., Birkhäuser, Springer, 2013. In press.
- (13) J.-C. Delvenne, S. Yaliraki, and M. Barahona, Stability of graph communities across time scales, Proceedings of the National Academy of Sciences, 107 (2010), pp. 12755–12760. Also: arXiv:0812.1811 (2008).
- (14) S. Denef, P. Bayerl, and N. Kaptein, Social media and the police – tweeting practices of british police forces during the august 2011 riots., in Proceedings of the Computer-Human Interaction Conference., ACM, 2013.
- (15) L. Evans and F. Vis, 200 most influential Twitter users during the riots: are you on the list?, December 2011. The Guardian Data Blog http://www.guardian.co.uk/news/datablog/2011/dec/08/riot-twitter-top-200.
- (16) M. G. Everett and S. P. Borgatti, Regular equivalence: General theory, The Journal of Mathematical Sociology, 19 (1994), pp. 29–52.
- (17) M. G. Everett and S. P. Borgatti, Exact colorations of graphs and digraphs, Social Networks, 18 (1996), pp. 319 – 331.
- (18) J. Feinberg, Wordle. http://www.wordle.net/.
- (19) S. Fortunato, Community detection in graphs, Physics Reports, 486 (2010), pp. 75 – 174.
- (20) M. Garcia-Herranz, E. Moro, M. Cebrian, N. A. Christakis, and J. H. Fowler, Using friends as sensors to detect global-scale contagious outbreaks, PLoS ONE, 9 (2014), p. e92413.
- (21) J. Giles, Computational social science: Making the links., Nature, 488 (2012), pp. 448–450.
- (22) S. Goel, J. M. Hofman, S. Lahaie, D. M. Pennock, and D. J. Watts, Predicting consumer behavior with web search, Proceedings of the National Academy of Sciences, 107 (2010), pp. 17486–17490.
- (23) B. A. Huberman, Sociology of science: Big data deserve a bigger audience., Nature, 482 (2012), p. 308.
- (24) P. Kaluza, A. Kölzsch, M. T. Gastner, and B. Blasius, The complex network of global cargo ship movements., J R Soc Interface, 7 (2010), pp. 1093–1103.
- (25) D. King, D. Ramirez-Cano, F. Greaves, I. Vlaev, S. Beales, and A. Darzi, Twitter and the health reforms in the english national health service, Health Policy, (2013), pp. –.
- (26) J. M. Kleinberg, Authoritative sources in a hyperlinked environment, J. ACM, 46 (1999), pp. 604–632.
- (27) H. Kwak, C. Lee, H. Park, and S. Moon, What is twitter, a social network or a news media?, in Proceedings of the 19th international conference on World wide web, WWW ’10, New York, NY, USA, 2010, ACM, pp. 591–600.
- (28) R. Lambiotte, J. Delvenne, and M. Barahona, Laplacian dynamics and multiscale modular structure in networks, arXiv:0812.1770, (2008).
- (29) R. Lambiotte and M. Rosvall, Ranking and clustering of nodes in networks with smart teleportation, Phys. Rev. E, 85 (2012), p. 056107.
- (30) E. Le Martelot and C. Hankin, Fast multi-scale detection of relevant communities in large-scale networks, The Computer Journal, 56 (2013), pp. 1136–1150.
- (31) E. A. Leicht, P. Holme, and M. E. J. Newman, Vertex similarity in networks, Phys. Rev. E, 73 (2006), p. 026120.
- (32) F. Lorrain and H. C. White, Structural equivalence of individuals in social networks, The Journal of Mathematical Sociology, 1 (1971), pp. 49–80.
- (33) J. J. Luczkovich, S. P. Borgatti, J. C. Johnson, and M. G. Everett, Defining and measuring trophic role similarity in food webs using regular equivalence, Journal of Theoretical Biology, 220 (2003), pp. 303 – 321.
- (34) M. Meilă, Comparing clusterings—an information based distance, Journal of Multivariate Analysis, 98 (2007), pp. 873 – 895.
- (35) S. Milan, The guardians of the internet? politics and ethics of cyberactivists (and of their observers), in INTER-ASIA ROUNDTABLE 2012: Methodological and Conceptual Issues in Cyber Activism Research, August 2012.
- (36) M. A. Porter, J.-P. Onnela, and P. J. Mucha, Communities in networks, Notices of the American Mathematical Society, 56 (2009), p. 1082.
- (37) M. Rosvall and C. T. Bergstrom, Maps of random walks on complex networks reveal community structure., Proc Natl Acad Sci U S A, 105 (2008), pp. 1118–1123.
- (38) , Multilevel compression of random walks on networks reveals hierarchical organization in large integrated systems., PLoS One, 6 (2011), p. e18209.
- (39) M. T. Schaub, J.-C. Delvenne, S. N. Yaliraki, and M. Barahona, Markov dynamics as a zooming lens for multiscale community detection: Non clique-like communities and the field-of-view limit, PLoS ONE, 7 (2012), p. e32210.
- (40) M. T. Schaub, R. Lambiotte, and M. Barahona, Encoding dynamics for multiscale community detection: Markov time sweeping for the map equation., Phys Rev E Stat Nonlin Soft Matter Phys, 86 (2012), p. 026112.
- (41) F. Schweitzer, G. Fagiolo, D. Sornette, F. Vega-Redondo, A. Vespignani, and D. R. White, Economic networks: the new challenges., Science, 325 (2009), pp. 422–425.
- (42) D. B. Stouffer, M. Sales-Pardo, M. I. Sirer, and J. Bascompte, Evolutionary conservation of species’ roles in food webs., Science, 335 (2012), pp. 1489–1492.
- (43) J. B. Tenenbaum, V. De Silva, and J. C. Langford, A global geometric framework for nonlinear dimensionality reduction, Science, 290 (2000), pp. 2319–2323.
- (44) E. Tonkin, H. D. Pfeiffer, and G. Tourte, Twitter, information sharing and the london riots?, Bulletin of the American Society for Information Science and Technology, 38 (2012), pp. 49–57.
- (45) D. R. White and K. P. Reitz, Graph and semigroup homomorphisms on networks of relations, Social Networks, 5 (1983), pp. 193 – 234.
- (46) S. Wu, J. M. Hofman, W. A. Mason, and D. J. Watts, Who says what to whom on twitter, in Proceedings of the 20th international conference on World wide web, WWW ’11, New York, NY, USA, 2011, ACM, pp. 705–714.
- (47) Z. Zhou, R. Bandari, J. Kong, H. Qian, and V. Roychowdhury, Information resonance on twitter: watching Iran, in Proceedings of the First Workshop on Social Media Analytics, SOMA ’10, New York, NY, USA, 2010, ACM, pp. 123–131.
- (48) The stability of a graph partition. http://www2.imperial.ac.uk/~mpbara/Partition_Stability/.