Testing against a linear regression model using ideas from shape-restricted estimation
Abstract
A formal likelihood ratio hypothesis test for the validity of a parametric regression function is proposed, using a large-dimensional, nonparametric double cone alternative. For example, the test against a constant function uses the alternative of increasing or decreasing regression functions, and the test against a linear function uses the convex or concave alternative. The proposed test is exact, unbiased and the critical value is easily computed. The power of the test increases to one as the sample size increases, under very mild assumptions – even when the alternative is mis-specified. That is, the power of the test converges to one for any true regression function that deviates (in a non-degenerate way) from the parametric null hypothesis. We also formulate tests for the linear versus partial linear model, and consider the special case of the additive model. Simulations show that our procedure behaves well consistently when compared with other methods. Although the alternative fit is non-parametric, no tuning parameters are involved.
Key words: additive model, asymptotic power, closed convex cone, convex regression, double cone, nonparametric likelihood ratio test, monotone function, projection, partial linear model, unbiased test.
1 Introduction
Let and consider the model
| (1) |
where , , are i.i.d. with mean 0 and variance 1, and . In this paper we address the problem of testing where
| (2) |
and is a known design matrix. We develop a test for which is equivalent to the likelihood ratio test with normal errors. To describe the test, let be a large-dimensional convex cone (for a quite general alternative) that contains the linear space , and define the “opposite” cone . We test against and the test statistic is formulated by comparing the projection of onto with the projection of onto the double cone . Projections onto convex cones are discussed in Silvapulle and Sen, (2005), Chapter 3; see Robertson et al., (1988) for the specific case of isotonic regression, and Meyer, 2013b for a cone-projection algorithm.
We show that the test is unbiased, and that the critical value of the test, for any fixed level , can be computed exactly (via simulation) if the error distribution is known (e.g., is assumed to be standard normal). If is assumed to be completely unknown, the the critical value can be approximated via the bootstrap. Also, the test is completely automated and does not involve the choice of tuning parameters (e.g., smoothing bandwidths). More importantly, we show that the power of the test converges to 1, under mild conditions as grows large, for not only in the alternative but for “almost” all . To better understand the scope of our procedure we first look at a few motivating examples.
Example 1: Suppose that is an unknown function of bounded variation and we are given design points in , and data , , from the model:
| (3) |
where are i.i.d. mean zero variance 1 errors, and . Suppose that we want to test that is a constant function, i.e., , for some unknown . We can formulate this as in (2) with and . We can take
to be the set of sequences of non-decreasing real numbers. The cone can also be expressed as
| (4) |
where the constraint matrix contains mostly zeros, except and , and is the largest linear space in . Then, not only can we test for to be constant against the alternative that it is monotone, but as will be shown in Corollary 4.3, the power of the test will converge to , as , for any of bounded variation that deviates from a constant function in a non-degenerate way. In fact, we find the rates of convergence for our test statistic under (Theorem 4.1) and the alternative (Theorem 4.2). The intuition behind this remarkable power property of the test statistic is that a function is both increasing and decreasing if and only if it is a constant. So, if either of the projections of , on and respectively, is not close to , then the underlying regression function is unlikely to be a constant.
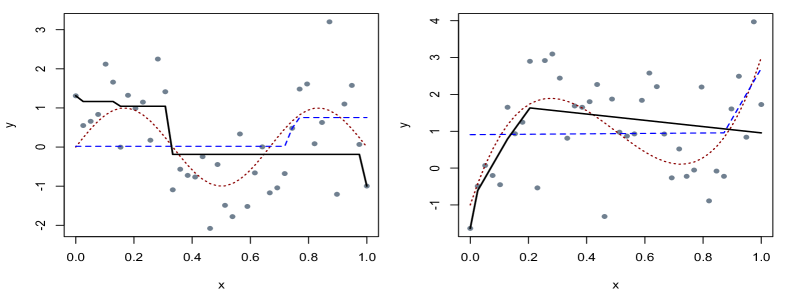
Consider testing against a constant function given the left scatterplot in Fig. 1.1
which was generated from a sinusoidal function. The decreasing fit to the scatterplot represents the projection of onto the double cone, because it has smaller sum of squared residuals than the increasing fit. Although the true regression function is neither increasing nor decreasing, the projection onto the double cone is sufficiently different from the projection onto , to the extent that the proposed test rejects at level . The power for this test, given the indicated function and error variance, is for , rising to for and for . Our procedure can be extended to test against a constant function when the covariates are multi-dimensional; see Section A.3 for the details.
Example 2: Consider (3) and suppose that we want to test whether is affine, i.e., , , where are unknown. This problem can again be formulated as in (2) where and . We may use the double cone of convex/concave functions, i.e., can be defined as
| (5) |
if the values are distinct and ordered. can also be defined by a constraint matrix as in (4) where the non-zero elements of the matrix are , , and . We also show that not only can we test for to be affine against the alternative that it is convex/concave, but as will be shown in Corollary 4.6, the power of the test will converge to for any non-affine smooth . The second scatterplot in Fig. 1.1 is generated from a cubic regression function that is neither convex nor concave, but our test rejects the linearity hypothesis at . The power for this test with and the function specified in the plot is , rising to 0.99 when .
If we want to test against a quadratic function, we can use a matrix appropriate for constraining the third derivative of the regression function to be non-negative. In this case, is and the non-zero elements are , , , and , for . Higher-order polynomials can be used in the null hypothesis by determining the appropriate constraint matrix in a similar fashion.
Example 3: We assume the same setup as in model (3) where now are distinct points in , for . Consider testing for goodness-of-fit of the linear model, i.e., test the hypothesis is affine (i.e., for some and ). Define , and the model can be seen as a special case of (1). We want to test where is defined as in (2) with being the matrix with the -th row , for . We can consider to be the cone of evaluations of all convex functions, i.e.,
| (6) |
The set is a closed convex cone in ; see Seijo and Sen, (2011). Then, is the set of all vectors that are evaluations of concave functions at the data points.
We show that under certain assumptions, when is any smooth function that is not affine, the power of our test converges to 1; see Section 4.3 for the details and the computation of the test statistic. Again, the intuition behind this power property of the test statistic is that if a function is both convex and concave then it must be affine.
Over the last two decades several tests for the goodness-of-fit of a parametric model have been proposed; see e.g., Cox et al., (1988), Azzalini and Bowman, (1993), Eubank and Spiegelman, (1990), Hardle and Mammen, (1993), Fan and Huang, (2001), Stute, (1997), Guerre and Lavergne, (2005), Christensen and Sun, (2010), Neumeyer and Van Keilegom, (2010) and the references therein. Most tests use a nonparametric regression estimator and run into the problem of choosing tuning parameters, e.g., smoothing bandwidth(s). Our procedure does not involve the choice of any tuning parameter. Also, the critical values of most competing procedures need to be approximated using resampling techniques (e.g., the bootstrap) whereas the cut-off in our test can be computed exactly (via simulation) if the error distribution is assumed known (e.g., Gaussian).
The above three examples demonstrate the usefulness of the test with the double cone alternative. In addition, we formulate a test for the linear versus partial linear model. For example, we can test the significance of a single predictor while controlling for covariate effects, or we can test the null hypothesis that the response is linear in a single predictor, in the presence of parametrically-modeled covariates. We also provide a test suitable for the special case of additive effects, and a special test against a constant model.
It is worth mentioning that the problem of testing versus a closed convex cone is well studied; see Raubertas et al., (1986) and Robertson et al., (1988), Chapter 2. Under the normal errors assumption, the null distribution of a likelihood ratio test statistic is that of a mixture of Beta random variables, where the mixing parameters are determined through simulations.
The paper is organized as follows: In Section 2 we introduce some notation and definitions and describe the problem of testing versus a closed convex cone . We describe our test statistic and state the main results about our testing procedure in Section 3. In Section 4 we get back to the three examples discussed above and characterize the limiting behavior of the test statistic under and otherwise. Extensions of our procedure to weighted regression, partially linear and additive models, as well as testing for a constant function in multi-dimension, are discussed in Section 5. In Section 6 we illustrate the finite sample behavior of our method and its variants using simulation and real data examples, and compare it with other competing methods. The Appendix contains proofs of some of the results and other technical details.
2 Preliminaries
A set is a cone if for all and , we have . If is a convex cone then , for any positive scalars and any . We define the projection of onto as
where is the usual Euclidean norm in . The projection is uniquely defined by the two conditions:
| (7) |
where for , , ; see Theorem 2.2.1 of Bertsekas, (2003). From these it is clear that
| (8) |
Similarly, the projection of onto is .
Let
where refers to the orthogonal complement of . Then and are closed convex cones, and the projection of onto is the sum of the projections onto and . The cone can alternatively be specified by a set of generators; that is, a set of vectors in the cone so that
If the matrix in (4) has full row rank, then and the generators of are the columns of . Otherwise, Proposition 1 of Meyer, (1999) can be used to find the generators. The generators of are .
Define the cone polar to as Then, is a convex cone orthogonal to . We can similarly define , also orthogonal to . For a proof of the following see Meyer, (1999).
Lemma 2.1.
The projection of onto is the residual of the projection of onto and vice-versa; also, the projection of onto is the residual of the projection of onto and vice-versa.
We will assume the following two conditions for the rest of the paper:
-
(A1)
is the largest linear subspace contained in ;
-
(A2)
, or equivalently, .
Note that if (A1) holds, does not contain a linear space (of dimension one or larger), and the intersection of and is the origin. Assumption (A2) is needed for unbiasedness of our testing procedure. For Example 1 of the Introduction, (A2) says that the projection of an increasing vector onto the decreasing cone is a constant vector, and vice-versa. To see that this holds, consider , i.e., and , and , i.e., . Then defining the partial sums , we have
which is negative because for . Then by (7) the projection of onto is the origin.
2.1 Testing
We start with a brief review for testing versus , under the normal errors assumption. The log-likelihood function (up to a constant) is
After a bit of simplification, we get the likelihood ratio statistic to be
where and . An equivalent test is to reject if
| (9) |
is large, where is the squared length of the residual of onto , and is the squared length of the residual of onto . Further, , by orthogonality of and .
Since the null hypothesis is composite, the dependence of the test statistic on parameters under the hypotheses must be assessed. The following result shows that the distribution of is invariant to translations in as well as invariant to scale.
Lemma 2.2.
For any , ,
| (10) |
Next, consider model (1) and suppose that . Then the distribution of is the same as that of .
Proof.
To establish the first of the assertions in (10) it suffices to show that satisfies the necessary and sufficient conditions (7) for . Clearly, and
Also,
as , and (as ). The second assertion in (10) can be established similarly, and in fact, more easily. Also, it is easy to see that, for any ,
Now, using (9),
This completes the proof. ∎
3 Our procedure
To test the hypothesis versus , we project separately on and to obtain and , respectively. Let be defined as in (9) and defined similarly, with instead of . We define our test statistic (which is equivalent to the likelihood ratio statistic under normal errors) as
| (11) | |||||
We reject when is large.
Lemma 3.1.
Consider model (1). Suppose that . Then the distribution of is the same as that of , i.e.,
| (12) |
Proof.
The distribution of is also invariant to translations in and scaling, so if , using the same technique as in Lemma 2.2, we have the desired result. ∎
Suppose that has distribution function . Then, we reject if
| (13) |
where is the desired level of the test. The distribution can be approximated, up to any desired precision, by Monte Carlo simulations using (12) if is assumed known; hence, the test procedure described in (13) has exact level , under , for any .
If is completely unknown, we can approximate by , where is the empirical distribution of the standardized residuals, obtained under . Here, by the residual vector we mean and by the standardized residual we mean , where . Thus, can be approximated by using Monte Carlo simulations where, instead of , we draw i.i.d. (conditional on the given data) samples from .
In fact, the following theorem, proved in Section A.4, shows that if is assumed completely unknown, we can bootstrap from any consistent estimator of and still consistently estimate the critical value of our test statistic. Note that the conditions required for Theorem 3.2 to hold are indeed very minimal and will be satisfied for any reasonable bootstrap scheme, and in particular, when bootstrapping from the empirical distribution of the standardized residuals.
Theorem 3.2.
Suppose that is a sequence of distribution functions such that a.s. and a.s. Also, suppose that the sequence is bounded. Let where are (conditionally) i.i.d. and let denote the distribution function of , conditional on the data. Define the Levy distance between the distributions and as
Then,
| (14) |
It can also be shown that for the test is unbiased, that is, the power is at least as large as the test size. The proof of the following result can be found in Section A.1.
Theorem 3.3.
Let , for , and the components of are i.i.d. . Suppose further that is a symmetric (around 0) distribution. Choose any and let . Then for any ,
| (15) |
It is completely analogous to show that the theorem holds for . The unbiasedness of the test now follows from the fact that if , then for and either or . In both cases, for and , for some , by (25) we have
3.1 Asymptotic power of the test
We no longer assume that is in the double cone unless explicitly mentioned otherwise. We show that, under mild assumptions, the power of the test goes to one, as the sample size increases, if is not true. For convenience of notation, we suppress the dependence on and continue using the notation introduced in the previous sections. For example we still use , etc. although as changes these vectors obviously change. A intuitive way of visualizing , as changes, is to consider as the evaluation of a fixed function at points as in (3).
We assume that for any the projection is consistent in estimating , under the squared error loss, i.e., for as in model (1) and ,
| (16) |
The following lemma shows that even if does not lie in , (16) implies that the projection of the data onto is close to the projection of onto ; see Section A.4 for the proof.
Lemma 3.4.
Theorem 3.5.
Proof.
Under , . The denominator of is . As is a finite dimensional vector space of fixed dimension, . The numerator of can be handled as follows. Observe that,
where we have used Lemma 3.4 and the fact . Therefore, and thus, . An exact same analysis can be done for to obtain the desired result. ∎
Next we consider the case where the null hypothesis does not hold. If is the projection of on the linear subspace , we will assume that the sequence , as grows, is such that
| (18) |
for some constant . Obviously, if , then and (18) does not hold. If , then (18) holds if , because either which implies (by (A2)), or which in turn implies . Observe that (18) is essentially the population version of the numerator of our test statistic (see (11)), where we replace by . The following result, proved in Section A.4, shows that if we have a twice-differentiable function that is not affine, then then (18) must hold for some .
Theorem 3.6.
Suppose that , , is a twice-continuously differentiable function. Suppose that be a sequence of i.i.d. random variables such that , a continuous distribution on . Let . Let be defined as in (6), i.e., is the convex cone of evaluations of all convex functions at the data points. Let and let be the set of evaluations of all affine functions at the data points. If is not affine a.e. , then (18) must hold for some .
Intuitively, we require that is different from the null hypothesis class of functions in a non-degenerate way. For example, if a function is constant except at a finite number of points, then (18) does not hold. Some further motivation for condition (18) is given in Section A.2.
Theorem 3.7.
Proof.
The denominator of is . As is a finite dimensional vector space of fixed dimension, , for some . The numerator of can be handled as follows. Observe that
Therefore, using (3.1) and the previous display, we get
Using a similar analysis for gives the desired result. ∎
Corollary 3.8.
4 Examples
In this section we come back to the examples discussed in the Introduction. We assume model (3) and that there is a class of functions that is approximated by points in the cone . The double cone is thus growing in dimension with the sample size . Then (16) reduces to assuming that the cone is sufficiently large dimensional so that if , the projection of onto the cone is a consistent estimator of , i.e., (16) holds with . Proofs of the results in this section can be found in Section A.4.
4.1 Example 1
Consider testing against a constant regression function in (3). The following theorem, proved in Section A.4, is similar in spirit to Theorem 3.5 but gives the precise rate at which the test statistic decreases to , under .
Theorem 4.1.
The following result, also proved in Section A.4, shows that for functions of bounded variation which are non-constant, the power of our proposed test converges to 1, as grows.
Theorem 4.2.
Consider data from model (3) where is assumed to be of bounded variation. Also assume that , for all . Define the design distribution function as
| (19) |
for , where stands for the indicator function. Suppose that there is a continuous strictly increasing distribution function such that
| (20) |
Also, suppose that is not a constant function a.e. . Then for some constant .
Corollary 4.3.
4.2 Example 2
In this subsection we consider testing is affine, i.e., , , where are unknown. Recall the setup of Example 2 in the Introduction.
Observe that as the linear constraints describing , as stated in (5), are clearly satisfied by any . To see that is the largest linear subspace contained in , i.e., (A1) holds, we note that for , only if . Assumption (A2) holds if the projection of a convex function, onto the concave cone, is an affine function, and vice-versa. To see this observe that the generators of are pairwise positively correlated, so the projection of any onto is the origin by (7). Therefore the projection of any positive linear combination of the , i.e., any vector in , onto , is also the origin, and hence projections of vectors in onto are in .
Next we state two results on the limiting behavior of the test statistic under the following condition:
-
Let . Assume that there exists such that , for .
Theorem 4.4.
Remark 4.5.
The following result shows that for any twice-differentiable function on which is not affine, the power of our test converges to 1, as grows.
Theorem 4.6.
Consider data from model (3) where is assumed to be twice-differentiable. Assume that condition (C) holds and suppose that the errors , , are sub-gaussian. Define the design distribution function as in (19) and suppose that there is a continuous strictly increasing distribution function on such that (20) holds. Also, suppose that is not an affine function a.e. . Then for some constant .
Remark 4.7.
The proof of the above result is very similar to that of Theorem 4.2; we now use the fact that a twice-differentiable function on can be expressed as the difference of two convex functions.
Corollary 4.8.
Consider the same setup as in Theorem 4.6. Then, for , the power of the test based on converges to 1, as
4.3 Example 3
Consider model (3) where now , for , is a set of distinct points and is defined on a closed convex set . In this subsection we address the problem of testing is affine. Recall the notation from Example 3 in the Introduction. As the convex cone under consideration cannot be easily represented as (4), we first discuss the computation of and . We can compute by solving the following (quadratic) optimization problem:
| (21) | ||||
where , and and ; see Seijo and Sen, (2011), Lim and Glynn, (2012), Kuosmanen, (2008). Note that the solution to the above problem is unique in due to the strong convexity of the objective in . The computation, characterization and consistency of has been established in Seijo and Sen, (2011); also see Lim and Glynn, (2012). We use the cvx package in MATLAB to compute . The projection on can be obtained by solving (21) where we now replace the “” in the constraints by “”.
Although we expect Theorem 4.6 to generalize to this case, a complete proof of this fact is difficult and beyond the scope of the paper. The main difficulty is in showing that (16) holds for . The convex regression problem described in (21) suffers from possible over-fitting at the boundary of Conv, where Conv denotes the convex hull of the set . The norms of the fitted ’s near the boundary of Conv can be very large and there can be a large proportion of data points at the boundary of Conv for . Note that Seijo and Sen, (2011) shows that the estimated convex function converges to the true a.s. (when is convex) only on compacts in the interior of support of the convex hull of the design points, and does not consider the boundary points.
As a remedy to this possible over-fitting we can consider solving the least squares problem over the class of convex functions that are uniformly Lipschitz. For a convex function , let us denote by the sub-differential (set of all sub-gradients) set at , and by the supremum norm of vectors in .
For , consider the class of convex functions with Lipschitz norm bounded by , i.e.,
| (22) |
The resulting optimization problem can now be expressed as (compare with (21)):
Let and denote the projections of onto and , the set of all evaluations (at the data points) of functions in and , respectively. We will use the modified test-statistic
Note that in defining all we have done is to use and instead of and as in our original test-statistic . In the following we show that (16) holds for . The proof of the result can be found in Section A.4.
Theorem 4.9.
Consider data from the regression model , for , where we now assume that (i) ; (ii) for some ; (iii) ’s are fixed constants; and (iv) ’s are i.i.d. sub-gaussian errors. Given data from such a model, and letting , we can show that for any ,
| (23) |
Remark 4.10.
At a technical level, the above result holds because the class of all convex functions that are uniformly bounded and uniformly Lipschitz is totally bounded (under the metric) whereas the class of all convex functions is not totally bounded.
The next result shows that the power of the test based on indeed converges to , as grows. The proof follows using a similar argument as in the proof of Theorem 4.2.
Theorem 4.11.
Consider the setup of Theorem 4.9. Moreover, if the design distribution (of the ’s) converges to a probability measure on such that is not an affine function a.e. , then for some constant . Hence the power of the test based on converges to 1, as , for any significance level .
Remark 4.12.
Remark 4.13.
The assumption that can be extended to any compact subset of .
5 Extensions
5.1 Weighted regression
If is mean zero Gaussian with covariance matrix , for a known positive definite , we can readily transform the problem to the i.i.d. case. If is the Cholesky decomposition of , pre-multiply the model equation through by to get , where are i.i.d. mean zero Gaussian errors with variance . Then, minimize over , where is defined by . A basis for the null space is obtained by premultiplying a basis for by , and generators for are obtained by premultiplying the generators of by . The test may be performed within the transformed model. If the distribution of the error is non-Gaussian we can still standardize as above, and perform our test after making appropriate modifications while simulating the null distribution.
This is useful for correlated errors with known correlation function, or when the observations are weighted. Furthermore, we can relax the assumption that the values are distinct, for if the values of are not distinct, the values may be averaged over each distinct , and the test can be performed on the averages using the number of terms in the average as weights.
5.2 Linear versus partially linear models
We now consider testing against a parametric regression function, with parametrically modeled covariates. The model is
| (24) |
where is a -dimensional parameter vector, is the -dimensional covariate, and interest is in testing against a parametric form of , such as constant or linear, or more generally where is the largest linear space in a convex cone , for which (A1) and (A2) hold. For example, can be used to test for the significance of the predictor, while controlling for the effects of covariates . If , the null hypothesis is that the expected value of the response is linear in , for any fixed values of the covariates.
Accounting for covariates is important for two reasons. First, if the covariates explain some of the variation in the response, then the power of the test is higher when the variation is modeled. Second, if the covariates are related to the predictor, confounding can occur if the covariates are missing from the model.
The assumption that the values are distinct is no longer practical; without covariates we could assume distinct values without loss of generality, because we could average the values at the distinct and perform a weighted regression. However, we could have duplicate values that have different covariate values. Therefore, we need equality constraints as well as inequality constraints, to ensure that when . An appropriate cone can be defined as , where is the largest linear space in .
For identifiability considerations, we assume that the columns of and together form a linearly independent set, where is the design matrix whose rows are . Let , where is the column space of . Define , for , where is the projection matrix for the linear space and are the generators of . We may now define the cone as generated by . Similarly, the generators of are .
Define . Then is the appropriate null hypothesis and the alternative hypothesis is , where and . Then is the largest linear space contained in or in , and it is straight-forward to verify that if , we also have . Therefore the conditions (A1) and (A2) hold for the model with covariates, whenever they hold for the cone without covariates.
5.3 Additive models
We consider an extension of (24), where
and the null hypothesis specifies parametric formulations for each , . Let , , and . The null hypothesis is , for , or where , and is the column space of the matrix whose rows are . Define closed convex cones , where is the largest linear space in . Then is a closed convex cone in , containing the linear space . The projection of the data onto the cone exists and is unique, and Meyer, 2013a gave necessary and sufficient conditions for identifiability of the components , and . When the identifiability conditions hold, then is the largest linear space in .
Define for , and . Then is a double cone, and we may test the null hypothesis versus using the test statistic (11). However, we may like to include in the alternative hypothesis the possibility that, say, and . Thus, for , we would like the alternative set to be the quadruple cone defined as the union of four cones: , , , and . Then is the cone opposite to , and is the cone opposite to , and the largest linear space contained in any of these cones is . For arbitrary , the multiple cone alternative has components; call these . The proposed test involves projecting onto each of the combinations of cones, and
using the smallest sum of squared residuals in . The distribution of the test statistic is again invariant to scale and translations in , so for known error distribution , the null distribution may be simulated to the desired precision.
This provides another option for testing against the linear model, that is different from the fully convex/concave alternative of Example 3, but requires the additional assumption of additivity. It also provides tests for more specific alternatives: for example, suppose that the null hypothesis is , where is an indicator variable. If we can assume that the effects are additive, then we can use the cone of convex functions and the cone of functions with positive third derivative as outlined in Example 2 of the Introduction. If the additivity assumptions are correct, this quadruple cone alternative might provide better power than the more general, fully convex/concave alternative.
5.4 Testing against a constant function
The traditional -test for the parametric least-squares regression model has the null hypothesis that none of the predictors is (linearly) related to the response. For an full-rank design matrix, the statistic has null distribution . To test against the constant function when the relationship of the response with the predictors is unspecified, we can turn to our cone alternatives.
Consider model (3) where the predictor values are , . A cone that contains the one-dimensional null space of all constant vectors is defined for multiple isotonic regression using a partial order on . That is, if holds coordinate-wise. Two points and in are comparable if either or . Partial orders are reflexive, anti-symmetric, and transitive, but differ from complete orders in that pairs of points are not required to be comparable. The regression function is isotonic with respect to on if whenever , and is anti-tonic if whenever .
In Section A.3 we show that assumptions (A1) and (A2) hold for the double cone of isotonic and anti-tonic functions. However, the double cone for multiple isotonic regression is unsatisfactory because if one of the predictors reverses sign, the value of the statistic (11) (for testing against a constant function) also changes. For two predictors, it is more appropriate to define a quadruple cone, considering pairs of increasing/decreasing relationships in the partial order. For three predictors we need an octuple cone, which is comprised of four double-cones. See Section A.3 for more details and simulations results.
6 Simulation studies
In this section we investigate the finite-sample performance of the proposed procedure based on , as defined in (11), for testing the goodness-of-fit of parametric regression models. We consider the case of a single predictor, the test against a linear regression function with multiple predictors, and the test of linear versus partial linear model, comparing our procedure with competing methods. In all the simulation settings we assume that the errors are Gaussian. Overall our procedure performs well; although for some scenarios there are other methods that are somewhat better, none of the other methods has the same consistent good performance. Our procedure, being an exact test, always gives the desired level of significance, whereas other methods have inflated test size in some scenarios and are only approximate. Further, most of the other methods depend on tuning parameters for the alternative fit.
The goodness-of-fit of parametric regression models has received a lot of attention in the statistical literature. Stute et al., (1998) used the empirical process of the regressors marked by the residuals to construct various omnibus goodness-of-fit tests. Wild bootstrap approximations were used to find the cut-off of the test statistics. We denote the two variant test statistics – the Kolmogorov-Smirnov type and the Cramér-von Mises type – by and , respectively. We implement these methods using the “IntRegGOF” library in the R package.
Fan and Huang, (2001) proposed a lack-of-fit test based on Fourier transforms; also see Christensen and Sun, (2010) for a very similar method. The main drawback of this approach is that the method needs a reliable estimator of to compute the test-statistic, and it can be very difficult to obtain such an estimator under model mis-specification. We present the power study of the adaptive Neyman test (; see equation (2.1) of Fan and Huang, (2001)) using the known (as a gold standard) and an estimated . We denote this method by .
Peña and Slate, (2006) proposed an easy-to-implement single global procedure for testing the various assumptions of a linear model. The test can be viewed as a Neyman smooth test and relies only on the standardized residual vector. We implemented the procedure using the “gvlma” library in the R package and denote it by .
6.1 Examples with a one-dimensional predictor
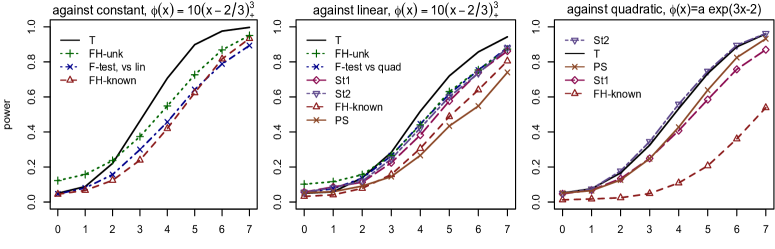
Proportions of rejections for 10,000 data sets simulated from , , are shown in Fig. 6.1. In the first plot, the power of the test against a constant function is shown when the true regression function is , where , and the effect size ranges from to . The alternative for our proposed test (labeled in the figures) is the increasing/decreasing double cone, and the power is compared with the -test with linear alternative, and the FH test with both known and estimated variance.
In the second plot, power of the test against a linear function is shown for the same “ramp” regression function . The alternative for the proposed test is the convex/concave double cone, and the power is compared with the -test with quadratic alternative, the FH test with known and estimated variance, and , and the PS test. As with the test against a constant function, ours has better power and the FH test with estimated variance has inflated test size.
Finally, we consider the null hypothesis that is quadratic, and the true regression function is . The double-cone alternative is as given in Example 2 of the Introduction. The test has slightly higher power than ours in this situation, and the PS test has power similar to the test. The FH test with known variance has a small test size compared to the target, and low power.
6.2 Testing against the linear model
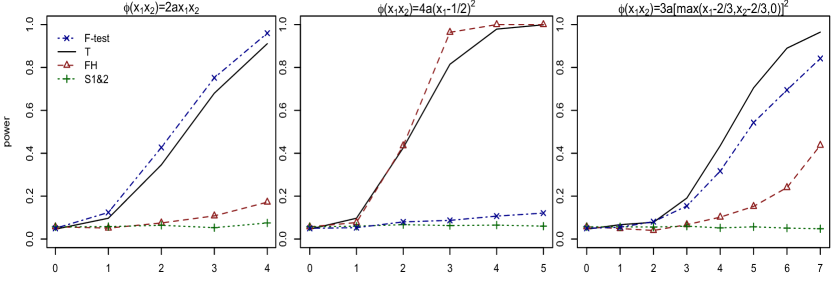
We consider two data generating models. Model 1 is adapted from Stute et al., (1998) (see Model 3 of their paper) and can be expressed as , with covariate , where are i.i.d. Uniform, and is drawn from a normal distribution with mean 0. Stute et al., (1998) used in their simulations but we use . Model 2 is adapted from Fan and Huang, (2001) (see Example 4 of their paper) and can be written as , where is the covariate vector. The covariates are normally distributed with mean 0 and variance 1 and pairwise correlation 0.5. The predictor is binary with probability of “success” 0.4 and independent of and . Random samples of size , are drawn from Model 1 (and also from Model 2) and a multiple linear regression model is fitted to the samples, without the interaction term ( term). Thus, the null hypothesis holds if and only if . In all the following -value calculations, whenever required, we use 1000 bootstrap samples to estimate the critical values of the tests. For models 1 and 2 we implement the fully convex/concave double-cone alternative and denote the method by . For model 2 we also implement the octuple cone alternative under the assumption that the effects are additive, and treating as a parametrically modeled covariate (as described in Section 5.3). We denote this method by .
We also implement the generalized likelihood ratio test of Fan and Jiang, (2007); see equation (4.24) of their paper (also see Fan and Jiang, (2005)). The test computes a likelihood ratio statistic, assuming normal errors, obtained from the parametric and nonparametric fits. We denote this method by . As the procedure involves fitting a smooth nonparametric model, it involves the delicate choice of smoothing bandwidth(s). We use the “np” library in the R package to compute the nonparametric kernel estimator with the optimal bandwidth being chosen by the “npregbw” function in that package. This procedure is similar in spirit to that used in Härdle and Mammen, (1993). To compute the critical value of the test we use the wild bootstrap method.
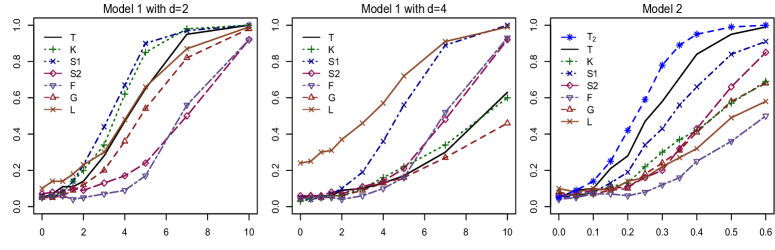
We also compare our method with the recently proposed goodness-of-fit test of a linear model by Sen and Sen, (2013). Their procedure assumes the independence of the error and the predictors in the model and tests for the independence of the residual (obtained from the fitted linear model) and the predictors. The critical value of the test is computed using a bootstrap approach. We denote this method by .
From Fig. 6.2 it is clear that our procedure overall has good finite sample performance compared to the competing methods. Note that as increasing, the power of our test monotonically increases in all problems. As expected, and behave poorly as the dimension of the covariate increases. The method is anti-conservative and hence shows higher power in some scenarios. It is also computationally intensive, especially for higher dimensional covariates. For model 2, both the fully convex/concave and the octuple-cone additive alternative perform quite well compared to the other methods.
6.3 Linear versus partial linear model
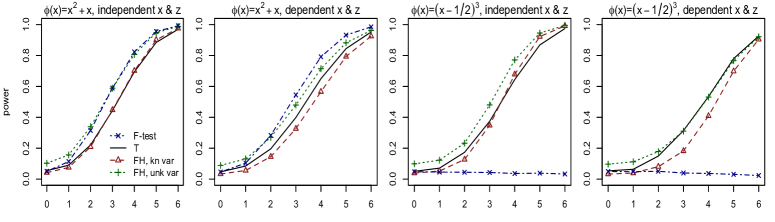
We compare the power of the test for linear versus partial linear model (24), with is affine, including a categorical covariate with three levels. The values are equally spaced in . We compare our test with the convex/concave alternative to the standard -test using quadratic alternative, and the test for linear versus partial linear from Fan and Huang, (2001), Section 2.4 (labeled FH). Two versions of the FH test are used; the first version uses an estimate of the model variance and the second assumes the variance is known.
The first two plots in Fig. 6.3 show power for when the true function is , and the target test size is . In the first plot, the values of the covariate are generated independently of , and for the second, the predictors are related, so that the categorical covariate is more likely to have level=1 when is small, and is more likely to have level=3 when is large. Here the -test is the gold standard, because the true model satisfies all the assumptions. The proposed test performs similarly to the FH test with known variance; for the unknown variance case the power for the FH test is larger but the test size is inflated.
In the third and fourth plots, the regression function is . The -test is not able to reject the null hypothesis because the alternative is incorrect, but the true function is also not contained in the double-cone (convex/concave) of the proposed method. However, the proposed test still compares well with the FH test, especially when the predictors are correlated.
6.4 Testing against constant function, with covariates
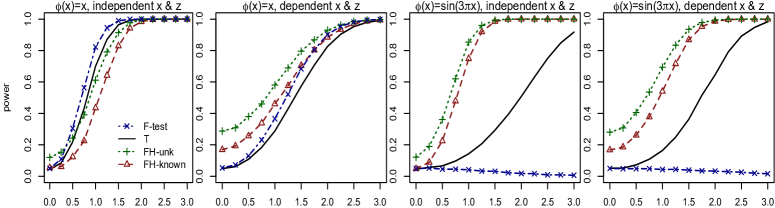
Testing the significance of a predictor while controlling for covariate effects can be accomplished using the partial linear model (24), with , for some unknown , using the double cone alternative for monotone . Our method is compared with the standard -test with linear alternative and the FH test, both with known and unknown variance as in the previous subsection. The first two plots of Fig. 6.4 display power for 10,000 simulated data sets from , for values equally spaced in , with ranging from 0 to 3. The power of the proposed test is close to the gold-standard -test, and the FH with unknown variance again has inflated test size. When the predictors are related, the FH test has unacceptably large test size.
In the third and fourth plots, data were simulated using , with ranging from 0 to 1.5. The true is not in the alternative set for either the -test or the proposed test; however the proposed test can reject the null consistently for higher values of . In this scenario, the size of FH test with known variance is inflated for correlated predictors..
6.5 Real data analysis
Data example 1: We study the well-known Boston housing dataset collected by Harrison Jr and Rubinfeld, (1978) to study the effect of air pollution on real estate price in the greater Boston area in the 1970s. The data consist of 506 observations on 16 variables, with each observation pertaining to one census tract. We use the version of the data that incorporates the minor corrections found by Gilley and Pace, (1996). Our procedure, assuming normal errors, yields a -value of essentially 0 and rejects the linear model specification, as used in Harrison Jr and Rubinfeld, (1978), while the method of Stute et al., (1998) yields a -value of more than 0.2. The method of Sen and Sen, (2013) also yields a highly significant -value.
Data example 2: We consider the Rubber data set, found in the R package MASS, representing “accelerated testing of tyre rubber”. The response variable is the abrasion loss in gm/hr, with two predictors of loss: the hardness in Shore units, and the tensile strength in kg/sq m.
A linear regression (fitting a plane to the data) provides and the usual residual plots do not provide evidence against linearity. Further, the Stute tests provide -values of .39 and .18, respectively, and the Peña and Slate test against the linear model provides . The quadruple cone alternative of Section 5.3 provides , although the fully convex/concave double cone alternative does not reject at . Some insight into the true function can be found by fitting the constrained additive model, using the reasonable assumption that the expected response is decreasing in both predictors. The fit is roughly linear in “hardness” but is more like a sigmoidal or step function in “tensile strength”; these components are shown in Fig. 6.5. Although neither fit is convex or concave, the quadruple cone method can still detect the departure from linearity.

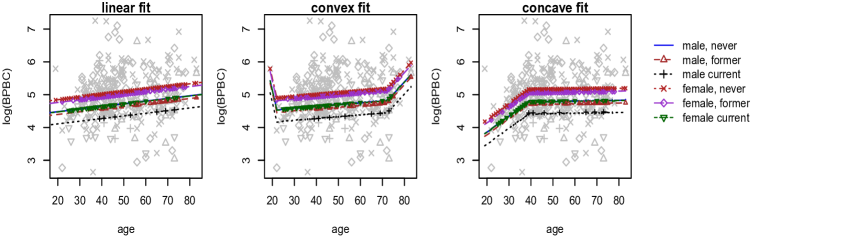
Data example 3: To demonstrate the partial linear test, we use data from a study of predictors of blood plasma levels of the micronutrient beta carotene, in healthy subjects, as discussed by Nierenberg et al., (1989). Smoking status (current, former, never) and sex are categorical predictors whose effects on the response (log of blood plasma beta carotene) are determined to be significant at . If interest is in determining the effect of age of the subject, a linear relationship might be assumed; this fit is shown in the first plot of Fig. 6.6, where the six lines correspond to the smoking/sex combinations. The covariates must be included in the model because they are related to both the response and the predictor of interest. To test whether the linear fit is appropriate, we use our test for linear versus partial linear model, which returns a -value of . The convex and concave fits have similar sums of squared residuals, with the concave fit having the smaller, so the concave fit represents the projection of the response vector onto the double cone. However, the fact that the convex fit is almost as close to the data implies that neither is correct; perhaps the true function is concave at the left and convex at the right.
7 Discussion
We have developed a test against a parametric regression function, where the alternative involves large-dimensional convex cones. The critical value of the test can be easily computed, via simulation, and the test is exact if we assume a known form of the error distribution. For a given parametric model, a very general alternative is guaranteed to have power tending to one as the sample size increases, under mild conditions. However, if additional a priori assumptions are available, these can be incorporated to boost the power in small to moderate-sized samples. For example, when testing against an additive linear function such as , we can use the “fully convex” model of Example 3, or if we feel confident that the additivity assumption is valid, we can use the octuple cone of Section 5.3. This power improvement was seen in model 2 simulations, in Fig. 6.2.
The authors have provided R and matlab routines for the general method and for the specific examples. In the R package DoubleCone, there are three functions. The first, doubconetest is the generic version; the user provides a constraint matrix that defines the cone for which the null space of the constraint matrix is and (A1) and (A2) hold. The function provides a -value for the test that the expected value of a vector is in the null space using the double-cone alternative. The function agconst performs a test of the null hypothesis that the expected value of y is constant versus the alternative that it is monotone (increasing or decreasing) in each of the predictors, using double, quadruple, or octuple cones. Finally, the function partlintest performs a test of a linear model versus a partial linear model, using a double-cone alternative. The user can test against a constant, linear, or quadratic function, while controlling for the effects of (optional) covariates. The matlab routine (http://www.stat.columbia.edu/bodhi/Bodhi/Publications.html) performs the test of Example 3.
Appendix A Appendix
A.1 Unbiasedness
We show that the power of the test for is at least as large as the test size. In the following we give the proof of Theorem 3.3 in the main paper.
Theorem A.1.
(Restatement of Theorem 3.3) Let , for , where the components of are i.i.d. . Suppose further that is a symmetric (around 0) distribution. Choose any , and let . Then for any ,
| (25) |
Without loss of generality, we assume that as the distribution of is invariant for any , by Lemma 3.1. To prove (25), define and . Then and have the same distribution as is a symmetric around 0, and . In particular,
Let be the event that . By symmetry , and for any ,
Let and define , , , and . Then and are equal in distribution, as are and .
Lemma A.2.
and .
Proof.
Using Lemma 2.1,
where the last equality uses . The inequality holds because , by (A2). The proof of is similar. ∎
Proof of Theorem A.1: Let , which is equal in distribution to . For any ,
Finally, we note that and , where is the sum of squared residuals of the projection of either or onto , because is orthogonal to . ∎
A.2 Some intuition under which the power goes to 1
The following result shows that if both projections and belong to then must itself lie in , if is a “large” cone. This motivates the fact that if , then both and cannot be very close to , and (18) might hold. The largeness of can be represented through the following condition. Suppose that any can be expressed as
| (26) |
for some and . This condition holds for where is irreducible, and is the null row space of . A constraint matrix is irreducible as defined by Meyer, (1999) if the constraints defined by the rows are in a sense non-redundant. Then bases for and together span , so any can be written as the sum of vectors in , , and simply by writing as a linear combination of these basis vectors, and gathering terms with negative coefficients to be included in the component.
Lemma A.3.
If (26) holds then if and only if and .
Proof.
Suppose that . Then and thus . Similarly, and . Hence, .
Suppose now that . By (8), for any ; this implies that for all , so . From (7) applied to and it follows that
for all and . As any can be expressed as for and , the above display yields for all . Taking and in the above display we get that for all , which implies that , thereby proving the result. ∎
A.3 Testing against a constant function
The traditional -test for the parametric least-squares regression model has the null hypothesis that none of the predictors is (linearly) related to the response. For an full-rank design matrix, the statistic has null distribution . To test against the constant function when the relationship of the response with the predictors is unspecified, we can turn to our cone alternatives.
Consider model (3) where is the unknown true regression function and is the set of predictor values. We can assume without loss of generality that there are no duplicate values; otherwise we average the response values at each distinct , and do weighted regression. Interest is in for some unknown scalar , against a general alternative. A cone that contains the one-dimensional null space is defined for multiple isotonic regression.
We start with some definitions. A partial ordering on may be defined as if holds coordinate-wise. Two points and in are comparable if either or . Partial orderings are reflexive, anti-symmetric, and transitive, but differ from complete orderings in that pairs of points are not required to be comparable. A function is isotonic with respect to the partial ordering if whenever . If is defined as , we can consider the set of such that whenever . The set is a convex cone in , and a constraint matrix can be found so that .
Assumption (A1) holds if is connected; i.e., for all proper subsets , each point in is comparable with at least one point not in . If is not connected, it can be broken down into smaller connected subsets, and the null space of consists of vectors that are constant over the subsets. We have the following lemma.
Lemma A.4.
The null space of the constraint matrix associated with isotonic regression on the set is spanned by the constant vectors if and only if the set is connected.
Proof.
Let be the constraint matrix associated with isotonic regression on the set such that there is a row for every comparable pair (i.e., before reducing). Let be the null space of (it is easy to see that the null space of the reduced constraint matrix is also ). First, suppose and for some . Let be the set of points that are comparable to , and let be the set of points that are comparable to . If is in the intersection, then there is row of where the -th element is and the -th element is (or vice-versa), as well as a row where the -th element is and the -th element is (or vice-versa), so that and . Therefore if , is empty and is not connected. Second, suppose is connected and . For any , , define and as above; then because of connectedness there must be an in the intersection, and hence . Thus only constant vectors are in . ∎
The classical isotonic regression with a partial ordering can be formulated using upper and lower sets. The set is an upper set with respect to if , , and imply that . Similarly, the set is a lower set with respect to if , , and imply that .
The following results can be found in Gebhardt, (1970), Barlow and Brunk, (1972), and Dykstra, (1981). Let and be the collections of upper and lower sets in , respectively. The isotonic regression estimator at has the closed form
where is the average of all the values for which the predictor values are in . Further, if , then for any upper set we have
| (27) |
Similarly, if is a lower set and , , as the complement of an upper set is a lower set and vice-versa. Finally, any can be written as a linear combination of indicator functions for upper sets, with non-negative coefficients, plus a constant vector.
We could define a double cone where for antitonic . To show the condition (A2) holds, we first show that if , then the projection of on is the origin; hence . Let be the “centered” indictor vector for an upper set . That is, if , if , and . Then , and for any by (27). For,
where is the number of elements in .
Similarly, for any . We can write any as a linear combination of centered upper set indicator vectors with non-negative coefficients, so that for any and . Then for any and ,
hence the projection of onto is the origin.
The double cone for multiple isotonic regression is unsatisfactory because if one of the predictors reverses sign, the value of the statistic (11) (for testing against a constant function) also changes. For two predictors, it is more appropriate to define a quadruple cone. Define:
-
•
: the cone defined by the partial ordering: if and ;
-
•
: the cone defined by the partial ordering: if and ;
-
•
: the cone defined by the partial ordering: if and ; and
-
•
: the cone defined by the partial ordering: if and .
The cones and form a double cone as do and . If connected, the one-dimensional space of constant vectors is the largest linear space in any of the four cones and (A1) is met.
Let be the projection of onto , and for , while . Define , for , and . The distribution of is invariant to translations in ; this can be proved using the same technique as Lemma 2.2. Therefore the null distribution can be simulated up to any desired precision for known . To show that the test is unbiased for in the quadruple cone , we note that condition (A2) becomes and , and vice-versa; the results of Section A.1 hold for the quadruple cone. For three predictors we need an octuple cone, which is comprised of four double-cones and similar results follow.
The results of Section 3.1 depend on the consistency of the multiple isotonic regression estimator. Although Hanson et al., (1973) proved point-wise and uniform consistency (on compacts in the interior of the support of the covariates) for the projection estimator in the bivariate case (also see Makowski, (1977)), result (16) for the general case of multiple isotonic regression is still an open problem.
A.3.1 Simulation study
We consider the test against a constant function using the quadruple cone alternative of Section A.3, and model , , where for each simulated data set, the values are generated uniformly in the unit square. The power is compared with the standard -test where the alternative model is , the FH test with known variance, and and . In the first plot of Figure A.1, power is shown when the true regression function is . Here the assumptions for the parametric -test are correct, so the -test has the highest power, although the power for the proposed test is only slightly smaller. In the second plot, the regression function is quadratic in , with vertex in the center of the design points. The -test fails to reject the constant model because of the non-linear alternative, but the true regression function is also far from the quadruple-cone alternative. However, the proposed test has power comparable to the FH test with known variance. In the final plot, the regression function is constant on , and increasing in both predictors beyond 2/3. The proposed test has the best power compared with the alternatives. The and tests do not perform well for the test against a constant function in two dimensions, compared with other testing situations.
A.4 Proofs of Lemmas and Theorems
Proof of Theorem 3.2 To study the distribution of and relate it to that of , we consider the following quantile coupling: Let be a sequence of i.i.d. Uniform(0,1) random variables. Define and let , for ; . Observe that and the conditional distribution of , given the data, is . For notational simplicity, for the rest of the proof, we will denote by and by . Note that,
| (28) | |||||
where we have used the fact that the projection operator is 1-Lipschitz. To simplify notation, let , and . Also, let , and . Thus, using a similar argument as in (28) we obtain,
Therefore,
| (29) | |||||
as . For two probability measure and on , let denote the -Wasserstein distance between and , i.e.,
where the infimum is taken over all joint distributions with marginals . Now,
| (30) |
where the last equality follows from Shorack and Wellner, (1986, Theorem 2, page 64). Further, by Shorack and Wellner, (1986, Theorem 1, page 63), and two conditions on stated in the theorem, it follows that a.s. Therefore,
where we have used (29) and (30), is uniformly bounded, and the fact that a.s. The result now follows from the fact that ; see Huber, (1981, pages 31–33).
∎
Proof of Lemma 3.4: Let . Then . Let , and note that . If is the projection of onto , then
| (31) |
The first follows from assumption (16) and the latter holds because
as , where we have used the characterization of projection on a closed convex cone (7). Starting with
we rearrange to get
| (32) | |||||
As and , we have
Also, . Thus, (32) equals
The first four terms in the above expression are positive (with their signs), and the last is by (31). Therefore,
which when combined with (31) gives the desired result. The proof of the other part is completely analogous.
∎
Proof of Theorem 3.6: To show that (18) holds let us define the convex projection of with respect to the measure as
where the minimization is over all convex functions from to . The existence and uniqueness (a.s.) of follows from the fact that is a Hilbert space with the inner product , and the space of all convex functions in is a closed convex set in . Let of the space of all concave functions in . We can similarly define the non-increasing projection of .
Next we show that if is not affine a.e. then either is not affine a.e. or is not affine a.e. . Suppose not, i.e., suppose that and are both affine a.e. . Then by (8), for any affine . This implies that for all affine , so a.e., where is affine. Note that is indeed the projection of onto the space of all affine functions in . From (7) applied to and it follows that
for all and . As any that is twice continuously differentiable can be expressed as for and , the above display yields for all that is twice continuously differentiable. Taking and in the last inequality we get that for all that is twice continuously differentiable, which implies that a.e. , giving rise to a contradiction.
Proof of Theorem 4.1: Observe that . Letting , and noting that , where , we have
Now,
where we have used the facts that and (see Chatterjee et al., (2013); also see Meyer and Woodroofe, (2000) and Zhang, (2002)). A similar result can be obtained for to arrive at the conclusion .
∎
Proof of Theorem 4.2: We will verify (16) and (18) and apply Theorem 3.7 to obtain the desired result. First observe that (16) follows immediately from the results in Chatterjee et al., (2013); also see Zhang, (2002). To show that (18) holds let us define the non-decreasing projection of with respect to the measure as
where the minimization is over all non-decreasing functions. We can similarly define the non-increasing projection of .
As is not a constant a.e. , it can be shown by a very similar argument as in Lemma A.3 that either is not a constant a.e. or is not a constant a.e. (note that here we use the fact that a function of bounded variation on an interval can be expressed as the difference of two monotone functions). Without loss of generality let us assume that is not a constant a.e. . Therefore,
which proves (18), where .
∎
Proof of Theorem 4.9: The theorem follows from known metric entropy results on the class of uniformly bounded convex functions that are uniformly Lipschitz in conjunction with known results on consistency of least squares estimators; see Theorem 4.8 of Van de Geer, (2000). We give the details below.
The notion of covering numbers will be used in the sequel. For and a subset of functions, the -covering number of under the metric , denoted by , is defined as the smallest number of closed balls of radius whose union contains .
Fix any and . Recall the definition of the class , given in (22). We define the class of uniformly bounded convex functions that are uniformly Lipschitz as
Using Theorem 3.2 of Guntuboyina and Sen, (2013) (also see Bronshtein, (1976)) we know that
| (33) |
for all , where is a fixed constant and is the supremum norm. In the following we denote by and the convex sets (in ) of all evaluations (at the data points) of functions in and , respectively; cf. (6). Thus, we can say that is the projection of on . Let denote the projection of onto . We now use Theorem 4.8 of Van de Geer, (2000) to show that
| (34) |
Note that equation (4.26) in Van de Geer, (2000) is trivially satisfied as we have sub-gaussian errors and equation (4.27) easily follows from (33).
Denote the -th coordinate of a vector by , for . Define the event . Next we show that there exists such that
| (35) |
As is a projection on the closed convex set , we have
Letting , note that for any , . Hence,
and thus i.e., . Now, for any ,
a.s. for large enough , where we have used the fact that , for some , and that a.s.
References
- Azzalini and Bowman, (1993) Azzalini, A. and Bowman, A. (1993). On the use of nonparametric regression for checking linear relationships. J. Roy. Statist. Soc. Ser. B, pages 549–557.
- Barlow and Brunk, (1972) Barlow, R. E. and Brunk, H. (1972). The isotonic regression problem and its dual. J. Amer. Statist. Assoc., 67(337):140–147.
- Bertsekas, (2003) Bertsekas, D. P. (2003). Convex analysis and optimization. Athena Scientific, Belmont, MA. With Angelia Nedić and Asuman E. Ozdaglar.
- Bronshtein, (1976) Bronshtein, E. M. (1976). -entropy of convex sets and functions. Siberian Mathematical Journal, 17:393–398.
- Chatterjee et al., (2013) Chatterjee, S., Guntuboyina, A., and Sen, B. (2013). Improved risk bounds in isotonic regression. arXiv preprint arXiv:1311.3765.
- Christensen and Sun, (2010) Christensen, R. and Sun, S. K. (2010). Alternative goodness-of-fit tests for linear models. J. Amer. Statist. Assoc., 105:291–301.
- Cox et al., (1988) Cox, D., Koh, E., Wahba, G., and Yandell, B. (1988). Testing the (parametric) null model hypothesis in (semiparametric) partial and generalized spline models. Ann. Statist., 16:113–119.
- Dykstra, (1981) Dykstra, R. L. (1981). An isotonic regression algorithm. Journal of Statistical Planning and Inference, 5:355–363.
- Eubank and Spiegelman, (1990) Eubank, R. and Spiegelman, C. (1990). Testing the goodness of fit of a linear model via nonparametric regression techniques. J. Amer. Statist. Assoc., 85(410):387–392.
- Fan and Huang, (2001) Fan, J. and Huang, L. (2001). Goodness-of-fit tests for parametric regression models. J. Amer. Statist. Assoc., 96:640–652.
- Fan and Jiang, (2005) Fan, J. and Jiang, J. (2005). Nonparametric inferences for additive models. J. Amer. Statist. Assoc., 100(471):890–907.
- Fan and Jiang, (2007) Fan, J. and Jiang, J. (2007). Nonparametric inference with generalized likelihood ratio tests. TEST, 16(3):409–444.
- Gebhardt, (1970) Gebhardt, F. (1970). An algorithm for monotone regression with one or more inde- pendent variables. Biometrika, 57(2):263–271.
- Gilley and Pace, (1996) Gilley, O. W. and Pace, R. K. (1996). On the harrison and rubinfeld data. Journal of Environmental Economics and Management, 31(3):403–405.
- Guerre and Lavergne, (2005) Guerre, E. and Lavergne, P. (2005). Data-driven rate-optimal specification testing in regression models. Ann. Statist., 33(2):840–870.
- Guntuboyina and Sen, (2013) Guntuboyina, A. and Sen, B. (2013). Global risk bounds and adaptation in univariate convex regression. arXiv preprint arXiv:1305.1648.
- Hanson et al., (1973) Hanson, D. L., Pledger, G., and Wright, F. (1973). On consistency in monotonic regression. Ann. Statist., 1:401–421.
- Hardle and Mammen, (1993) Hardle, W. and Mammen, E. (1993). Comparing nonparametric versus parametric regression fits. Ann. Statist., 21:1926–1947.
- Härdle and Mammen, (1993) Härdle, W. and Mammen, E. (1993). Comparing nonparametric versus parametric regression fits. Ann. Statist., 21(4):1926–1947.
- Harrison Jr and Rubinfeld, (1978) Harrison Jr, D. and Rubinfeld, D. L. (1978). Hedonic housing prices and the demand for clean air. Journal of environmental economics and management, 5(1):81–102.
- Huber, (1981) Huber, P. J. (1981). Robust statistics. John Wiley & Sons, Inc., New York. Wiley Series in Probability and Mathematical Statistics.
- Kuosmanen, (2008) Kuosmanen, T. (2008). Representation theorem for convex nonparametric least squares. Econometrics J., 11(2):308–325.
- Lim and Glynn, (2012) Lim, E. and Glynn, P. W. (2012). Consistency of multidimensional convex regression. Oper. Res., 60(1):196–208.
- Makowski, (1977) Makowski, G. G. (1977). Consistency of an estimator of doubly nondecreasing regression functions. Zeitschrift fur Wahrscheinlichkeitstheorie, 39:263–268.
- Meyer and Woodroofe, (2000) Meyer, M. and Woodroofe, M. (2000). On the degrees of freedom in shape-restricted regression. Ann. Statist., 28(4):1083–1104.
- Meyer, (1999) Meyer, M. C. (1999). An extension of the mixed primal-dual bases algorithm to the case of more constraints than dimensions. Journal of Statistical Planning and Inference, 81:13–31.
- (27) Meyer, M. C. (2013a). Semi-parametric additive constrained regression. Journal of Nonparametric Statistics, 25(3):715–743.
- (28) Meyer, M. C. (2013b). A simple new algorithm for quadratic programming with applications in statistics. Communications in Statistics, 42(5):1126–1139.
- Neumeyer and Van Keilegom, (2010) Neumeyer, N. and Van Keilegom, I. (2010). Estimating the error distribution in nonparametric multiple regression with applications to model testing. J. Multivariate Anal., 101(5):1067–1078.
- Nierenberg et al., (1989) Nierenberg, D., Stukel, T., Baron, J., Dain, B., and Greenberg, E. (1989). Determinants of plasma levels of beta-carotene and retinol. American Journal of Epidemiology, 130:511–521.
- Peña and Slate, (2006) Peña, E. A. and Slate, E. H. (2006). Global validation of linear model assumptions. J. Amer. Statist. Assoc., 101(473):341–354.
- Raubertas et al., (1986) Raubertas, R. F., Lee, C.-I. C., and Nordheim, E. V. (1986). Hypothesis tests for normals means constrained by linear inequalities. Communications in Statistics – Theory and Methods, 15(9):2809–2833.
- Robertson et al., (1988) Robertson, T., Wright, F., and Dykstra, R. (1988). Order Restricted Statistical Inference. John Wiley & Sons, New York.
- Seijo and Sen, (2011) Seijo, E. and Sen, B. (2011). Nonparametric least squares estimation of a multivariate convex regression function. Ann. Statist., 39(3):1633–1657.
- Sen and Sen, (2013) Sen, A. and Sen, B. (2013). On testing independence and goodness-of-fit in linear models. arXiv preprint arXiv:1302.5831.
- Shorack and Wellner, (1986) Shorack, G. R. and Wellner, J. A. (1986). Empirical processes with applications to statistics. Wiley Series in Probability and Mathematical Statistics: Probability and Mathematical Statistics. John Wiley & Sons, Inc., New York.
- Silvapulle and Sen, (2005) Silvapulle, M. J. and Sen, P. (2005). Constrained Statistical Inference. John Wiley & Sons.
- Stute, (1997) Stute, W. (1997). Nonparametric model checks for regression. Ann. Statist., pages 613–641.
- Stute et al., (1998) Stute, W., Manteiga, W., and Quindimil, M. (1998). Bootstrap approximations in model checks for regression. J. Amer. Statist. Assoc., 93(441):141–149.
- Van de Geer, (2000) Van de Geer, S. (2000). Applications of Empirical Process Theory. Cambridge University Press.
- Zhang, (2002) Zhang, C.-H. (2002). Risk bounds in isotonic regression. Ann. Statist., 30(2):528–555.