Y. SuwaFrom supernovae to neutron stars
supernovae: general — hydrodynamics — neutrinos — instabilities
From supernovae to neutron stars
Abstract
The gravitational collapse, bounce, the explosion of an iron core of an 11.2 star is simulated by two-dimensional neutrino-radiation hydrodynamic code. The explosion is driven by the neutrino heating aided by multi-dimensional hydrodynamic effects such as the convection. Following the explosion phase, we continue the simulation focusing on the thermal evolution of the protoneutron star up to 70 s when the crust of the neutron star is formed using one-dimensional simulation. We find that the crust forms at high-density region ( g cm-3) and it would proceed from inside to outside. This is the first self-consistent simulation that successfully follows from the collapse phase to the protoneutron star cooling phase based on the multi-dimensional hydrodynamic simulation.
1 Introduction
Core-collapse supernovae are transitions of massive stellar cores into neutron stars (hereafter NSs). These phenomena are significantly dynamical events, since the central density increases by (from g cm-3 to g cm-3) and the radius decreases by 100 (from 1000 km to 10 km) within only second.
A NS can be divided into two components; the (superfluid) core and the crust. In the crust, Coulomb forces dominate the thermal fluctuation and nuclei crystallize into a periodic (body centered cubic) lattice structure that minimizes the Coulomb energy. The presence of the crust implies typical aspects of NSs. For example, the cooling curve of old pulsars is characterized by the heat conductivity in the crust (see [Yakovlev & Pethick (2004)] for review and references therein), and the giant flares of soft-gamma ray repeaters are conjectured to originate from the sudden release of the magnetic field energy, which is stored below the crust and breaks the crust when the magnetic stress overwhelms the crustal stress (Thompson & Duncan, 2001). Also the relationship with the pulsar glitches (Ruderman et al., 1998) and the gravitational waves from mountains on the crust (Horowitz & Kadau, 2009) are discussed. The crust, however, does not exist just after the supernova explosion sets in. At first, the neutron star is very hot (the temperature K) so that it entirely behaves as fluid (so-called “protoneutron star”; PNS). As the PNS cools down by neutrino emission and at some point the thermal energy becomes comparable to the Coulomb energy, nuclei form a lattice structure, which corresponds to the crust formation.
Recently, by grace of the growing computer resources and development of the numerical scheme, we have several numerical studies that performed multi-dimensional (multi-D) hydrodynamic simulations with neutrino radiative transfer and succeeded to make the shock expansion up to outside the iron core (e.g., Buras et al. (2006); Burrows et al. (2006); Marek & Janka (2009); Suwa et al. (2010); Takiwaki et al. (2012); Müller et al. (2012); Bruenn et al. (2013)). The shock expansion was obtained by the multi-D effects that amplify the neutrino heating rate such as the convection and standing accretion shock instability (SASI), even though state-of-the-art one-dimensional (1D) simulations failed to produce the explosion (Rampp & Janka, 2000; Liebendörfer et al., 2001; Thompson et al., 2003; Sumiyoshi et al., 2005). By these facts, we are now standing at the position to be able to carry on the numerical simulation of a NS crust formation, which can be called as the true NS formation, by using self-consistent exploding models.
In this letter, we report the simulation result from the onset of an iron core collapse to the formation of neutron star crust. Though the explosion mechanism of supernovae is still under the thick veil, in this letter we rely on the standard scenario, i.e., the delayed explosion scenario, in which the neutrino heating is crucial and the neutrino transfer equation should be solved in order to estimate the neutrino-heating rate. In previous studies, Burrows & Lattimer (1986) investigated long-term evolution of Kelvin-Helmholtz cooling phase of the PNS starting from a handmade initial condition, which imitates the hydrodynamical profiles after the bounce (see also Pons et al. (1999) for a recent study). More recently, Fischer et al. (2010) and Fischer et al. (2012) performed simulations with fully-general-relativistic radiation-hydrodynamic code up to 10 seconds. Since their code is 1D and no self-consistent explosion of an iron core can be reproduced, they artificially amplified the charged current reaction rate in order to produce explosion (one exemption is an progenitor, which, however, has an O-Ne-Mg core, not an iron core). Therefore, this letter represents the first study using the self-consistent neutrino-radiation hydrodynamic simulation in multi-D, which successfully follows the very long-term evolution of the massive stellar core; the core collapse of an iron core, the bounce and the shock formation at the nuclear density, the shock expansion, the neutrino-driven wind phase, and finally PNS cooling phase. In addition, this letter investigates when the crust forms inside the PNS, which is studied for the first time using core-collapse supernova simulation.
In this letter, §2 is devoted to the explanation of numerical methods. In §3, we give our results of simulation, focusing on the thermal evolution of PNS. We summarize our results and discuss their implications in §4.
2 Numerical Method
Numerical methods are basically the same as ones in our previous papers (Suwa et al., 2010, 2011, 2013). With the ZEUS-2D code (Stone & Norman, 1992) as a base for the solver of hydrodynamics, we employ an equation of state (EOS) of Shen et al. (1998), which is able to reproduce a NS of Demorest et al. (2010), and solve the spectral neutrino radiative transfer equation for and using isotropic diffusion source approximation (IDSA), which is well calibrated to reproduce the results of full Boltzmann solver (Liebendörfer et al., 2009). The weak interaction rates for neutrinos are calculated by using the formulation of Bruenn (1985). The simulations are performed on a grid of 300 logarithmically spaced radial zones up to 5000 km with the least grid width being 1 km at the center and 128 equidistant angular zones covering for two-dimensional (2D) simulation. As for the continuous 1D simulation, the same radial zoning is used and “one” angular grid is employed. In order to resolve the steep density gradient at the PNS surface and remove the outermost region with the density g cm-3, which is the lowest value of EOS table, we perform rezoning several times for later 1D run. At last, the radius of the minimum grid (and the least grid width) is 300 m and the maximum grid edge locates at 100 km from the center. The total mass of PNS is conserved over these rezoning within 0.1% error. For neutrino transport, we use 20 logarithmically spaced energy bins reaching from 3 to 300 MeV. As for the initial condition, we employ an 11.2 model from Woosley et al. (2002), with which several papers reported the successful explosion (Buras et al., 2006; Marek & Janka, 2009; Takiwaki et al., 2012; Suwa et al., 2013).
3 Results
The basic picture of core-collapse supernova is following (Bethe, 1990; Janka, 2012; Kotake et al., 2012); i) the collapse of an iron core driven by the energy loss due to the photodissociation of iron and the electron capture, ii) the neutron star formation and the bounce shock production, iii) the shock stall due to the neutrino cooling, iv) the shock revival by the neutrino heating, v) the neutrino-driven wind phase, and vi) the neutron star cooling phase. The previous hydrodynamic studies have focused only on early phases, mostly the shock revival process, which is shorter than s after the bounce (by phase iv; but see Fischer et al. (2010) for the phase v). The PNS cooling has much longer timescale s so that fully consistent simulation has not been done so far.
Here, we perform two-dimensional simulation of the collapse, bounce, and the onset of the explosion by the neutrino heating up to 690 ms after the bounce. The core bounce occurs 150 ms after the simulation starts with the central density of g cm-3. Soon after the bounce, the shock propagates outside the neutrinosphere, the convection sets in and the convective plumes hit the shock. In this simulation, the shock does not stall and the successful explosion occurs (see Suwa et al. (2013) for more details). After that all hydrodynamic quantities are averaged over the angle111This treatment does not produce any strange phenomenon to the PNS because the PNS is almost spherically symmetric for the case without the rotation. and the spherically symmetric simulation is followed up to 70 s when the crust formation condition is satisfied. Note that the whole simulation is performed using the “same” code so that there is no discontinuity between these 2D and 1D simulations. If we use the different codes to connect the different times and physical scales, there should occur some breaks of physical quantities (e.g., total mass, total momentum, and total energy). Therefore, the consistent simulation with the same code has advantage for the disappearance of these breaks.
In figure 1, the time evolution of selected mass coordinates is presented. The mass within contracts to a PNS and the outer part expands as an ejecta of the supernova. The shock (thick dotted line) propagates rapidly to outside the iron core driven by the neutrino heating aided by the convective fluid motion. The estimated diagnostic energy (Suwa et al., 2010) (so-called the explosion energy) determined by summing up the gravitationally unbound fluid elements in this model is erg so that the realistic explosion simulation is still not achieved. This is, however, one of successful explosion simulations. The term “successful” means that the simulation successfully reproduces the structure containing a remaining PNS and escaping ejecta. Previous exploding models obtained by Marek & Janka (2009) and Suwa et al. (2010) certainly acquired the expanding shock wave up to outside the iron core, but most of postshock materials were infalling so that the mass accretion onto PNS did not settle and the mass of the PNS continued to increase. Thus these simulations were not fully successful explosions. On the other hand, Suwa et al. (2013) and this work successfully reproduce the envelope ejection so that we can determine the “mass cut”, which gives the final mass of the compact object (i.e., NS or black hole). This is because the progenitor used in this study has a steep density gradient between iron core and silicon layer so that ram pressure of infalling material rapidly decreases when the shock passes the iron core surface. This is similar situation to the explosion simulation of an O-Ne-Mg core of an 8.8 progenitor reported by Kitaura et al. (2006), in which the neutrino driven explosion was obtained in “1D” simulation owing to very steep density gradient of this specific progenitor. Note that the progenitor in this study does not explode in spherical symmetry even though it has a steep density gradient. However, by the help of convection, this progenitor explodes in 2D simulation and the shock earns enough energy to blow away the outer layers.

In figure 2, we show hydrodynamic quantities (, , entropy , and electron fraction ) at several selected times, i.e., 10 ms, 1 s, 10 s, 30 s, and 67 s after the bounce. One can find by the density plot that the PNS shrinks due to neutrino cooling. Note that for the postbounce time s the central temperature increases because of the equidistribution of the thermal energy that can be found in the entropy plot, in which one finds that entropy at the center increases due to entropy flow from the outer part. For s, the PNS evolves almost isentropically and both the entropy and the temperature decrease due to the neutrino cooling. This can be called as the PNS cooling phase. One can find from plot that neutrinos take out the lepton number as well.
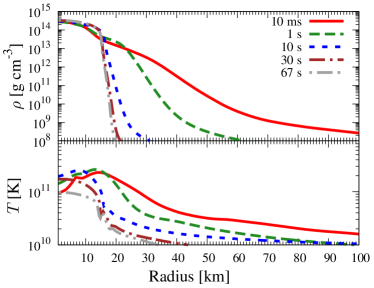
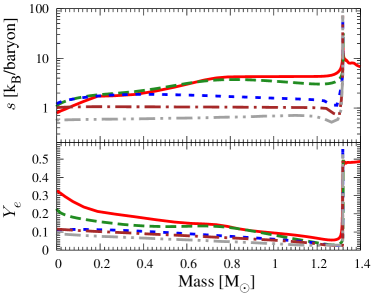
Figure 3 represents the time evolution in - plane. The line colors and types are the same as figure 2. In this plane, we show three black solid lines that indicate the criteria for the crust formation. The critical temperature of lattice structure formation is given by Shapiro & Teukolsky (1983), as
| (2) | |||||
where is the typical proton number of the component of the lattice, is the elementary charge, is a dimensionless factor describing the ratio between the thermal and Coulomb energies of lattice at the melting point, is the Boltzmann constant, is the mass fraction of heavy nuclei, and is the atomic mass unit, respectively. Critical lines are drawn using parameters of (see, e.g., Chamel & Haensel (2008)), , and . As for the proton number, we employ =26, 50, and 70 from bottom to top. Although the output for the typical proton number by the equation of state is between 30 and 35, there is an objection that the average proton number varies if we use the NSE composition. In Furusawa et al. (2011), they represented the mass fraction distribution in the neutron number and proton number plane and implied that even larger (higher proton number) nuclei can be formed in the thermodynamic quantities considered here. Therefore, we here parametrize the proton number and show the different critical lines depending on the typical species of nuclei. In addition, there are several improved studies about that suggest the larger value (e.g., Horowitz et al. (2007)), which leads to the lower critical temperature corresponding to later crust formation, although the value is still under debate.
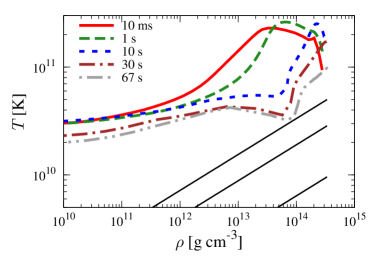
The critical lines imply that the lattice structure is formed at the point with the density of g cm-3 and on the postbounce time of s. Of course these values (especially the formation time) strongly depend on employed parameters, but the general trend would not change very much even if we include more sophisticated parameters.
4 Summary and discussion
In this letter, we performed a very long term simulation of the supernova explosion for an 11.2 star. This is the first simulation of an iron core starting from core collapse and finishing in the PNS cooling phase. We focused on the PNS cooling phase by continuing the neutrino-radiation-hydrodynamic simulation up to 70 s from the onset of the core collapse. By comparing the thermal energy and the Coulomb energy of the lattice, we finally found that the temperature decreases to K with the density g cm-3, which almost satisfies the critical condition for the formation of the lattice structure. Even though there are still several uncertainties for this criterion, this study could give us informative inspection for the crust formation of a NS. We found that the crust formation would start from the point with g cm-3 and it would precedes from inside to outside, because the Coulomb energy strongly depends on the mean interstice between components so that the higher density exhibits the earlier formation.
Next, we comment on our assumptions in this study. We performed 2D simulation for the explosion phase and following 1D simulation for the neutrino-driven wind phase and PNS cooling phase. It is well known that the convection and SASI activity are different between 2D and 3D in the explosion phase so that the 3D simulation should be performed (see Takiwaki et al. (2013),Couch (2013)). In addition, in the PNS cooling phase we observed the negative entropy gradient and negative lepton fraction gradient as functions of the radius, which indicate that these regions are convectively unstable so that in multi-D simulation the convective motion could change the evolution quantitatively. However, it is still too computationally expensive to perform 3D simulation with neutrino radiative transfer up to 70 s postbounce and we think that our findings in this work will not change in qualitative sense even when the 3D simulations for such a long term is available in the future. The possible direction in multi-D simulation for the crust formation is the following; the convective motion could transfer the heat from inside to outside more efficiently than the radiation so that the temperature at the surface of PNS should be higher compared to 1D run at the early time. However, for the late time, the neutrino luminosity could become smaller with convection than without convection (see, e.g., Roberts et al. (2012)). This means that the surface temperature decreases faster if we consider the convection, which could lead to the faster formation of the crust. In order to obtain the final answer of the convective effects for the crust formation, the long term evolution with multi-D hydrodynamic simulation is strongly required, which is beyond the scope of this letter and will be presented in forthcoming papers.
In addition to the dimensionality, we employed several simplification in this study, i.e., the specific nuclear equation of state (EOS) by Shen et al. (1998), the simplified neutrino interactions based on Bruenn (1985), the simplified neutrino transfer scheme by isotropic diffusion source approximation (IDSA; Liebendörfer et al. (2009)), and neglecting the general relativistic (GR) effects. These treatments would lead to quantitative difference of the crust formation time, so that more sophisticated simulations are necessary to obtain more realistic value. In the following, we briefly discuss the possible direction by improving these physics one by one. First, EOS affects the structure of PNS, especially its radius. Shen EOS, which is used in this study, predicts 15 km for a cold NS with 1.4 , which is relatively larger than the suggested value obtained by analysis of X-ray binaries (e.g., Steiner et al. (2010)). The different EOS, which exhibits a smaller NS radius, would result in the higher temperature of the crust formation and later formation of the crust. Secondly, weak interactions used in this study are based on Bruenn (1985), in which some interactions playing an important role at PNS cooling phase are missing, e.g., nucleon-nucleon bremsstrahlung. Therefore, our simulation could underestimate the cooling rate and overestimate the temperature. Due to this underestimation of the cooling, the shrinkage of the PNS is rather slow in this study (several seconds; see figures 1 and 2) compared to previous studies ( s, see, e.g., Fischer et al. (2010)). In addition, some missing interactions might cause the dip in - plane shown in figure 3. We can expect that more improved simulations including these interactions might lead to the earlier formation of the crust. Thirdly, IDSA is known to produce considerable error around the decoupling layer between the optically thick and thin regions (Berninger et al., 2012). This error comes from the simple description of IDSA, in which we naively decompose the distribution function of neutrinos into trapped part and free-streaming part (Liebendörfer et al., 2009). This treatment significantly simplify the transport equations for each limit and can make the neutrino-radiation hydrodynamic simulations computationally reasonable expense, so that we can perform such a long-term simulation using the Eulerian-grid based code. However, since this simplification exhibits error at the transition layer, which determines the boundary condition of diffusion equation for neutrinos and might change the thermal evolution even in the deep core, more sophisticated transport scheme is necessary to obtain more realistic time of the crust formation. Finally, GR effects, which are neglected in this study, may change the crust formation time because the stronger gravity exhibits a more compact NS. More compact PNSs have higher entropy, which moves points in upper-left direction slightly in - plane so that the GR effects are expected to delay the crust formation. At last, it should be noted that even though the current study is based on these simplifications expressed above, we believe that qualitative features obtained here will not change dramatically even if we include more sophisticated physics, i.e., the crust forms at 10–100 s after the PNS formation near the center and the crust-formation front propagates from inside to outside.
We thank the referee for providing constructive comments and help in improving the contents of this letter, and M. Liebendörfer, T. Muranushi, K. Sumiyoshi, M. Takano, and N. Yasutake for stimulating discussion. Numerical computations in this study were in part carried on XT4 and XC30 at CfCA in NAOJ and SR16000 at YITP in Kyoto University. This study was supported in part by the Grants-in-Aid for the Scientific Research from the Ministry of Education, Science and Culture of Japan (No. 23840023 and 25103511) and HPCI Strategic Program of Japanese MEXT.
References
- Berninger et al. (2012) Berninger, H., Frenod, E., Gander, M., et al. 2012, arXiv:1211.6901
- Bethe (1990) Bethe, H. A. 1990, Reviews of Modern Physics, 62, 801
- Bruenn (1985) Bruenn, S. W. 1985, ApJS, 58, 771
- Bruenn et al. (2013) Bruenn, S. W., et al. 2013, ApJ, 767, L6
- Buras et al. (2006) Buras, R., Janka, H., Rampp, M., & Kifonidis, K. 2006, A&A, 457, 281
- Burrows & Lattimer (1986) Burrows, A., & Lattimer, J. M. 1986, ApJ, 307, 178
- Burrows et al. (2006) Burrows, A., Livne, E., Dessart, L., Ott, C. D., & Murphy, J. 2006, ApJ, 640, 878
- Chamel & Haensel (2008) Chamel, N., & Haensel, P. 2008, Living Reviews in Relativity, 11, 10
- Couch (2013) Couch, S. M. 2013, ApJ, 775, 35
- Demorest et al. (2010) Demorest, P. B., Pennucci, T., Ransom, S. M., Roberts, M. S. E., & Hessels, J. W. T. 2010, Nature, 467, 1081
- Fischer et al. (2012) Fischer, T., Martínez-Pinedo, G., Hempel, M., & Liebendörfer, M. 2012, Phys. Rev. D, 85, 083003
- Fischer et al. (2010) Fischer, T., Whitehouse, S. C., Mezzacappa, A., Thielemann, F., & Liebendörfer, M. 2010, A&A, 517, A80
- Furusawa et al. (2011) Furusawa, S., Yamada, S., Sumiyoshi, K., & Suzuki, H. 2011, ApJ, 738, 178
- Horowitz et al. (2007) Horowitz, C. J., Berry, D. K., & Brown, E. F. 2007, Phys. Rev. E, 75, 066101
- Horowitz & Kadau (2009) Horowitz, C. J., & Kadau, K. 2009, Physical Review Letters, 102, 191102
- Janka (2012) Janka, H.-T. 2012, Annual Review of Nuclear and Particle Science, 62, 407
- Kitaura et al. (2006) Kitaura, F. S., Janka, H., & Hillebrandt, W. 2006, A&A, 450, 345
- Kotake et al. (2012) Kotake, K., Takiwaki, T., Suwa, Y., Iwakami Nakano, W., Kawagoe, S., Masada, Y., & Fujimoto, S.-i. 2012, Advances in Astronomy, 2012
- Lentz et al. (2012) Lentz, E. J., Mezzacappa, A., Bronson Messer, O. E., et al. 2012, ApJ, 747, 73
- Liebendörfer et al. (2001) Liebendörfer, M., Mezzacappa, A., Thielemann, F.-K., Messer, O. E., Hix, W. R., & Bruenn, S. W. 2001, Phys. Rev. D, 63, 103004
- Liebendörfer et al. (2009) Liebendörfer, M., Whitehouse, S. C., & Fischer, T. 2009, ApJ, 698, 1174
- Marek & Janka (2009) Marek, A., & Janka, H. 2009, ApJ, 694, 664
- Müller et al. (2012) Müller, B., Janka, H.-T., & Marek, A. 2012, ApJ, 756, 84
- Pons et al. (1999) Pons, J. A., Reddy, S., Prakash, M., Lattimer, J. M., & Miralles, J. A. 1999, ApJ, 513, 780
- Rampp & Janka (2000) Rampp, M., & Janka, H. 2000, ApJ, 539, L33
- Roberts et al. (2012) Roberts, L. F., Shen, G., Cirigliano, V., et al. 2012, Physical Review Letters, 108, 061103
- Ruderman et al. (1998) Ruderman, M., Zhu, T., & Chen, K. 1998, ApJ, 492, 267
- Shapiro & Teukolsky (1983) Shapiro, S. L., & Teukolsky, S. A. 1983, Black holes, white dwarfs, and neutron stars: The physics of compact objects (New York, Wiley-Interscience, 1983, 663 p.)
- Shen et al. (1998) Shen, H., Toki, H., Oyamatsu, K., & Sumiyoshi, K. 1998, Nucl. Phys., A637, 435
- Steiner et al. (2010) Steiner, A. W., Lattimer, J. M., & Brown, E. F. 2010, ApJ, 722, 33
- Stone & Norman (1992) Stone, J. M., & Norman, M. L. 1992, ApJS, 80, 753
- Sumiyoshi et al. (2005) Sumiyoshi, K., Yamada, S., Suzuki, H., Shen, H., Chiba, S., & Toki, H. 2005, ApJ, 629, 922
- Suwa et al. (2011) Suwa, Y., Kotake, K., Takiwaki, T., Liebendörfer, M., & Sato, K. 2011, ApJ, 738, 165
- Suwa et al. (2010) Suwa, Y., Kotake, K., Takiwaki, T., Whitehouse, S. C., Liebendörfer, M., & Sato, K. 2010, PASJ, 62, L49
- Suwa et al. (2013) Suwa, Y., Takiwaki, T., Kotake, K., Fischer, T., Liebendörfer, M., & Sato, K. 2013, ApJ, 764, 99
- Takiwaki et al. (2012) Takiwaki, T., Kotake, K., & Suwa, Y. 2012, ApJ, 749, 98
- Takiwaki et al. (2013) Takiwaki, T., Kotake, K., & Suwa, Y. 2013, arXiv:1308.5755
- Thompson & Duncan (2001) Thompson, C., & Duncan, R. C. 2001, ApJ, 561, 980
- Thompson et al. (2003) Thompson, T. A., Burrows, A., & Pinto, P. A. 2003, ApJ, 592, 434
- Woosley et al. (2002) Woosley, S. E., Heger, A., & Weaver, T. A. 2002, Reviews of Modern Physics, 74, 1015
- Yakovlev & Pethick (2004) Yakovlev, D. G., & Pethick, C. J. 2004, ARA&A, 42, 169