Disentangling a group of lensed submm galaxies at z2.9
Abstract
MS 0451.60305 is a rich galaxy cluster whose strong lensing is particularly prominent at submm wavelengths. We combine new SCUBA-2 data with imaging from Herschel SPIRE and PACS and HST in order to try to understand the nature of the sources being lensed. In the region of the “giant submm arc,” we uncover seven multiply imaged galaxies (up from the previously known three), of which six are found to be at a redshift of , and possibly constitute an interacting system. Using a novel forward-modelling approach, we are able to simultaneously deblend and fit SEDs to the individual galaxies that contribute to the giant submm arc, constraining their dust temperatures, far infrared luminosities and star formation rates. The submm arc first identified by SCUBA can now be seen to be composed of at least five distinct sources, four of these within the galaxy group at . The total unlensed luminosity for this galaxy group is , which gives an unlensed star formation rate of M⊙ yr-1. From the properties of this system, we see no evidence of evolution towards lower temperatures in the dust temperature versus far-infrared luminosity relation for high redshift galaxies.
keywords:
galaxies: clusters: individual – interactions – starburst – gravitational lensing: strong – methods: data analysis – submillimetre: galaxies1 Introduction
Gravitational lensing has been a useful tool for enabling submm studies. The first results from SCUBA (e.g. Smail et al., 1997) used “nature’s telescope” to increase the detection rate of high-redshift submm sources and effectively beat the confusion limit for single dish studies. Now Herschel (Pilbratt et al., 2010) has found that lensing is significant for some of the brightest submm sources, with surveys such as H-ATLAS and HerMES turning up a population of sources which are boosted enough that they can be studied in great detail in follow-up observations (e.g. Negrello et al., 2010; Wardlow et al., 2013). However, the limited resolution of Herschel, and of non-interferometric ground-based observatories such as the James Clerk Maxwell Telescope (JCMT), means that the effects of source blending are a cause of uncertainty in interpreting the results (e.g. Karim et al., 2013), made more difficult in practice, since submm-bright sources are known to be typically merging or interacting systems, where disentangling the contribution to the combined spectral energy distribution (SED) is more complicated still. Even worse – while lensing is nominally achromatic, strong lensing of inhomogeneous extended sources within finite beams is not achromatic, since unresolved regions with different spectral properties can be lensed by different amounts. Thus the existence of strong lensing can be a double-edged sword, boosting the brightness of some sources, but making the detailed interpretation of their spectral energy distributions (SEDs) problematic. Multi-wavelength studies are key to understanding these complex systems.
MS 0451.60305, a massive galaxy cluster at a redshift of 0.55, is lensing several background sources and has been imaged at many different wavelengths: X-ray (Donahue et al., 2003); optical (Gioia & Luppino, 1994; Moran et al., 2007; Kodama et al., 2005; Takata et al., 2003); near-IR (Borys et al., 2004; Wardlow et al., 2010); mid-IR (Geach et al., 2006); far-infrared (far-IR) (Oliver et al., 2012); mm/submm (Chapman et al., 2002; Borys et al., 2004; Wardlow et al., 2010); and radio (Reese et al., 2000; Berciano Alba et al., 2010). In the optical, the previously discovered multiply-imaged sources include an extended optical arc composed of a Lyman-break galaxy (LBG) with a spectroscopic redshift of , as well as two extremely red objects (EROs) with a redshift of , determined from lensing models (Borys et al., 2004; Berciano Alba et al., 2010). The two EROs and the LBG are so close in separation (10 kpc in projection) that they potentially constitute an interacting system. The steep number counts in the submm make lensing much more striking in this waveband than the optical – at 850 m SCUBA showed a “giant submm arc,” by far the brightest feature in this region of the sky, with an extent of around 1 arcminute, consistent with the blending of multiple galaxy images which lie near the critical line in the lensing model. If the optical galaxies are indeed interacting, the submm arc could be attributed to triggered star formation within one or more of these galaxies. This scenario is also supported by the radio data, as discussed in Berciano Alba et al. (2010).
New observations presented here using the Wide Field Camera 3 (WFC3) on HST, SCUBA-2 on the JCMT, and PACS and SPIRE on Herschel111Herschel is an ESA space observatory with science instruments provided by European-led Principal Investigator consortia and with important participation from NASA., shed new light on what is generating the submm arc. With the deeper HST images and a new Lenstool (Kneib et al., 1996; Jullo et al., 2007; Jullo & Kneib, 2009) lensing model, we have discovered seven multiply-imaged galaxies (including the LBG and two EROs) in the region of the submm arc. Six of these multiply-imaged galaxies are consistent with a redshift of and probably constitute an interacting galaxy group. To properly analyse the submm imaging of SCUBA-2 and Herschel, we have developed a new approach to disentangle the confused components generating the submm arc, which fully exploits the multiply-imaged and differentially-magnified nature of the system, and allows us to directly estimate both the dust temperature, , and the far-infrared luminosity, , (and thus star formation rate, SFR) for each of the contributing galaxies. This allows us to probe the verus relation for intrinsically less luminous galaxies at high- than traditional blank field surveys. Possible evolution of this relation with redshift allows us to probe the properties of star formation in the early Universe (e.g. Chapman et al., 2002, 2005; Pope et al., 2006; Kovács et al., 2006; Chapin et al., 2011; Symeonidis et al., 2013; Swinbank et al., 2014; Sklias et al., 2014, and Smail et al. in press). Our method significantly improves upon the conventional method of extracting sources, or smoothing and binning multi-wavelength data to the worst resolution, before fitting SEDs (a process that destroys useful information).
This paper is organised as follows. In § 2 we introduce the HST optical data and the lensing model. In § 3.1 we present the SCUBA-2 data and in § 3.2 the Herschel data. In § 4.1 we present the SED model and image reconstruction methods and in § 4.2 the model fitting procedure. § 5 discusses the results and § 6 finishes with the conclusions. Throughout we employ a CDM cosmology with , , and .
2 HST and the Lensing Model
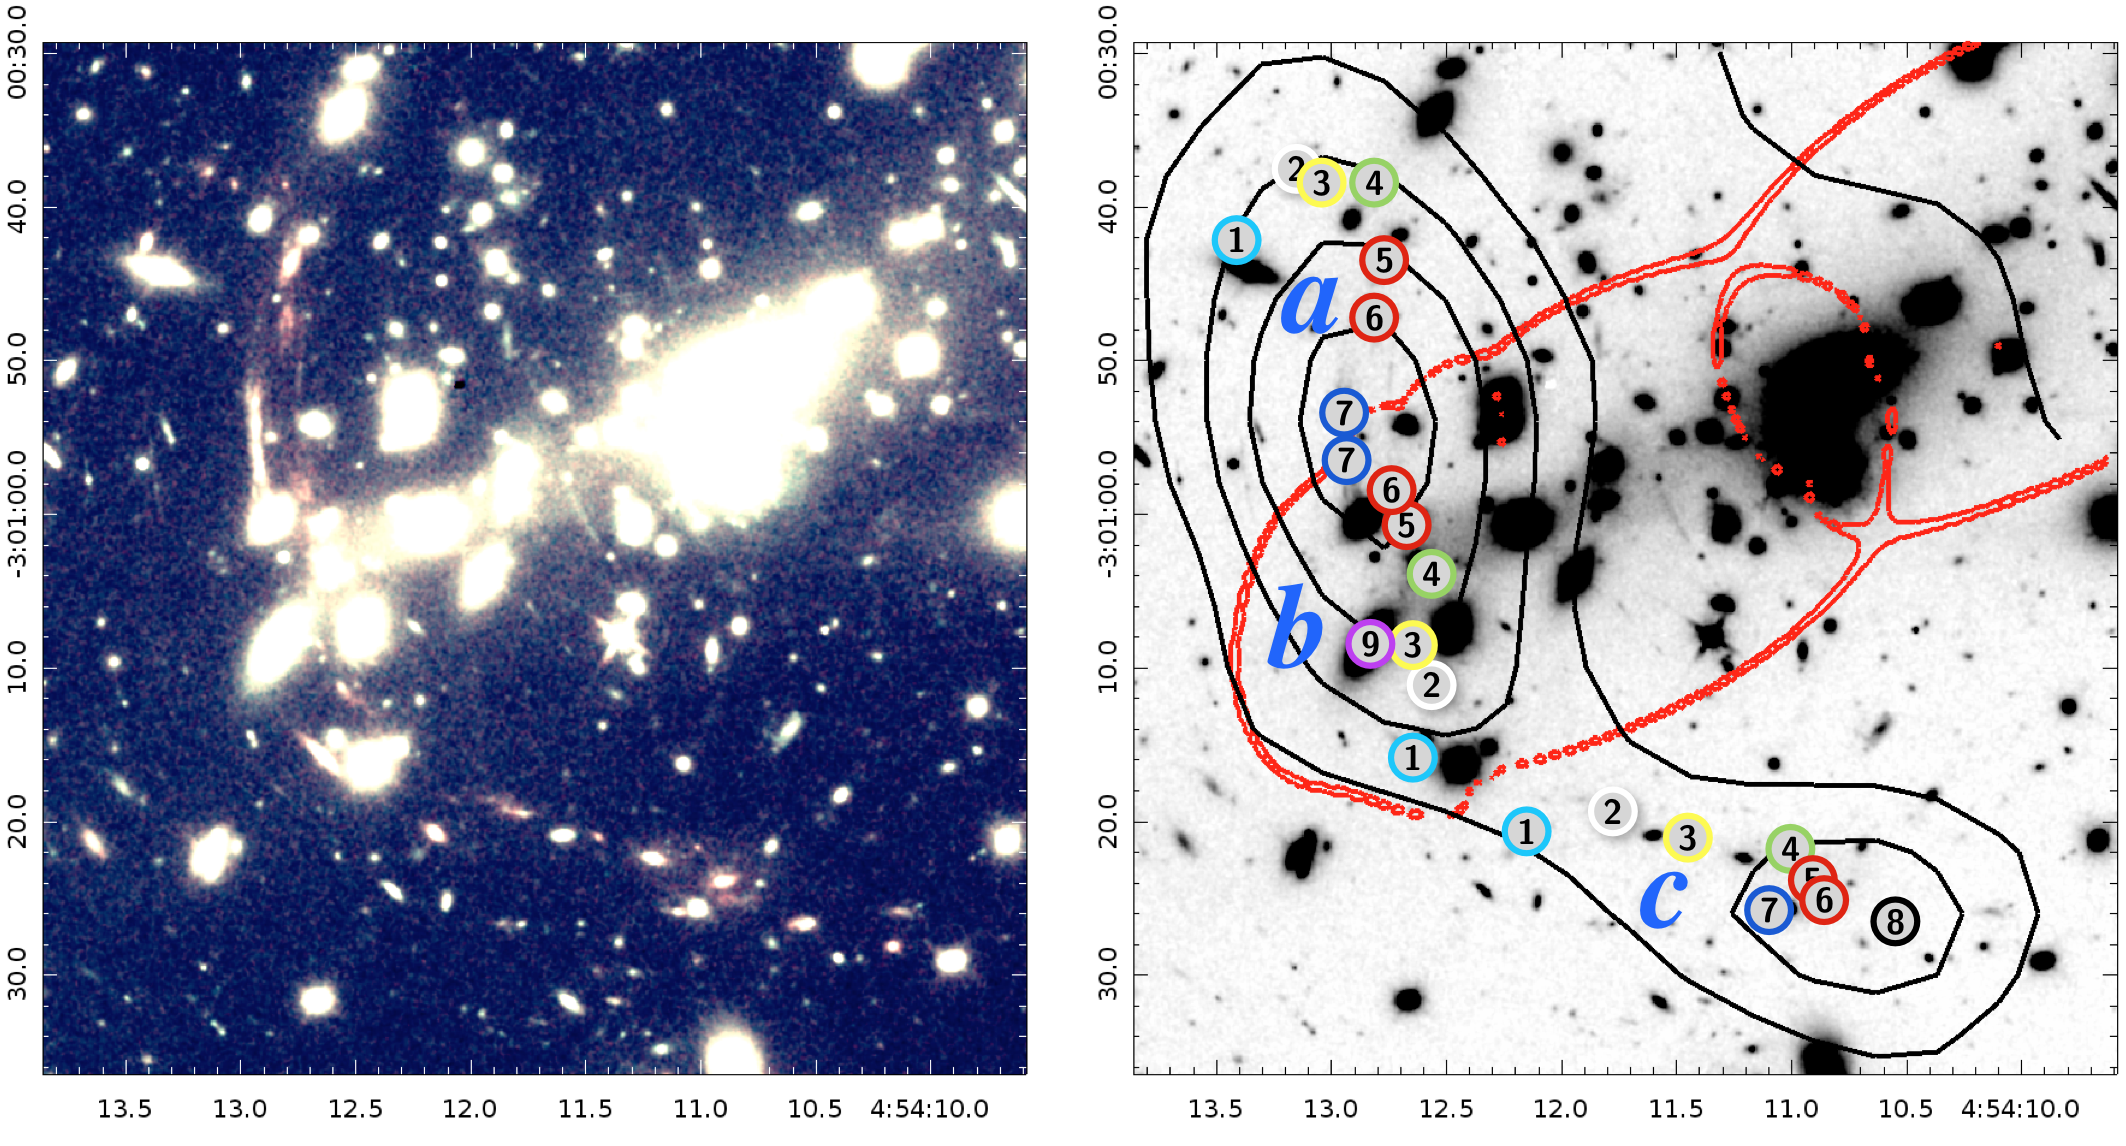
Although the main motivation for our study comes from the new submm data, it makes the most scientific sense to first describe the optical data. We retrieved previously unpublished observations using WFC3 on HST from the Canadian Astronomical Data Centre (program 11591). The observations were taken at 1.1 and 1.6 m with 2400 and 2600 second exposures, respectively. A small pointing shift in the data, with respect to HST data published by Borys et al. (2004) and Berciano Alba et al. (2010), was corrected by aligning to the older HST data in this field. These observations reveal a host of new red objects in the region of the submm arc (Fig. 1).
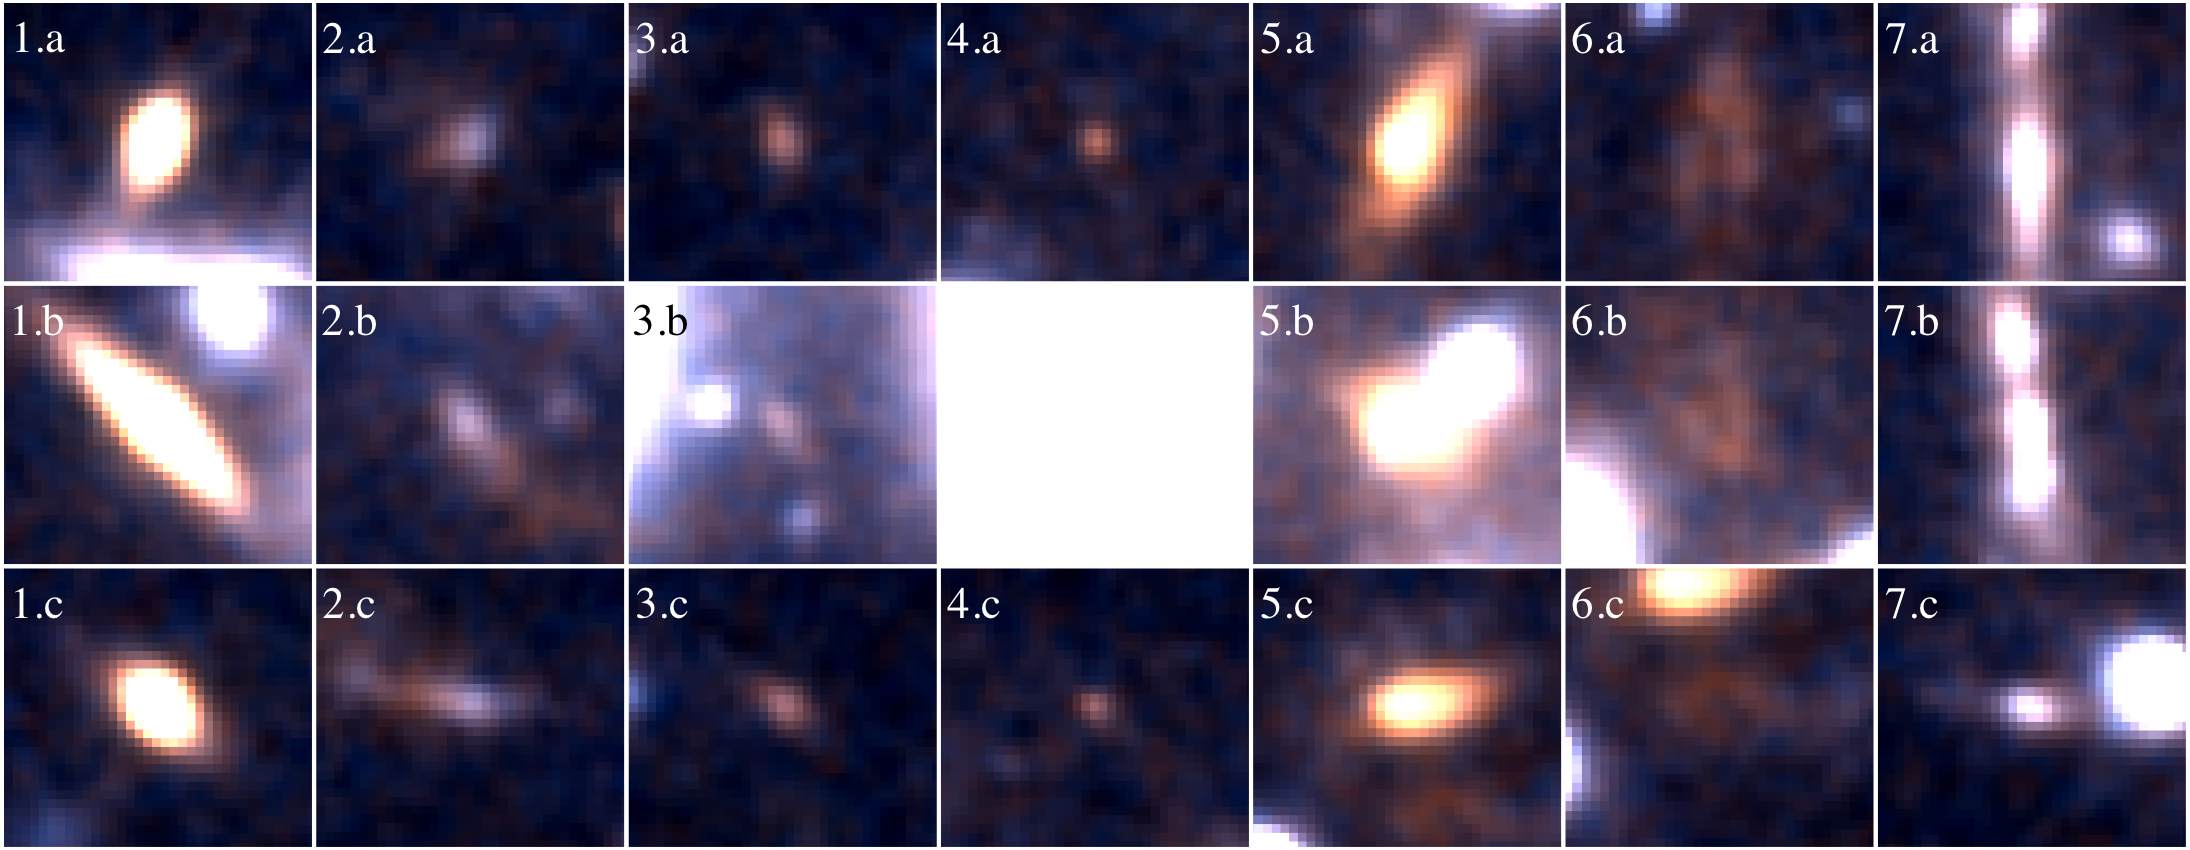
Using Lenstool (Kneib et al., 1996; Jullo et al., 2007; Jullo & Kneib, 2009) and a new lensing model for the cluster, we were able to identify four new multiply-imaged galaxies within the HST images in the region of the submm arc. Table 1 lists the positions, amplifications factors, and redshift estimates derived from our model for of each of the seven multiply-imaged galaxies within the region of the submm arc. Fig. 1 shows the dramatic positional arrangement of the multiple images with respect to the “giant submm arc” and the available submm data. Enlarged cut-outs of the multiply imaged galaxies are shown in Fig. 2. Borys et al. (2004) have already suggested that Galaxies 5, 6 and 7 are likely to be an interacting group at . Our new model confirms their analysis and adds Galaxies 2, 3, and 4 to the same group, expanding it to a group of six galaxies at . Galaxy 1 is found to have a slightly higher redshift of derived from the lensing model, and thus not likely associated with the interacting group.
Galaxy 8 is not multiply imaged, but has similar colours to the rest of the multiply-imaged galaxies and has a disturbed morphology. If it is at the same redshift as the interacting group, our lensing model predicts no multiple images, and thus we have no constraints on its redshift from the lensing model. However, we have found that submm emission originating from near its position is important for reproducing the morphology of the submm arc (see § 5), and thus we have included it in our model (see § 4).
Galaxy 9 is a foreground galaxy at and has associated MIPS 24 m (not described here) and PACS emission (see § 3.2), thus is also included in our model as a possible source of submm emission.
It is apparent that the nature of the submm arc is significantly more complicated than previously thought and is likely a combination of several of the galaxies described above. More details concerning the Lenstool modelling will be presented in a forthcoming paper by Kneib & Richard (in prep.).
3 New Submm Imaging
3.1 SCUBA-2
The cluster was observed with SCUBA-2 (Holland et al., 2013) on the JCMT during commissioning, as part of “Guaranteed Time” for the instrument team. Since the submm arc had already been observed at 850 m using SCUBA (Borys et al., 2004), the motivations for the new observations were: (1) to confirm the bright lensed structure with SCUBA-2, without the complications introduced by SCUBA’s requirement to chop (Borys et al., 2004); and (2) to detect the lensed structure at 450 m, at a resolution better by about a factor of two, with the hope of resolving the submm arc into individual sources. The data were reduced using a configuration file optimized for blank fields using the smurf data reduction software for SCUBA-2 (Chapin et al., 2013).
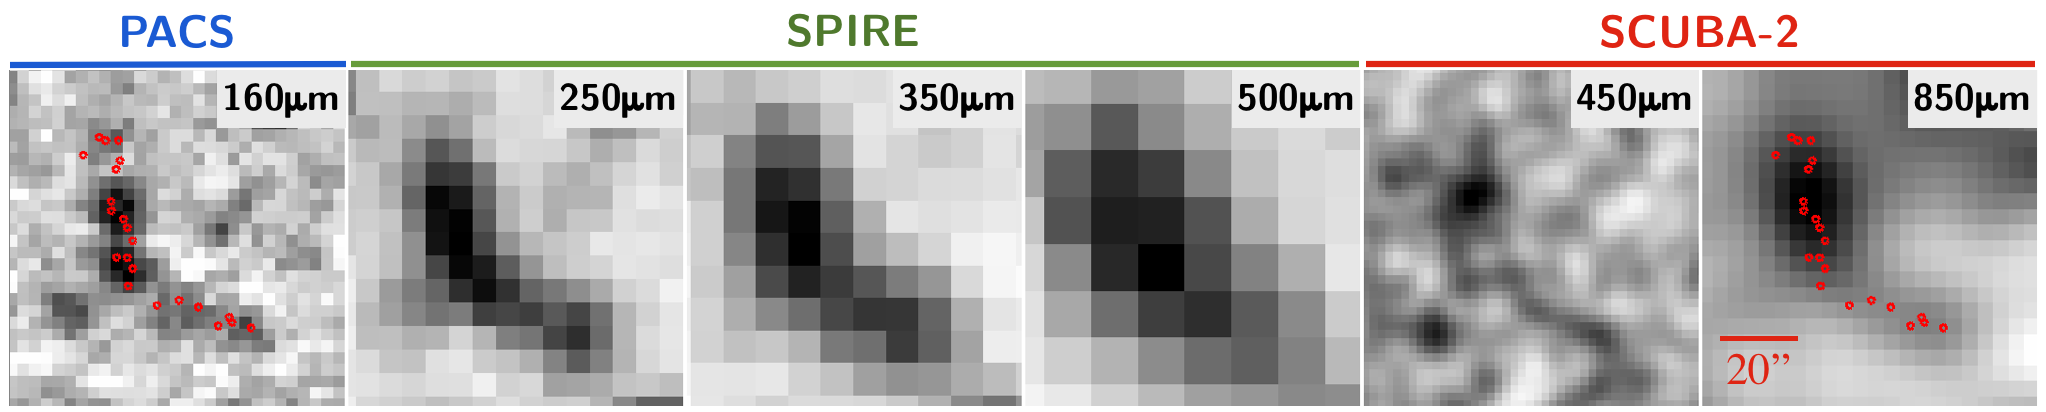
At 850 m, the submm arc is detected at high signal-to-noise by SCUBA-2 (see Fig. 1). Its brightest part is elongated roughly north-south, and at the southern end curves to the west, just as in the original SCUBA image. The higher-resolution 450 m data trace a largely similar structure, but at a lower relative sensitivity, with a signal-to-noise ratio of about 3 after smoothing with the beam, for the brightest portion of the lensed emission. The SCUBA-2 data are constrained by both resolution at 850 m and sensitivity at 450 m, and thus only limited conclusions can be obtained from these two channels alone. Fig. 1 shows the SCUBA-2 data alongside the Herschel SPIRE and PACS images for comparison, while Fig. 1 shows smoothed 850 m contours plotted over the HST imaging.
3.2 Herschel
Confusion-limited images of MS 0451.60305 using Herschel SPIRE (Griffin et al., 2010; Swinyard et al., 2010) were taken as part of the guaranteed time program HerMES (the Herschel Multi-tiered Extragalactic Survey, Oliver et al., 2012). The cluster was imaged at the three SPIRE wavelengths of 250, 350 and 500 m with FWHM beam sizes of 18.1, 24.9 and 36.2 arcseconds, respectively (Griffin et al., 2010). A detailed description of the map-making procedure is given in Levenson et al. (2010), and the most recent updated method described in Viero et al. (2013). To ensure accurate astrometry, we have stacked on the positions of over 900 Spitzer MIPS 24 m sources that overlap with the field and have corrected a 1.3 arcsecond shift in RA and 0.4 arcsecond shift in Dec. The uncertainty in this correction is 0.2 arcseconds, calculated by bootstrapping the 24 m source list.
Two PACS (Poglitsch et al., 2010) observations taken as part of the PACS Evolutionary Probe key program (Lutz et al., 2011) are also available and were processed using the “multiple obsid scanMapDeepSurvey” pipeline within HIPE 10 (Ott, 2010). The default units were converted from Jy pixel-1 to Jy beam-1 by multiplying by the beam area and dividing by the pixel area. The beam area for the 160 m point spread function (PSF) was found to be 180 arcsec2 and was computed by integrating over the beam profile provided by the NASA Herschel Science Center. The FWHM at 160 m is 11.6 arcseconds. For galaxies at , 70 m PACS data are expected to be dominated by warm dust, which is not well reproduced by the simple SED model adopted in § 4, and are therefore not used in this study.
The submm arc is detected across all the available submm bands (see Fig. 1), but with the large number of multiply-imaged galaxies (seen in Fig. 1) that are strung along the submm arc, it is unclear which galaxies are contributing. The morphology of the submm arc seen in each image is a function of both the telescope PSFs and the SEDs of the contributing galaxies. In addition to determining which galaxies are contributing, we would also like to constrain their physical properties. With the lensing model well constrained by the HST observations (see § 2) and this wealth of multi-wavelength data, it is clear that a comprehensive modelling approach is required.
4 A framework for fitting SEDs to confused counterparts
Both Borys et al. (2004) and Berciano Alba et al. (2010) performed limited modelling of the optical and radio counterparts, respectively, in an attempt to reproduce the observed submm arc. Their approach of smoothing different plausible components with the SCUBA 850 m beam showed that the LBG and two EROs are likely contributors, but neither could fully reproduce the observed submm arc. With new SCUBA-2 and Herschel observations, we are able to expand on this approach and have developed a framework for fitting SEDs to the confused optical counterparts, fully exploiting the strong gravitational lensing of this system.
While source plane reconstruction of multiply-imaged galaxies is an effective approach for high-resolution imaging (e.g. Kochanek & Narayan, 1992; Colley et al., 1996), it fails in the confused regime. Because the galaxies blend together in the submm, it is impractical to trace photons back through the lensing potential and into the source plane, since much of the photon positional information has been lost due to the large telescope beams. Instead, we use the high-resolution HST imaging to identify candidate counterparts to the submm galaxies in the optical, and use their positions as priors for the origin of any submm emission. We then forward-model the galaxy SEDs through the telescope filters, and use the amplification factors derived from the lensing model for each galaxy image, to reproduce the submm arc in each wavelength channel separately. Essentially, we are fitting SEDs of galaxies directly to the data, without the need for first deblending and extracting sources or smoothing and rebinning our data to the worst resolution (a process that destroys useful information).
Our method is complementary to that employed by Fu et al. (2012), where they forward-model a single submm source through the gravitational lens, allowing the position to vary, to reproduce the observed morphology of their SMA and VLA observations. With their model, they were able to show that the source of the gas and dust emission was offset from the optical counterpart. However, the gravitational lensing in this case is galaxy-galaxy lensing and the observations have much higher resolution than either the SCUBA-2 or Herschel observations presented here. The gravitational lensing presented here is for a group of galaxies being lensed by a foreground cluster and thus the set of multiple images subtends a much larger area on the sky than galaxy-galaxy lensing. The optical imaging provides positions which are more than adequate for our purposes, since, with the resolutions of SCUBA-2 and Herschel, any small offset of the submm emission from their optical counterparts will not have a strong effect on the morphology of the submm arc; the strongest effect of an offset would be seen in the relative amplifications of the multiple images. Our method is novel in that we reproduce the morphology of the submm emission across multiple wavelengths, while simultaneously fitting source SEDs, thus tying together the multi-wavelength data. These two complementary techniques (detailed source plane reconstruction and forward modelling SEDs at fixed source positions) could be combined in the future, given the proper observations.
4.1 Model SED and image reconstruction
The first ingredient we need is an SED model for our galaxies in the submm. For the longer wavelength channels of SCUBA-2 and Herschel SPIRE, the SED of a galaxy is well represented by a modified blackbody with a single temperature:
| (1) |
where is the flux density of galaxy , is a normalization factor, is the observed frequency, , is the dust emissivity, is the dust temperature, and is the redshift. Due to the high redshifts of our galaxies, the shorter wavelength channels of Herschel are dominated by hot dust and are better represented by a power law on the Wien side, i.e.,
| (2) |
where the power law amplitude and the frequency at which to switch between the power law and modified blackbody are chosen so that the transition is smooth (i.e. the two functions and their first derivative are continuous); such a model has been used by Pascale et al. (2009), for example. We then propagate the individual galaxy SEDs through each telescope bandpass filter:
| (3) |
where is the flux density averaged over channel for galaxy , is the transmission for channel , and is a calibration factor. For Herschel, , due to assuming a power law SED shape for observed sources, where is equal to , , , and for 160, 250, 350 and 500 m, respectively. We assume a constant calibration factor, , for SCUBA-2, since the bandpass filters are relatively narrow and we are firmly on the Rayleigh-Jeans side of the spectrum.
Using the lensing model, the SCUBA-2 and Herschel images are reconstructed as follows:
| (4) |
Here is the flux at position for frequency channel , is the amplification factor for image of Galaxy derived from the lensing model, is the response function (i.e. the telescope beam), with denoting the position of image of Galaxy , and is the image background.
The response functions for the Herschel SPIRE channels are approximated as Gaussians with FWHM of 18.1, 24.9 and 36.2 arcseconds at , and m, respectively, and 11.6 arcseconds at 160 m for Herschel PACS. Due to the high-pass filtering of the SCUBA-2 data, we need to ensure that we have an accurate model of the effective response function, thus we simulate 7 and 15 arcsecond FWHM point-sources, for the 450 and 850 m data, respectively, within the smurf data-reduction software, and approximate the effective response function by fitting double Gaussians to their resulting shapes. The result for the 450 m response function is a Gaussian with FWHM of 6.86 arcseconds and an amplitude of 0.893, plus a second Gaussian with FWHM of 34.6 arcseconds and amplitude of 0.015. The result for the 850 m response function is a Gaussian with FWHM of 13.9 arcseconds and a amplitude of 0.869, plus a second Gaussian with FWHM of 25.9 arcseconds and amplitude of 0.077.
4.2 Model fitting
The model is fit to the data using an MCMC Metropolis-Hastings algorithm (Metropolis et al., 1953; Hastings, 1970) with Gibbs sampling (Geman & Geman, 1993). Since the SCUBA-2 450 and 850 m and PACS 160 m data are limited by instrumental noise, the likelihood functions for these data are calculated as follows:
| (5) |
where subscript denotes the band, are the data, denotes the position of pixel in the image, is the instrumental noise for pixel , is the instrument calibration factor (with a mean value of unity), and is a constant.
The likelihood function for the Herschel SPIRE data is more complicated, since we are limited by extragalactic confusion noise as opposed to instrumental noise. The confusion limit in each channel is 5.8, 6.3 and 6.8 mJy at 250, 350 and 500 m, respectively (Nguyen et al., 2010). This means that the residuals after subtracting the model will be: (i) much larger than instrumental noise; (ii) correlated spatially with the beam; and (iii) correlated across wavelengths. This is because confusion noise is real signal generated from many faint sources that are all blending together to produce an unknown and correlated variable background. Taking confusion into account, the likelihood function for the Herschel SPIRE data is therefore
| (6) |
where is a one-dimensional list of the residuals, and contains all three channels of SPIRE data (), and is the inverse covariance matrix for the residuals. The covariance matrix, , is estimated using the GOODS-North HerMES field, also observed with Herschel SPIRE. This is the largest blank Herschel field with instrumental noise similar to that of the MS 0451.60305 data, and has an area of 0.1 deg2. To estimate the covariance matrix, we extract cut-outs from the GOODS-North field, with the same dimensions as the MS 0451.60305 data, and calculate the covariance between all the pixels. We then average the covariance matrices of each set of cut-outs to obtain an estimate of the true covariance matrix, ignoring regions with standard deviations greater than twice the confusion limit in any channel to avoid regions with significantly bright sources. The total likelihood is then
| (7) |
Flux calibration uncertainties, , are taken into account during the fitting procedure by setting priors on for each band. The flux calibrations of the 160, 450 and 850 m data are 5%, 2.5% and 5%, respectively (Muller et al., 2011; Dempsey et al., 2013). SPIRE waveband calibrations are correlated, with a covariance matrix
| (8) |
where the calibration is normalised to unity (Bendo et al., 2013, , 4% correlated uncertainty between bands plus 1.5% uncorrelated between bands). The calibration uncertainties are a small effect when compared to the instrumental and confusion noise within the observations.
We set no prior on the amplitude of the modified blackbodies or each unknown image background. A hard prior, , is motivated by the fact that neither Dale et al. (2012) nor Amblard et al. (2010) found any colder Herschel galaxies in either the nearby or distant Universe, respectively. We have virtually no constraining power on the dust emissivity, , and we therefore fix it to a nominal value of 1.5. We fix to 2.0 as found by Casey (2012). While we have corrected the relative pointing of Herschel and HST, we are unable to find any significant pointing shift in the JCMT due lower signal-to-noise in the map than what is available in the Herschel SPIRE observations. The nominal pointing accuracy is 1.5 arcseconds, and thus we include this as a prior and marginalise over any possible pointing offset along with the image backgrounds.
Table 1 lists the possible contributing galaxies in our model. This consists of the seven multiply-imaged galaxies, one singly-imaged red galaxy (Galaxy 8) with disturbed morphology, and one foreground galaxy (Galaxy 9) with associated MIPS 24 m and PACS 160 m emission. This brings the total to nine possible contributing galaxies. Their positions are derived from the HST data and their amplification factors are derived from the lensing model. The redshift of Galaxy 8 is set to a nominal value of and we report the lensed far-IR luminosity and SFR for this galaxy. Galaxy image positions, amplification factors and redshifts are held fixed during the fitting procedure since their uncertainties are small.
Far-IR luminosities are calculated by integrating the rest-frame SEDs from 8 to 1000 m and SFRs are calculated using the relation measured by Murphy et al. (2011):
| (9) |
When reporting the uncertainties in our SFR values for each galaxy in our model, we consider only the uncertainty in far-IR luminosity and do not include any uncertainty in this empirical relationship.
5 Results and Discussion
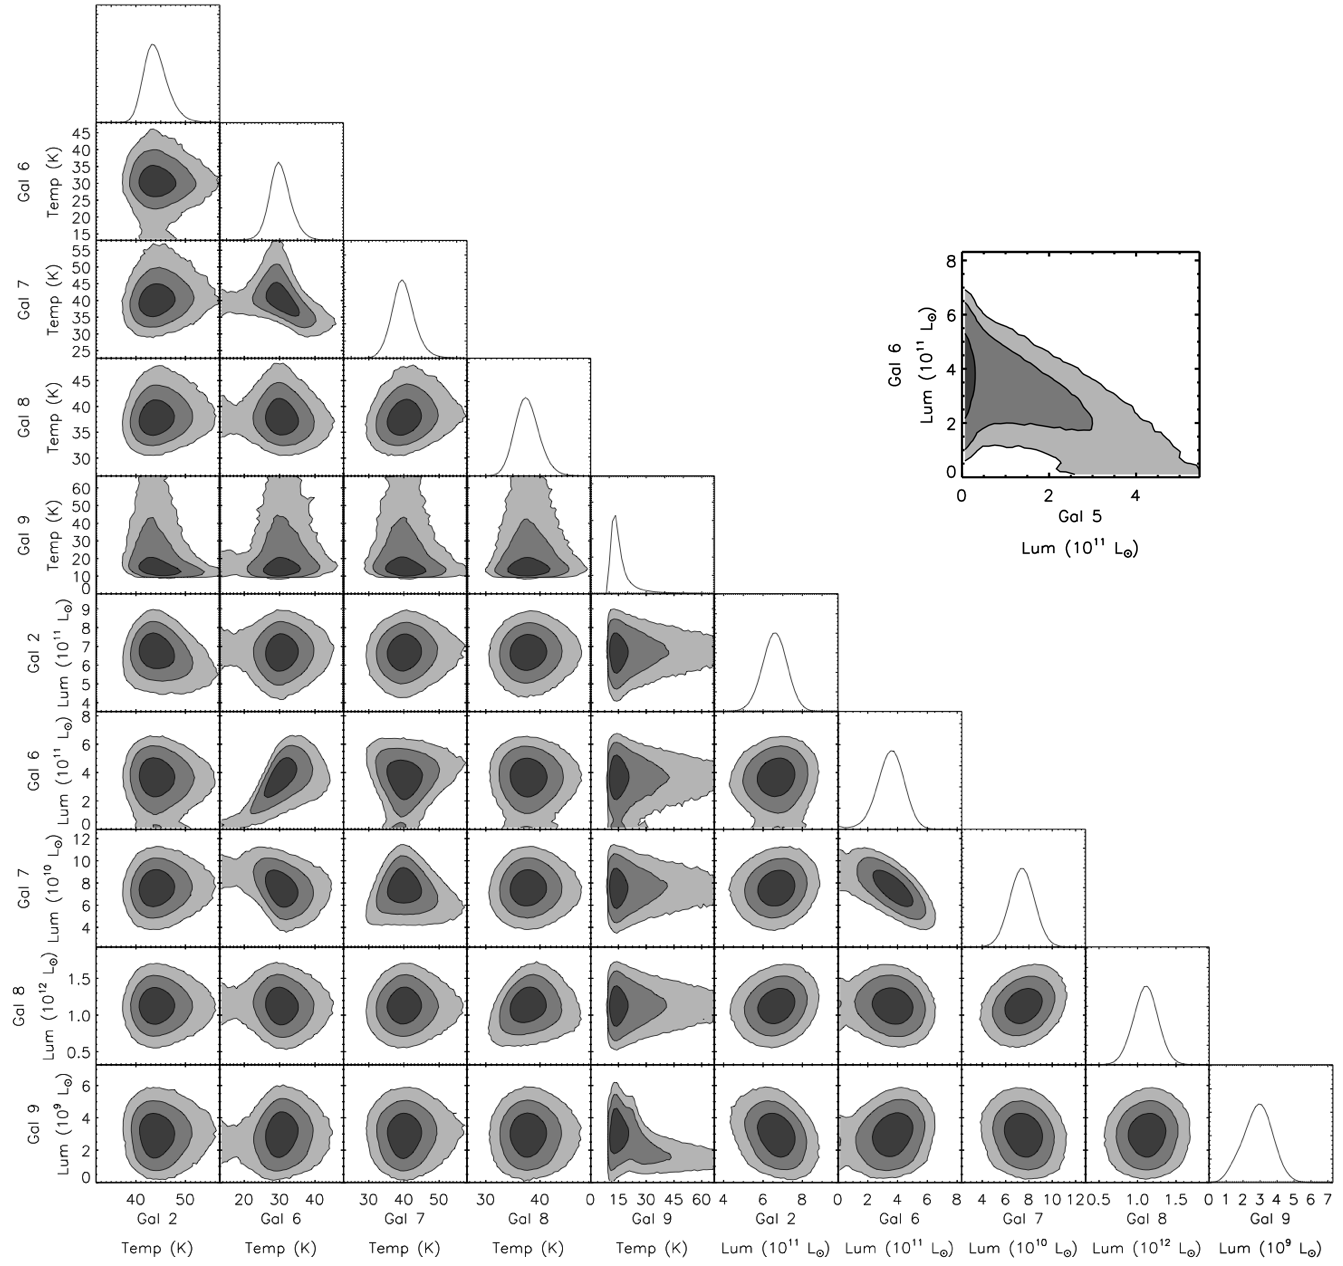
All galaxies listed in Table 1 are included in our model and when fitted, we can clearly identify Galaxies 2, 6, 7, 8, and 9 as the sources of submm emission generating the submm arc. Fig. 3 shows the positional arrangement of the galaxy group in the source plane with squares highlighting the galaxies responsible for generating the majority of the submm arc. Fig. 5 shows the data, the best-fit model, and the residuals after subtracting the model from the data. Also included in the figure is a decomposition of the submm arc into the unique contributions of each galaxy to the total best-fit model. Fig. 6 shows the MCMC likelihood contours for temperature and far-IR luminosity for these five galaxies, and Table 2 lists the results along with SFRs and upper limits for Galaxies 1, 3, 4, and 5. It is apparent in the MCMC likelihood contours that there is a strong degeneracy between the far-IR luminosities of Galaxies 6 and 7.
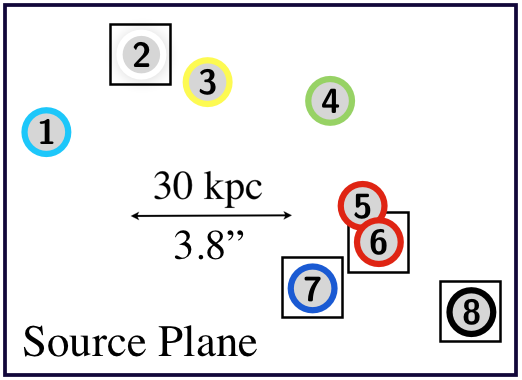
Fig. 6 shows a degeneracy between the luminosity of Galaxy 6 versus Galaxy 5 in our model, due to their close proximity. While our model prefers emission from Galaxy 6, Berciano Alba et al. (2010) found that Galaxy 5 has associated radio emission, and hence we might consider that the submm emission attributed to Galaxy 6 in our model actually originates from Galaxy 5. We can test this hypothesis using the far-IR-to-radio correlation to predict a luminosity for Galaxy 5 and by also removing Galaxy 6 from our model and perform the fitting procedure again (thus forcing our model to attribute a portion of its luminosity to Galaxy 5), and then comparing the results. When doing so, we find that Galaxy 5 is attributed a luminosity of by our model (i.e essentially all the luminosity of Galaxies 5 and 6 together). Using the peak flux density measurements of Berciano Alba et al. (2010) at 1.4 GHz and the amplification factors in Table. 1, the unlensed 1.4 GHz flux density for Galaxy 5 is . With these two measurements, we can calculate the logarithmic ratio of the far-IR flux to radio flux density, . We assume a power law for the radio SED, , with , and we K-correct for redshift. We find , which is 2- below the relation found by Ivison et al. (2010) for high- galaxies, . This indicates that Galaxy 5 may have excess radio emission, suggesting contribution from an AGN, rather than radio emission associated with star formation. For this reason, we tend to follow the results which come from our model fitting, i.e. that Galaxy 6 dominates the far-IR emission. Nevertheless, it remain the case that interpretation of this pair is difficult with existing data.
Using ALMA to obtain high-resolution imaging, Hodge et al. (2013) recently showed that many of the submm galaxies (SMGs) previously detected in the LABOCA ECDFS Submillimeter Survey (LESS) are in fact composed of multiple fainter sources. The group of galaxies behind MS 0451.60305, consisting of Galaxies 2 through 8, is another good example of SMGs being composed of several sources. Unlensed, this group would appear as a point source to any of the current single-dish submm telescopes, with flux densities of mJy, mJy, mJy, mJy, mJy, and mJy at 160, 250, 350, 500, 450 and 850 m, respectively. This would put the group below the LESS survey threshold of 4.44 mJy at 870 m, hence we are seeing evidence of submm source multiplicity extending to the fainter flux densities. The coincidence of being highly magnified by a massive foreground cluster allows us to study this group in much greater detail than would otherwise be possible, but we cannot tell how rare such SMG groups might be.
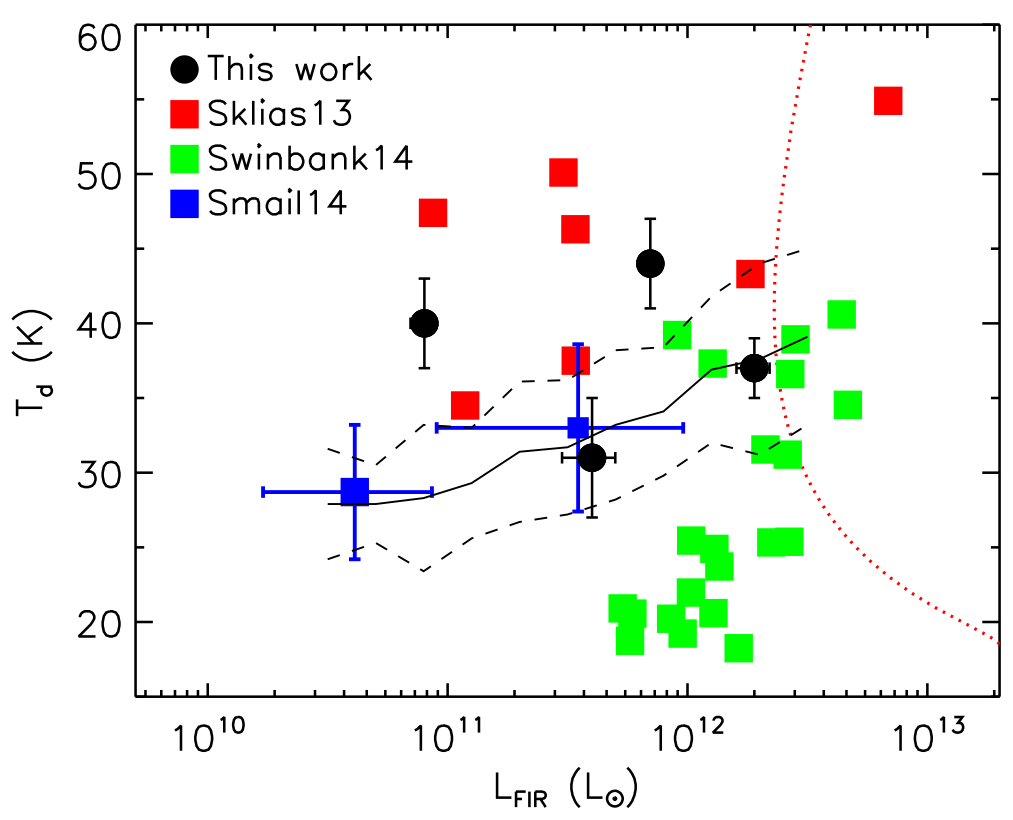
The SED fits within our model allow us to investigate the physical conditions of each component of the submm arc. Fig. 4 plots verus for the four galaxies constrained by our model with trends and data found by Symeonidis et al. (2013), Swinbank et al. (2014), Sklias et al. (2014), and Smail et al. (in press). As described in Symeonidis et al. (2013), studying the relation between these two quantities gives insight into the nature of star-formation within galaxies: a flat relation with implies that star formation regions become more extended when increasing far-IR luminosity, while something close to the Stefan-Boltzmann law, , would imply constant star formation region size (for optically thick star-forming clouds). Symeonidis et al. (2013) used Herschel SPIRE and PACS to probe this relation and found the trend plotted as a solid black line in Fig. 4, with dashed lines showing the dispersion. When comparing low and high redshift galaxies, they found that the later were up to 10 K cooler than their low redshift counterparts, suggesting evolution with redshift towards more extended star-forming regions in the early universe. Swinbank et al. (2014) found a similar trend with high redshift galaxies being on average 2–3 K colder than low redshift galaxies. Smail et al. (in press) found that stacking on narrow-band [Oii] emitters and MIPS+radio sources within a cluster (intrinsically faint sources) found no evidence of evolution, although their direct detections with SPIRE and SCUBA-2 (thus intrinsically luminous sources) were also found to be cooler in temperature. A recent study by Sklias et al. (2014), used gravitational lensing to examine intrinsically fainter galaxies at high redshifts. Although limited by small number statistics, they found the opposite trend for high redshift galaxies. When adding the four galaxies constrained by our model, our results appear to support those found by Sklias et al. (2014). This suggests that selection effects and/or biases are present here.
As has been pointed out before (e.g. Chapman et al., 2005; Chapin et al., 2011) selection effects can be extremely important when studying the correlation between and . The Swinbank et al. (2014) sample of SMGs were selected at 870 m and thus may be biased towards lower dust temperatures, and those of Sklias et al. (2014) were formally selected at 160 m, and thus could be biased towards warmer dust temperatures. It should be noted that the submm arc in MS 0451.60305 was first discovered at 850 m (Chapman et al., 2002) and therefore unlikely to be biased towards the warmer dust temperatures that we find.
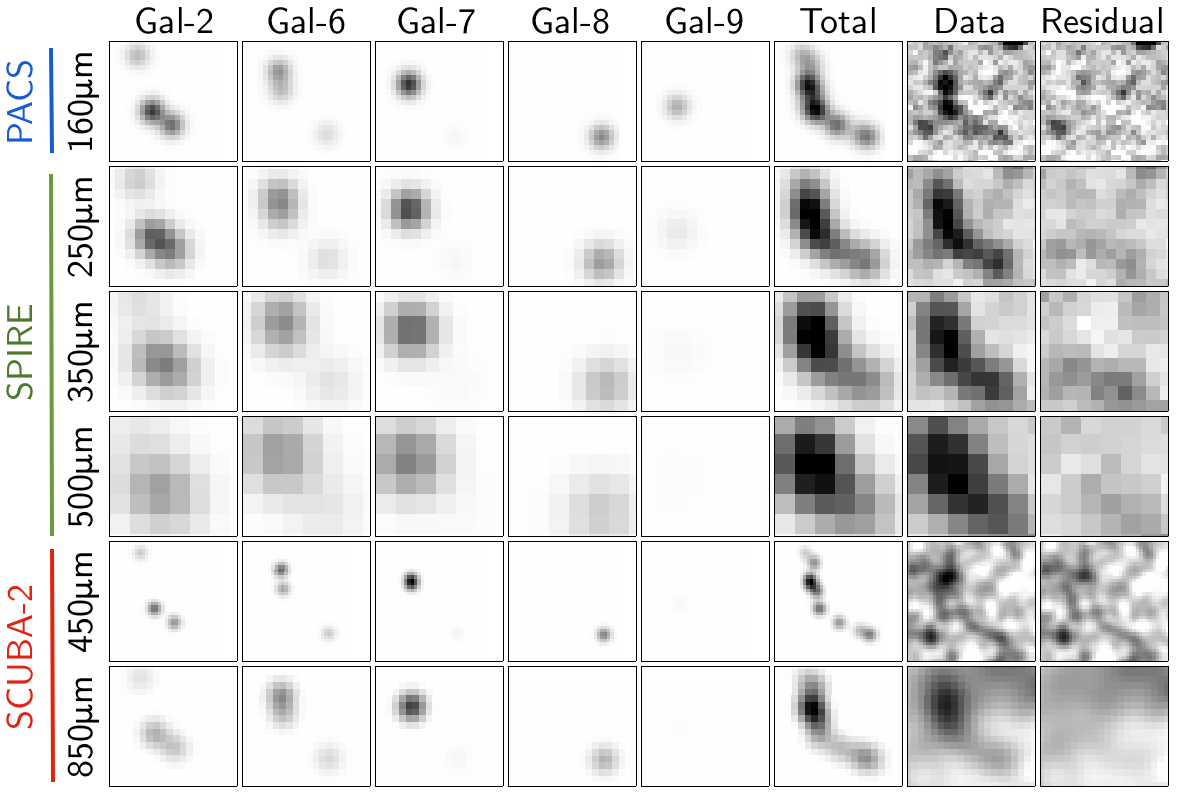
In addition to the selection biases inherent in focussing on a single distinctive object, there are also a number of systematic uncertainties that could be present in our modelling approach. Most importantly, we have fixed the amplification factors for the galaxy images. Any errors in amplification can affect our results in several ways. For example, since the contributions to the submm arc from Galaxies 7 and 8 (See Fig. 5) are mostly point-like, then any uncertainty in amplification predominantly affects their measured far-IR luminosities and SFRs. This is especially true for Galaxy 7, because two of its images lie very close to the critical line, and thus its amplification is highly sensitive to any offset between optical and submm components of the galaxy. The uncertainty in relative amplification between galaxy images likely affects which galaxies are preferred by the data. For example, the images of Galaxies 5 and 6 are spatially very close, thus the different relative amplifications between their respective images probably contributes to Galaxy 6 being preferred by the model fits.
It is also possible that the simple SED model we have adopted may not accurately approximate the true SEDs of the galaxies in the lensed system. The dust emissivity, , is known to be partially degenerate with dust temperature and we have fixed it to a nominal value of 1.5, thus the uncertainties reported for dust temperatures are likely too small. Furthermore, although this newer HST data is both deeper and at a longer wavelength, it is possible that we are missing fainter group members, as was the case in previous studies (Borys et al., 2004; Berciano Alba et al., 2010). If any of the galaxies are not at , their reported far-IR luminosities and thus SFRs will be affected, since the distances to the galaxies are used in these calculations. This is especially true for Galaxy 8, as we have no constraints on its actual redshift and our analysis has assumed it to be part of the group.
Despite these reservations, the model we have adopted appears to provide a reasonably good fit to the data across a wide range of wavelengths. Higher resolution submm data would be needed to further investigate the nature of the galaxy group.
6 Conclusions
With our new modelling approach, we have overcome the confused nature of this complex system by fully exploiting the differential amplification across the galaxy group and the multiple imaging caused by the strong gravitational lensing. This has allowed us to tackle the challenge of disentangling and fitting SEDs to multiple components of the submm arc. We have shown that the submm arc is predominantly generated by four of the seven galaxies that probably comprise a group at a redshift of , with star-formation likely triggered by the galaxies undergoing a merger. It thus appears that no hidden region of dust-enshrouded star formation (as postulated by Berciano Alba et al., 2010) is required to explain the morphology of the submm arc. This method also demonstrates the power of a broad multi-wavelength approach to fully understanding the nature of the submm arc: HST imaging gives us the priors on galaxy positions, as well as providing the constraints for the lensing model; Herschel samples the peak of the far-IR SED, as well as providing the high-resolution far-IR imaging at 160 m; and SCUBA-2 850 m data samples the long wavelength portion of the FIR SED at a resolution that closely matches that of the 160 m imaging.
This is a very unique system that gives us a glimpse into the formation of structure and stars in the early Universe, and no other submm lens discovered to date can match the number of separate galaxies lensed from the same redshift. Spectroscopy and high-resolution follow-up with new interferometer observatories will be the key to confirming and unravelling the nature of this high- merging galaxy group.
Acknowledgements
This research has been supported by the Natural Sciences and Engineering Research Council of Canada. IRS acknowledges support from STFC (ST/I001573/1), a Leverhulme Fellowship, the ERC Advanced Investigator program DUSTYGAL and a Royal Society/Wolfson merit award. The James Clerk Maxwell Telescope is operated by the Joint Astronomy Centre on behalf of the Science and Technology Facilities Council of the United Kingdom, the National Research Council of Canada, and (until 31 March 2013) the Netherlands Organisation for Scientific Research. Additional funds for the construction of SCUBA-2 were provided by the Canada Foundation for Innovation. SPIRE has been developed by a consortium of institutes led by Cardiff University (UK) and including Univ. Lethbridge (Canada); NAOC (China); CEA, LAM (France); IFSI, Univ. Padua (Italy); IAC (Spain); Stockholm Observatory (Sweden); Imperial College London, RAL, UCL-MSSL, UKATC, Univ. Sussex (UK); and Caltech, JPL, NHSC, Univ. Colorado (USA). This development has been supported by national funding agencies: CSA (Canada); NAOC (China); CEA, CNES, CNRS (France); ASI (Italy); MCINN (Spain); SNSB (Sweden); STFC, UKSA (UK); and NASA (USA). PACS has been developed by a consortium of institutes led by MPE (Germany) and including UVIE (Austria); KU Leuven, CSL, IMEC (Belgium); CEA, LAM (France); MPIA (Germany); INAF-IFSI/OAA/OAP/OAT, LENS, SISSA (Italy); IAC (Spain). This development has been supported by the funding agencies BMVIT (Austria), ESA-PRODEX (Belgium), CEA/CNES (France), DLR (Germany), ASI/INAF (Italy), and CICYT/MCYT (Spain). This research has made use of data from the HerMES project (http://hermes.sussex.ac.uk/), a Herschel Key Programme utilising Guaranteed Time from the SPIRE instrument team, ESAC scientists and a mission scientist. The HerMES data were accessed through the HeDaM database (http://hedam.oamp.fr) operated by CeSAM and hosted by the Laboratoire d’Astrophysique de Marseille. This research used the facilities of the Canadian Astronomy Data Centre operated by the National Research Council of Canada with the support of the Canadian Space Agency. Based on observations made with the NASA/ESA Hubble Space Telescope, obtained from the data archive at the Space Telescope Institute. STScI is operated by the association of Universities for Research in Astronomy, Inc. under the NASA contract NAS 5-26555. This work is based [in part] on observations made with the Spitzer Space Telescope, which is operated by the Jet Propulsion Laboratory, California Institute of Technology under a contract with NASA. Support for this work was provided by NASA. The Dark Cosmology Centre is funded by the Danish National Research Council.
References
- Amblard et al. (2010) Amblard A., et al., 2010, A&A, 518, L9
- Bendo et al. (2013) Bendo G. J., et al., 2013, MNRAS, 433, 3062
- Berciano Alba et al. (2010) Berciano Alba A., et al., 2010, A&A, 509, A54
- Borys et al. (2004) Borys C., et al., 2004, MNRAS, 352, 759
- Casey (2012) Casey C. M., 2012, MNRAS, 425, 3094
- Chapin et al. (2013) Chapin E. L., Berry D. S., Gibb A. G., Jenness T., Scott D., Tilanus R. P. J., Economou F., Holland W. S., 2013, MNRAS, 430, 2545
- Chapin et al. (2011) Chapin E. L., et al., 2011, MNRAS, 411, 505
- Chapman et al. (2005) Chapman S. C., Blain A. W., Smail I., Ivison R. J., 2005, ApJ, 622, 772
- Chapman et al. (2002) Chapman S. C., Scott D., Borys C., Fahlman G. G., 2002, MNRAS, 330, 92
- Chapman et al. (2002) Chapman S. C., Smail I., Ivison R. J., Helou G., Dale D. A., Lagache G., 2002, ApJ, 573, 66
- Colley et al. (1996) Colley W. N., Tyson J. A., Turner E. L., 1996, ApJL, 461, L83
- Dale et al. (2012) Dale D. A., et al., 2012, ApJ, 745, 95
- Dempsey et al. (2013) Dempsey J. T., et al., 2013, MNRAS, 430, 2534
- Donahue et al. (2003) Donahue M., et al., 2003, ApJ, 598, 190
- Fu et al. (2012) Fu H., et al., 2012, ApJ, 753, 134
- Geach et al. (2006) Geach J., et al., 2006, ApJ, 649, 661
- Geman & Geman (1993) Geman S., Geman D., 1993, Journal of Applied Statistics, 20, 25
- Gioia & Luppino (1994) Gioia I. M., Luppino G. A., 1994, ApJS, 94, 583
- Griffin et al. (2010) Griffin M. J., et al., 2010, A&A, 518, L3
- Hastings (1970) Hastings W. K., 1970, Biometrika, 57, 97
- Hodge et al. (2013) Hodge J. A., et al., 2013, ApJ, 768, 91
- Holland et al. (2013) Holland W. S., et al., 2013, MNRAS, 430, 2513
- Ivison et al. (2010) Ivison R. J., et al., 2010, A&A, 518, L31
- Jullo & Kneib (2009) Jullo E., Kneib J.-P., 2009, MNRAS, 395, 1319
- Jullo et al. (2007) Jullo E., Kneib J.-P., Limousin M., Elíasdóttir Á., Marshall P. J., Verdugo T., 2007, New Journal of Physics, 9, 447
- Karim et al. (2013) Karim A., et al., 2013, MNRAS, 432, 2
- Kneib et al. (1996) Kneib J.-P., Ellis R. S., Smail I., Couch W. J., Sharples R. M., 1996, ApJ, 471, 643
- Kochanek & Narayan (1992) Kochanek C. S., Narayan R., 1992, ApJ, 401, 461
- Kodama et al. (2005) Kodama T., et al., 2005, PASJ, 57, 309
- Kovács et al. (2006) Kovács A., Chapman S. C., Dowell C. D., Blain A. W., Ivison R. J., Smail I., Phillips T. G., 2006, ApJ, 650, 592
- Levenson et al. (2010) Levenson L., et al., 2010, MNRAS, 409, 83
- Lutz et al. (2011) Lutz D., et al., 2011, A&A, 532, A90
- Metropolis et al. (1953) Metropolis N., Rosenbluth A. W., Rosenbluth M. N., Teller A. H., Teller E., 1953, JCP, 21, 1087
- Moran et al. (2007) Moran S. M., et al., 2007, ApJ, 671, 1503
- Muller et al. (2011) Muller T., Nielbock M., Balog Z., Klass U., Vilenius E., 2011, Technical Report PICC-ME-TN-037
- Murphy et al. (2011) Murphy E. J., et al., 2011, ApJ, 737, 67
- Negrello et al. (2010) Negrello M., et al., 2010, Science, 330, 800
- Nguyen et al. (2010) Nguyen H. T., et al., 2010, A&A, 518, L5
- Oliver et al. (2012) Oliver S. J., et al., 2012, MNRAS, 424, 1614
- Ott (2010) Ott S., 2010, in Mizumoto Y., Morita K.-I., Ohishi M., eds, Astronomical Data Analysis Software and Systems XIX Vol. 434 of Astronomical Society of the Pacific Conference Series, The Herschel Data Processing System – HIPE and Pipelines – Up and Running Since the Start of the Mission. p. 139
- Pascale et al. (2009) Pascale E., et al., 2009, ApJ, 707, 1740
- Pilbratt et al. (2010) Pilbratt G. L., et al., 2010, A&A, 518, L1
- Poglitsch et al. (2010) Poglitsch A., et al., 2010, A&A, 518, L2
- Pope et al. (2006) Pope A., Scott D., Dickinson M., Chary R.-R., Morrison G., Borys C., Sajina A., Alexander D. M., Daddi E., Frayer D., MacDonald E., Stern D., 2006, MNRAS, 370, 1185
- Reese et al. (2000) Reese E. D., et al., 2000, ApJ, 533, 38
- Sklias et al. (2014) Sklias P., et al., 2014, ArXiv e-prints
- Smail et al. (1997) Smail I., Ivison R. J., Blain A. W., 1997, ApJ, 490, L5
- Swinbank et al. (2014) Swinbank M., et al., 2014, ArXiv e-prints
- Swinyard et al. (2010) Swinyard B. M., et al., 2010, A&A, 518, L4
- Symeonidis et al. (2013) Symeonidis M., et al., 2013, MNRAS, 431, 2317
- Takata et al. (2003) Takata T., et al., 2003, PASJ, 55, 789
- Viero et al. (2013) Viero M. P., et al., 2013, ApJ, 772, 77
- Wardlow et al. (2010) Wardlow J. L., et al., 2010, MNRAS, 401, 2299
- Wardlow et al. (2013) Wardlow J. L., et al., 2013, ApJ, 762, 59
| Galaxy ID | R.A. | Dec. | F160W | F110W | Amplification | Redshift | Notes |
|---|---|---|---|---|---|---|---|
| J2000 | J2000 | ||||||
| 1. | 04:54:13.42 | 3:00:43.0 | B(Takata et al., 2003) | ||||
| 1. | 04:54:12.65 | 3:01:16.5 | C(Takata et al., 2003) | ||||
| 1. | 04:54:12.17 | 3:01:21.4 | D(Takata et al., 2003) | ||||
| 2. | 04:54:13.15 | 3:00:38.4 | |||||
| 2. | 04:54:12.58 | 3:01:11.9 | |||||
| 2. | 04:54:11.79 | 3:01:20.2 | |||||
| 3. | 04:54:13.04 | 3:00:39.2 | |||||
| 3. | 04:54:12.68 | 3:01:09.1 | |||||
| 3. | 04:54:11.46 | 3:01:21.7 | |||||
| 4. | 04:54:12.82 | 3:00:39.3 | |||||
| 4. | 04:54:12.53 | 3:01:04.5 | Lensing model position | ||||
| 4. | 04:54:11.03 | 3:01:22.4 | |||||
| 5. | 04:54:12.81 | 3:00:44.4 | ERO-B(Borys et al., 2004) | ||||
| 5. | 04:54:12.69 | 3:01:01.5 | ERO-B(Borys et al., 2004) | ||||
| 5. | 04:54:10.93 | 3:01:24.6 | ERO-B(Borys et al., 2004) | ||||
| 6. | 04:54:12.81 | 3:00:47.5 | ERO-C(Borys et al., 2004) | ||||
| 6. | 04:54:12.72 | 3:00:59.6 | ERO-C(Borys et al., 2004) | ||||
| 6. | 04:54:10.88 | 3:01:25.8 | ERO-C(Borys et al., 2004) | ||||
| 7. | 04:54:12.95 | 3:00:54.8 | LBG(Borys et al., 2004) | ||||
| 7. | 04:54:12.93 | 3:00:57.5 | LBG(Borys et al., 2004) | ||||
| 7. | 04:54:11.11 | 3:01:26.6 | LBG(Borys et al., 2004) | ||||
| 8 | 04:54:10.55 | 3:01:27.3 | Singly imaged | ||||
| 9 | 04:54:12.85 | 3:01:09.1 | – | foreground galaxy |
| Gal | SFR | ||||||||
|---|---|---|---|---|---|---|---|---|---|
| ID | () | () | () | (mJy) | (mJy) | (mJy) | (mJy) | (mJy) | (mJy) |
| 1 | |||||||||
| 2 | |||||||||
| 3 | |||||||||
| 4 | |||||||||
| 5 | |||||||||
| 6 | |||||||||
| 7 | |||||||||
| 8 | |||||||||
| 9 |