The open cluster NGC 7142: interstellar extinction, distance and age
Abstract
The results of medium-band photometry of 1037 stars in the area of old open cluster NGC 7142 down to = 20.1 mag in the Vilnius seven-colour system are presented. Photometric results are used to classify in spectral and luminosity classes about 80 % of stars down to = 18.5 mag, to identify cluster members, to determine the main cluster parameters and to investigate the interstellar extinction in this direction. The average extinction of the cluster is about 1.1 mag ( = 0.35), and its distance is 2.3 kpc (the distance modulus 11.8 mag). The age of the cluster, 3.0 Gyr, is estimated from the intrinsic colour-magnitude diagram with individual dereddening of each star and the Padova isochrones. The surface distribution of the extinction is shown. The reddening of the eclipsing variable V375 Cep is found to be close to the average reddening of the cluster. Probably, the cluster contains five red clump giants, two asymptotic branch stars and four blue stragglers.
keywords:
stars: fundamental parameters – ISM: extinction – Galaxy: open clusters and associations: individual: NGC 71421 Introduction
The open cluster NGC 7142 is an important object, being one of the old clusters which is used in plotting various relations between structural, chemical and evolutionary parameters of the cluster system (Phelps et al. 1994; Janes & Phelps 1994; Friel 1995; Twarog et al. 1997; Carraro et al. 1998; Salaris et al. 2004; Cheng et al. 2012). Every improvement of the accuracy of parameters of these clusters is an important input to understanding the structure and evolution of the Galactic disk. However, due to uneven distribution of interstellar reddening and considerable contamination by field stars, the parameters of NGC 7142 are still far from being of sufficient accuracy.
The cluster is located at the Galactic latitude +9.5, close to the boundary of the Cepheus Flare, a branch of the Local spiral arm deviating towards the North Celestial Pole. The surrounding area exhibits a complicated pattern of molecular and dust clouds, see the recent review of this area by Kun et al. (2008). At only 0.4 from NGC 7142, a well-known reflection nebula NGC 7129 with the embedded young cluster is located. The nebula is a part of the clump P2 of the dust cloud TGU H645 identified in the Dobashi et al. (2005) atlas of dark clouds. The distribution of the 100 m emission (Schlegel et al. 1998) shows that NGC 7142 can be partly covered by the periphery of the same dust cloud.
The first photometric investigations of NGC 7142 in the UBV system published in the 1960s, have used the photographic method with standard stars measured photoelectrically. The first vs. – diagram of NGC 7142 was published by Hoag et al. (1961), which exhibited the sequence of red giants and a crowding of stars near the turn-off point of the main sequence. In the presence of large scatter, the limiting magnitude ( = 16.5) was not sufficient to cover main sequence stars below the turn-off point. Therefore, the reddening and distance of the cluster were estimated only approximately (Johnson et al. 1961). Analyzing the colour-magnitude diagram (hereafter CMD) of NGC 7142, van den Bergh (1962) first noted that its general features show a strong resemblance to those of the old open clusters M67 and NGC 188. He also directed attention to the presence of irregularities of the absorbing cloud close to the cluster. Sharov (1968) described a group of stars close to the main sequence but located to the left from the turn-off point (blue stragglers). The next photometric investigation of NGC 7142 was published by van den Bergh & Heeringa (1970) down to limiting = 17 mag, and this allowed to estimate more reliable colour excess and age of the cluster.
The first CCD photometry of the cluster in the BV system down to = 18 mag was published by Crinklaw & Talbert (1991). They confirmed a considerably variable extinction across the face of the cluster suspected earlier by other authors – differential reddening was found to be of the order of = 0.1. Their CMD was dereddened with a mean value of = 0.35 and gave the distance modulus 11.4 mag by fitting to the zero-age main sequence (ZAMS). They also noted that a binary star population is present in the cluster.
The most recent CCD photometry of NGC 7142 has been done by Janes & Hoq (2011) and Sandquist et al. (2011) in the BVI system, down to = 20–21 mag. Both investigations for determining the distance and age have used the red clump giants (hereafter RCGs) and the turn-off point of the main sequence, comparing their positions with isochrones and with the old cluster M67. In both papers the resulting colour excesses are in full agreement, = 0.32. The true distance moduli, , are also very close, 11.85 and 11.9 mag. However, the age of the cluster determined by Janes et al. is 6.9 Gyr, while Sandquist et al. find 3 Gyr.
Probably, there are several reasons for the differences in age discussed by Sandquist et al. The main difficulty in deriving cluster properties is related to contamination of the CMD with field stars, and to the reddening and extinction differences across the cluster field. The last effect makes all branches of NGC 7142 very broad and prevents to make reliable shift of isochrones for the age determination. To make the sequences narrower, individual determination of reddening for each cluster star is needed. Memberships to the cluster from radial velocities are known only for 16 red giants (Friel et al. 1989; Friel & Janes 1993; Jacobson et al. 2007, 2008; Sandquist et al. 2011).
For determining the extinction for individual stars we need their
two-dimensional classification which can be done either by
spectroscopy or by multicolour photometry. The Vilnius seven-colour
system with the mean wavelengths at 345, 374, 405, 466, 516, 544 and 656
nm was developed especially for a similar aim.111 For the
description of the Vilnius photometric system see Straižys (1992)
monograph available in pdf format at
http://www.itpa.lt/MulticolorStellarPhotometry/ and ADS.
About a hundred stars of NGC 7142 using CCD photometry in the Vilnius system were classified in MK types in our earlier paper (Maskoliūnas et al. 2012). That investigation included 2140 stars down to = 17 mag in a 1.5 sq. degree field with the NGC 7129 and NGC 7142 clusters and a broad surrounding area. For about 60% of stars photometric two-dimensional classification has been given. However, the limiting magnitude of that catalogue was not sufficient for the investigation of the NGC 7142 cluster. Therefore we decided to perform new CCD photometry of the cluster with a telescope having a better resolution and a deeper limiting magnitude.
2 Observations, their processing and the classification of stars
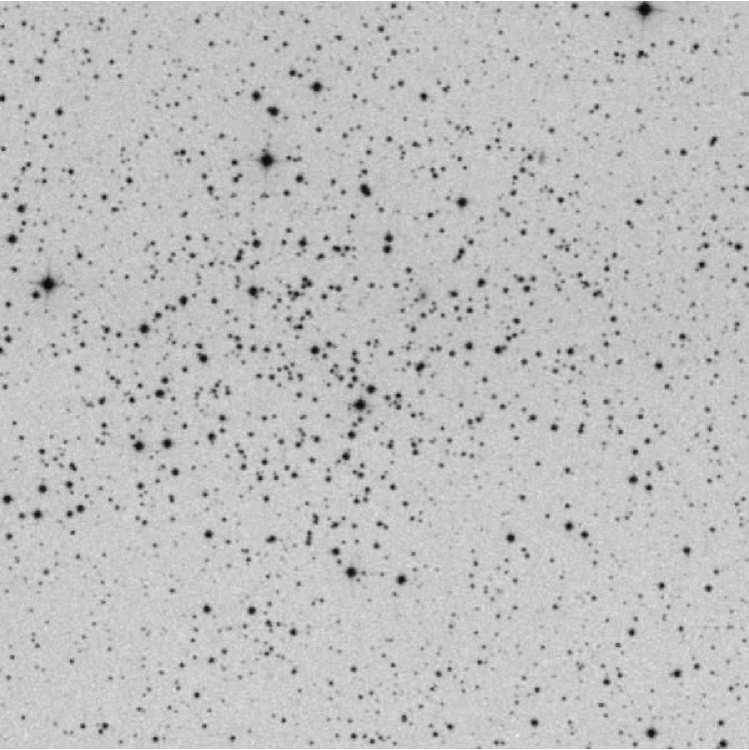
The observations were obtained by one of the authors (R. P. Boyle) in 2009 October 18–21 with the 1.8 m telescope of the Vatican Observatory on Mt. Graham (Arizona) equipped with a 4K backside illuminated CCD camera and liquid nitrogen cooling. The camera contains a 62 62 mm chip which gives a 13′ 13′ field-of-view, with a scale of 0.38″/pixel (binned 2 2). The cluster was framed with a set of exposures (Table 1) to ensure the linearity of response from 9 mag to the faintest limit. The seeing during the observations usually was of the order of 1. The field center is at (J2000): 21h45m10s, +65 46 30.
| Filter | nm | Exposure range | Number of frames. |
|---|---|---|---|
| 345 | From 250 s to 25 s | 15 | |
| 374 | From 800 s to 30 s | 12 | |
| 405 | From 500 s to 25 s | 8 | |
| 466 | From 120 s to 4 s | 12 | |
| 516 | From 300 s to 4 s | 12 | |
| 544 | From 120 s to 4 s | 10 | |
| 656 | From 240 s to 8 s | 14 |
For the reduction of CCD exposures, the IRAF program package in the aperture photometry mode was used. The radii of apertures were 1.5–2.0″, depending on the star image sizes. For flat-fielding, the twilight and dome exposures were applied. Large-scale systematic errors in the flat fields were corrected by using the exposures of the cluster M67 with known photometric data in the Vilnius system of high accuracy (Laugalys et al. 2004). Preliminary colour equations for the reduction of magnitudes and colour indices of stars from the instrumental to the standard system were obtained also from observations of M67. Zero-points of magnitudes in the Vilnius system were based on 117 common stars with the Maskoliūnas et al. (2012) catalogue. The final adjustment of colour equations and zero-points has been done by optimizing the accuracy of photometric classification of a selected set of standard stars in the investigated area (V. Laugalys, in preparation).
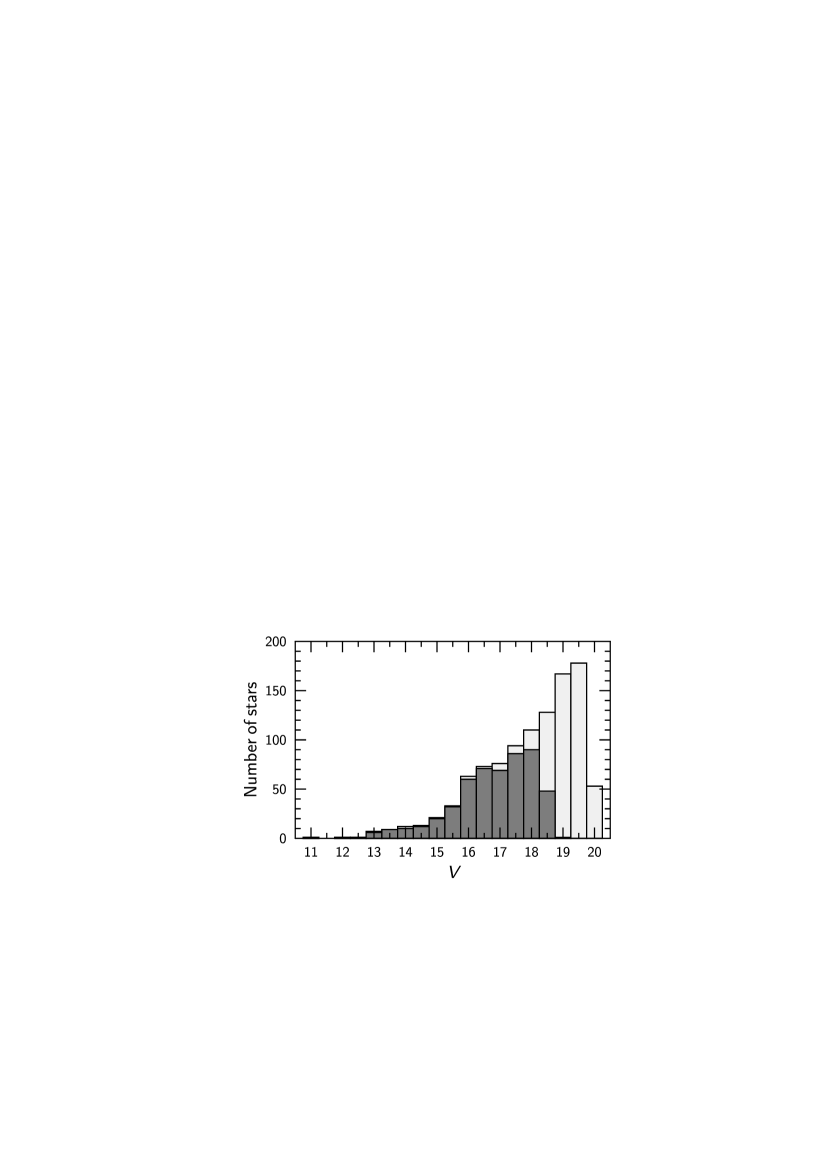
Magnitudes and colour indices were determined for 1037 stars down to the limiting magnitude 20.1. The distribution of stars in magnitudes is shown in Fig. 2. The shadowed parts of the columns correspond to stars for which spectral and luminosity classes in the MK system were determined from the Vilnius photometric data. They compose 80 % down to = 18.5 mag. The accuracy of the magnitudes and colour indices –, –, – and – down to = 16 mag is usually better than 0.02 mag, the errors of – and – are about 1.5–2.0 times larger.
The classification of stars was based on two methods. One of them uses a set of 14 interstellar reddening-free -parameters compared with the corresponding parameters for about 8300 standard stars with known MK types (Straižys et al. 2013). The second method uses 300 synthetic standard stars constructed from the mean intrinsic colour indices for different MK types and reddened with the interstellar extinction law (K. Zdanavičius, in preparation). In the classification, the normal interstellar extinction law was accepted. Normality of the law in the dust cloud TGU H645 has been verified by determining the ratio of colour excesses for red giants with the data from the 2MASS survey.
The accuracy of spectral types is characterised by the values of , the match quality of parameters between the program star and standard stars:
| (1) |
where are differences of corresponding -parameters of the program star and a standard star, is a number of the compared -parameters (in our case was between 10 and 14). If the is mag, the classification is of good accuracy, if it is within 0.02–0.03 mag, the accuracy is reasonable. The quality of spectral types is low if 0.03 mag. However, for K-type stars s up to 0.04 mag are acceptable. K-stars can be classified in spectral and luminosity classes even without the ultraviolet color indices – and –. A typical 3 classification errors in spectral classes are 2 decimal subclasses for A-F-G stars and 0.5 subclass for K stars. The errors in luminosity classes are 1 class for A-F-G stars and 0.5 class for K stars. At 18.5 mag the accuracy of photometry is too low for reliable classification of stars. For most of these stars the - and – colour indices are not given.
The main problem in photometric classification are the stars with various peculiarities and unresolved binaries. The suspected metal-deficient stars (designated ‘md’) require spectroscopic confirmation. In the present investigation we do not use the stars classified as peculiar and with low accuracy ( 0.03 mag, except of K-stars).
3 Catalogue
Magnitudes and colours for stars in the NGC 7142 area are listed in Table 2. The printed text contains only a sample of the table with 10 stars. The sample is taken from the central part of the catalogue to represent all the columns. The full table is accessible only in the online version.
The columns list the following information: star number, equatorial coordinates J2000.0, magnitude , colour indices –, –, –, –, – and –, photometric spectral type in the MK system, accuracy of spectral types , interstellar extinction , the possible membership to the cluster (see the next section) and the note number. The colour indices with = 0.05–0.10 mag are marked with colons. Spectral classes are designated in the lower-case letters to indicate that these are determined from photometric data. Notes at the end of the table contain important information on the stars available in the literature. The stars found to be binaries or having asymmetrical images were not classified – they are designated with the numeral 4 in the last column. The coordinates of stars were taken from the PPMXL catalogue (Roeser et al. 2010) with rounding to two decimals of time second and one decimal of arcsecond.
| No. | RA (J2000) | DEC (J2000) | – | – | – | – | – | – | Phot. | Member- | Notes | |||
|---|---|---|---|---|---|---|---|---|---|---|---|---|---|---|
| h m s | mag | mag | mag | mag | mag | mag | mag | sp. type | mag | mag | ship | |||
| 681 | 21 45 20.28 | +65 48 10.2 | 16.836 | 2.933 | 2.322 | 1.665 | 0.776 | 0.272 | 0.780 | f7 V | 0.015 | 1.21 | m | |
| 682 | 21 45 20.34 | +65 41 30.9 | 18.513 | 3.002: | 2.626 | 1.827 | 0.737 | 0.269 | 0.841 | |||||
| 683 | 21 45 20.43 | +65 48 31.0 | 13.779 | 4.171 | 3.447 | 2.449 | 1.031 | 0.381 | 0.982 | g8 III | 0.017 | 1.29 | m | 1,2,3 |
| 684 | 21 45 20.46 | +65 51 07.0 | 12.982 | 2.883 | 2.304 | 1.586 | 0.698 | 0.262 | 0.620 | f9 IV-V | 0.009 | 0.79 | 1 | |
| 685 | 21 45 20.88 | +65 48 41.5 | 17.395 | 3.101 | 2.551 | 1.817 | 0.829 | 0.308 | 0.802 | g0 V | 0.010 | 1.25 | m | |
| 686 | 21 45 20.89 | +65 47 39.9 | 12.792 | 2.705 | 1.082 | 0.415 | 0.923 | g5 II | 0.007 | 1.25 | 1,2 | |||
| 687 | 21 45 20.91 | +65 46 39.5 | 15.528 | 2.955 | 2.308 | 1.625 | 0.751 | 0.249 | 0.732 | f4 V | 0.019 | 1.29 | ||
| 688 | 21 45 20.94 | +65 49 13.6 | 18.471 | 2.815 | 2.226 | 1.629 | 0.754 | 0.274 | 0.753 | f-g, md: | ||||
| 689 | 21 45 21.08 | +65 47 02.8 | 16.619 | 3.018 | 2.422 | 1.737 | 0.781 | 0.290 | 0.730 | f9 V | 0.005 | 1.08 | m | |
| 690 | 21 45 21.10 | +65 42 02.2 | 14.020 | 3.591 | 3.044 | 2.070 | 0.844 | 0.342 | 0.814 | k0 IV | 0.018 | 0.58 |
Notes.
The columns give the running numbers, equatorial coordinates,
magnitude, colour indices, photometric spectral type and its accuracy,
interstellar
extinction, cluster membership and notes. The full catalogue of 1037 stars is available online.
4 Cluster distance
Interstellar extinctions and distances of stars were calculated with the equations
| (2) |
| (3) |
where the intrinsic colour indices and absolute magnitudes for the field stars were taken from the calibrations of spectral and luminosity classes (Straižys 1992). The extinctions in the medium-band Vilnius system and in the broad-band UBV system are very close. For the cluster members, the absolute magnitudes were taken individually as will be described lower. Thus, our first task was an attempt to identify possible cluster members.
First, we calculated the extinction-corrected magnitudes
| (4) |
for all stars with two-dimensional classification and plotted the intrinsic vs. diagram (hereafter, intrinsic CMD), where the intrinsic colour indices were taken according to MK spectral types.
As was mentioned in the Introduction, for some stars in the field, mostly for red giants, membership to the cluster is known from their radial velocities. Among them, most important are RCGs, which can be applied to estimate the distance to the cluster. Then the ZAMS line and the isochrones for the known distance modulus can be plotted on the intrinsic CMD, and this allows to locate the position of the cluster’s main sequence.
The next step is the exclusion of majority of the foreground and background stars. Preliminary distances for all stars can be calculated with the values taken according to their MK types. These distances for the cluster stars, due to the errors of absolute magnitudes and the presence of unresolved binaries, should exhibit a considerable scatter. In the photometric classification of A-F-G stars we usually accept 0.5 mag as the 3 error of . In this case the cluster stars with the maximum distance errors should appear less or more distant by a factor of 1.26. Thus, if the true distance of the cluster is , we should expect that the cluster stars due to luminosity errors will be scattered between distances /1.26 and 1.26. The stars with lower and higher distances can be considered to be foreground and background stars. They may be excluded from the dereddened CMD of the cluster.
Another source of scatter of the cluster stars to smaller distances are unresolved binaries. If both components of a binary star are of the same luminosity, the distance of such system is reduced by a factor of 1.41.
For determining the distance to NGC 7142 we applied five RCGs identified by Sandquist et al. (2011). The numbers of these stars in Table 2 are 461, 493, 683, 998 and 1026, all of them are of spectral types G8–G9 III classified with good accuracy. The sixth RCG identified by Sandquist et al., our No. 799, could not be classified since it is a visual binary with the components of similar brightness and a separation of 2–3. The mean distance to the five RCGs, 2.33 0.14 kpc, was calculated taking their average extinction-corrected magnitude = 12.54 mag and the absolute magnitude = +0.7 mag, corresponding to G8–G9 giants in the RCG sequence on the vs. – diagram for the Hipparcos stars (Perryman et al. 1997). The given rms error originates from the dispersion of extinction-corrected magnitudes of the five stars.
Distances to the same five RCGs were also calculated from 2MASS JHKs photometry (Skrutskie et al. 2006) accepting their absolute magnitude = –1.6 (Alves 2000; Grocholski & Sarajedini 2002) and the intrinsic colour index – = 0.09 (Straižys & Lazauskaitė 2009). The average distance of these stars, 2.27 0.18 kpc, is in good agreement with the result from Vilnius photometry. For the further analysis of the cluster, we accept it is located at a distance of 2.30 0.16 kpc, corresponding to the true distance modulus – = 11.8 mag. Due to the errors of absolute magnitudes ( 0.5 mag), cluster members at this distance should be scattered between 1.8 and 2.9 kpc.
Except of the five RCGs, we also attribute to cluster members a few red giants of spectral class K for which the membership was inferred from radial velocities, references are given in the Introduction. The three reddest giants of spectral types K2–K4.5 with numbers 1077, 1102 and 1181 were taken from the catalogue of Maskoliūnas et al. (2012). A few G-K giants and subgiants were added to the list of members according to their position in the dereddened CMD and the distance, with possible errors of taken into account.
5 Cluster stars near the turn-off point
In the intrinsic CMD (Fig. 4, see lower) a strong crowding of stars is seen near the main sequence with from 0.46 to 0.53, corresponding to the spectral classes F5–G0 and the luminosity classes V–IV. This signifies the presence here of the cluster stars near the turn-off point. We have accepted that all these crowding stars are cluster members since the main sequence in the direction of higher temperatures is almost empty (except of a few possible blue stragglers).
Unfortunately, in this spectral range the luminosity effect between V and IV classes on -parameters is quite small, and most stars located close to the turn-off point during photometric classification have been attributed to luminosity V. However, in the intrinsic CMD many of them lie at different levels above ZAMS, consequently, they should be of a higher luminosity. To make the absolute magnitudes closer to reality, we took into account their rise in the CMD diagram above the ZAMS line, , which was subtracted from of the ZAMS. This procedure was not applied only to the stars located 0.2 mag from the ZAMS – these stars were accepted to belong to luminosity V. In this way more negative absolute magnitudes were found for many stars in the region of the turn-off point. Since some stars in this region of CMD are binaries, their luminosities determined by this method should be overestimated. This must be taken into account determining the age of the cluster.
The choice of the coolest stars at spectral class G0, to which the absolute magnitudes have been corrected with the described method, is somewhat voluntary. It is based on the fact that for G-type stars the photometric luminosity effect is larger, and the stars are classified in luminosity classes with a better reliability.
6 Intrinsic colour-magnitude diagram

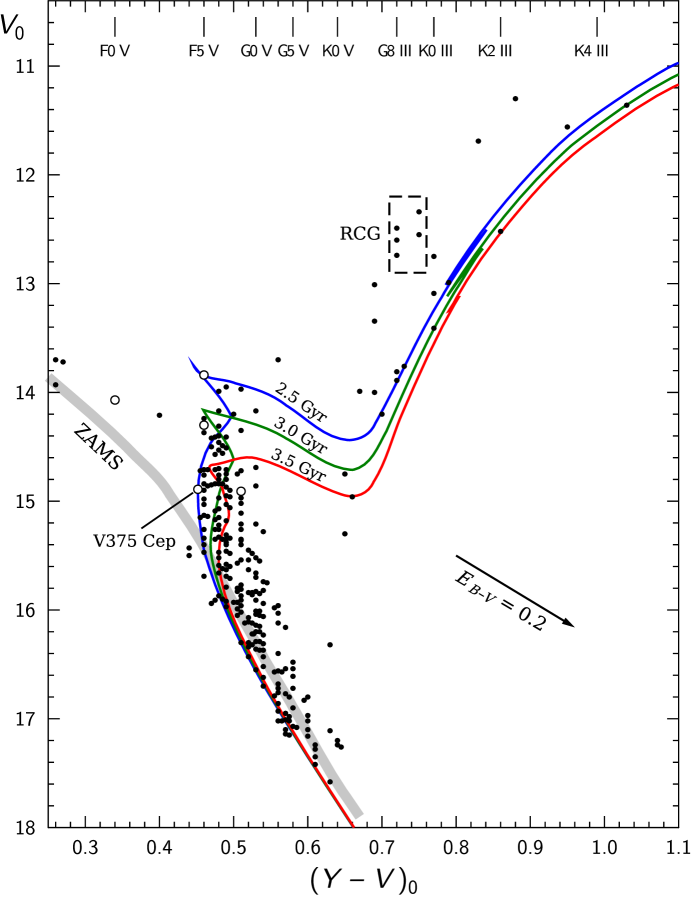
Fig. 3 shows the observed and the intrinsic CMDs for 255 possible cluster members which include: (1) all stars in the range of distances 1.8–2.9 kpc, (2) stars of spectral classes F5-G0 and luminosity classes V–IV, (3) red giants with the membership inferred from radial velocities, and (4) a few red giants and subgiants whose spectral types and distances are in reasonable agreement with the cluster membership. In Table 2 the suspected cluster members are indicated by ‘m’ in the next-to-last column.
In Fig. 3 circles show the observed positions of stars and dots are the same stars shifted along the reddening lines according to their and values. The shown length of the reddening line corresponds to = 0.35, the mean value of color excess of the cluster. It is evident that individual dereddening resulted in a considerable decrease of scatter of stars, especially on the main sequence.
Fig. 4 shows the intrinsic CMD of NGC 7142, together with isochrones, ZAMS line and other information. The CMD can be contaminated by field stars – some of them can be mixed together with the cluster members in sequences, others are easily seen by their outlying positions. For example, the circles show five eclipsing variables four of which are non-members (Sandquist et al. 2011, 2013). The accuracy of positions for the main sequence stars and K-giants mainly depends on the errors of spectral classes. Near the main sequence these errors are of the order of two subclasses, and this results in 0.03 mag. The position errors of K-giants are similar, because larger changes in colour between K subclasses are compensated by a larger accuracy of spectral classes ( 0.5 of the subclass). The errors in magnitudes and colours are correlated: the spectral class errors move the dereddened star along its reddening line with the slope / = 4.16.
Because the intrinsic colour indices were taken according to the MK spectral types, the stars have a discrete distribution along the colour axis. Thus, the appearance of CMD of NGC 7142 is somewhat different from those which are plotted directly from observational data and dereddened using a fixed value of the colour excess. The width of reddening-free cluster sequences in the CMD of NGC 7142, produced by our method, appears to be wider than the similar sequences of an old open cluster with low reddening, such as M67 (Boyle et al. 1998).
The grey line in Fig. 4 represents ZAMS for solar metallicity from Kazlauskas et al. (2006) corresponding to the distance modulus – = 11.8 mag. The main sequence of the cluster has the turn-off point at (–)0 = 0.46, spectral type F5 V. The spread of stars in absolute magnitudes at this point is about 1.5 mag. About 15 stars are located close to the expected sequence of giants and subgiants. Four possible blue stragglers (their numbers in Table 2: 337, 418, 664 and 754, spectral classes A6–F2) are seen close to the ZAMS. Due to possible duplicity, their positions in the colour-magnitude diagram can be of lower accuracy. One of the stars (No. 631, F0 V), looking as a blue straggler, is an eclipsing variable V3 from the Sandquist et al. (2011) list, non-member of the cluster. Two K-stars, Nos. 348 (K2.5 III) and 820 (K1.5 III) can belong to the asymptotic giant branch.
The intrinsic CMD of the cluster can be used for its age determination comparing to isochrones, but for this the metallicity should be known. From photometric diagrams in the Washington system, [Fe/H] = –0.17 was found by Geisler et al. (1991). From the medium-resolution spectroscopy of 11 red giants Friel & Janes (1993) found the mean metallicity [M/H] = 0.0 from the Fe and Fe-peak element blends and –0.23 from the Mgb+MgH feature. Twarog et al. (1997) transformed these values to a revised metallicity scale and received a value of [Fe/H] = +0.04. Jacobson et al. (2007, 2008) from medium- and high-resolution spectra of six stars have found [Fe/H] = +0.08 and +0.14. Sandquist et al. (2013) from high-resolution spectra of the eclipsing variable V375 Cep have found [Fe/H] = +0.09. Thus for the age determination we decided to use the isochrones for [Fe/H] = +0.10. If the solar metallicity is = 0.014 (Asplund et al. 2009) or 0.015 (Caffau et al. 2011), [Fe/H] = +0.10 corresponds to = 0.018–0.019.
In Fig. 4 we plot three isochrones for the ages 2.5, 3.0 and 3.5 Gyr from the Padova database of stellar evolutionary tracks and isochrones222Bressan et al. (2012) and http://stev.oapd.inaf.it/cgi-bin/cmd for the Vilnius system adjusted to a distance modulus of 11.8 mag. It is evident that the main-sequence lines of the isochrones with respect to the observed ZAMS line show a shift down by 0.2 mag in absolute magnitudes or by 0.02 mag to the left in –. It is difficult to determine the reason of this shift; it can be the result both of the observational ZAMS and the theoretical isochrones. The problems of the transformation of isochrones to the observational plane were discussed in many papers, see e.g. VandenBerg et al. (2010) and Sandquist et al. (2011).
A visual comparison of the distribution of stars near the turn-off point with isochrones shows that the cluster age should be somewhere between 2.5 and 3.0 Gyr. In the region of red giants, the 3.0 Gyr isochrone seems to be preferable. However, if we shift the isochrones by 0.2 mag upward (up to the coincidence with the observed ZAMS), then the 3.0 and 3.5 Gyr isochrones become favoured. Also, if the four stars at the hook of the upper isochrone between = 13.8 and 14.0 mag are binaries or non-members, the 3.0 Gyr isochrone would well represent its hook stars at 14.2–14.4 mag. The bluest star on the 2.5 Gyr isochrone, No. 239 (V1, F5 V), is really the binary, eclipsing variable and probable non-member (Sandquist et al. 2011, 2013). Consequently, there are good reasons to consider that the age of NGC 7142 is close to 3.0 0.5 Gyr.
7 Extinction vs. distance and its surface distribution
The vs. diagram for 507 stars in the direction of NGC 7142, derived from the data of Table 2, is shown in Fig. 5. It includes both field stars and the cluster members. At low distances the extinction increases gradually up to 1.0–1.2 kpc reaching the values between 0.8 and 1.5 mag. At this distance range the line of sight should cross the outskirts of the dust cloud TGU H645 P2 in which the nearby young cluster NGC 7129 is embedded. At larger distances no extinction rise is expected since at this Galactic latitude our line of sight recedes from the Galactic dust layer near its plane. At a distance of 1.2 kpc the line of sight is already 200 pc above the plane.

The vertical bar of stars in Fig. 5 at = 2.3 kpc and between 0.8 and 1.35 mag is formed by the cluster members, mostly by F5-G0 stars for which the absolute magnitudes were calculated as described in Section 5.
In the area, the maximum number of stars with two-dimensional spectral types falls on 17–18 mag. Most of them are main-sequence stars of spectral classes F and G. The three broken curves in Fig. 5 demonstrate the effect of limiting magnitude for F5 V stars with magnitudes between 17.5 and 18.5. Above the upper curve, only B- and A-type stars, as well as G-K-M giants can be found. These types of stars are rare in this area.
In Fig. 5 we show the surface distribution of the extinction over the area. The 466 stars with the distances above 1.15 kpc (the distance to the dust cloud TGU H645) have been divided into five ranges of the extinction and plotted on the plane of equatorial coordinates as circles of different sizes. The most prominent feature of this map is the filamentary distribution of stars with almost empty spaces between them. This feature is also well seen in CCD exposures with different filters. Also, the stars in some of these chains and groups exhibit similarity of extinctions. However, it is too problematic to locate large-scale boundaries between subareas with similar values of extinction since the picture is too mottled.

8 Discussion
In the present investigation we find the following parameters of NGC 7142: the mean extinction = 1.1 mag (corresponding to = 0.28 or = 0.35), the distance 2.3 kpc (the true distance modulus 11.8) and the age close to 3.0 Gyr. The value of the distance is not completely independent, since it is based on the five RCGs identified by Sandquist et al. (2011) and confirmed in the present paper. The parameters of the cluster are in a good agreement with the Sandquist et al. results based on BVI and partly on JHK photometry. However, in our case the results are obtained in a completely different system which allowed us to classify stars in spectral and luminosity classes and apply their individual dereddening. Therefore the resulting parameters of the cluster should be more reliable.
In most earlier investigations the parameters of NGC 7142 were compared with the parameters of other old metal-rich clusters, mostly with M67. According to the latest estimates (Salaris et al. 2004; Cheng et al. 2012), the age of M67 is 4.3 Myr, i.e. it is somewhat larger than our value for NGC 7142. Since the reddening of M67 is small and well known, and the NGC 7142 stars in our study are individually dereddened, we may directly intercompare intrinsic colour indices of stars at turn-off points of both clusters. In our earlier study (Boyle et al. 1998) it was found that the turn-off point of M67 is at = 0.50, this corresponds to the spectral class close to F8, while in the present paper for NGC 7142 we have this colour at 0.46, corresponding to the spectral class F5. This can be interpreted that M67 is really older because metallicities of both clusters are not very different.
Another feature in the colour-magnitude diagram, depending on the age, is the presence or absence of stars on the horizontal part of the sequence of subgiants joining the hook above the turn-off point and the lower part of the giant sequence. This sequence in the clusters younger than M67 is located in the lower part of the Hertzsprung gap and is empty. In NGC 7142 such stars are also absent, while in M67 the subgiant sequence is well populated. The stars on the subgiant sequence of NGC 7142 could not be lost in the dereddening process since the reddening lines in the CMD are approximately parallel to this sequence.
Recently, Sandquist et al. (2013) estimated the age of the detached eclipsing binary V375 Cep, a member of NGC 7142, using the masses and radii of the components determined by modelling radial velocity and light curves of the system. The measured mass and radius of the primary component gives an age of 3.3–3.6 Gyr. The lower limit of this age is not very different from our value of 3.0 Gyr, which is also not very accurate due to the input physics used in computing the isochrones and their transformation to the observational CMD with the theoretical model atmospheres and synthetic spectral energy distributions. The star V375 Cep was not included in Table 2 since its color indices, determined from our CCD frames in different filters, have been exposed in different variability phases. For the estimation of colour excess of V375 Cep, we selected the exposures where the star is the brightest in the and passbands (both components are visible). In these exposures, the average values of and – are 16.090 and 0.739, respectively.
The combined intrinsic colour of V375 Cep was calculated in the following way. The masses of the components in the Sandquist et al. (2013) model correspond to the main-sequence stars of spectral classes F4 and G9. Taking the absolute magnitudes in the and passbands for these spectral types, we have found the combined intrinsic colour index of the binary, = 0.45, which gives = 0.29 or = 0.36, i.e., the value which is very close to the average colour excess of the cluster. The star is plotted in the intrinsic colour-magnitude diagram (Fig. 4) with its extinction-corrected magnitude at maximum brightness and the combined intrinsic colour. Four other eclipsing variables from the Sandquist et al. (2011) list, probably non-members, are also plotted.
9 Results and conclusions
1. Medium-band seven-colour photometry of 1037 stars in the 13 13 area in the direction of the cluster NGC 7142 in Cepheus is accomplished.
2. For 507 stars, using the interstellar reddening-free -parameters, photometric spectral and luminosity classes in the MK system are determined. Down to = 18.5 mag, the amount of classified stars is about 80% of the observed stars.
3. The cluster distance, 2.30 0.16 kpc, is estimated using five red clump giants from their photometric data in the Vilnius and 2MASS systems. Taking into account the errors of absolute magnitudes 0.5 mag, possible members of the cluster in the range of distances between 1.8 and 2.9 kpc are selected. More members close to the red giant sequence were added from their membership estimations from radial velocities. The total number of the possible cluster members is 255.
4. The possible cluster members, plotted in the dereddened colour-magnitude diagram together with the Padova isochrones, are applied to estimate the age of NGC 7142 which is found to be 3.0 0.5 Gyr. In the diagram, five possible red clump giants, two asymptotic branch stars and four blue stragglers are identified.
5. The interstellar extinction vs. distance diagram is plotted for all stars of the field classified in spectral and luminosity classes. The mean extinction in the direction of the cluster is found to be close to 1.1 mag corresponding to 0.35. The range of variability of the extinction across the cluster area is about 0.4 mag.
6. The surface distribution of extinction in the area is quite mottled but some small areas with the larger or smaller extinction than the average can be identified. The distribution of stars in the area is filamentary, with a number of patches free of stars.
7. For the eclipsing variable V375 Cep, a cluster member, the extinction is found to be = 0.29 or = 0.36, which is close to the average value for the cluster.
Acknowledgements
The use of the Simbad, WEBDA, ADS, SkyView and Padova databases is acknowledged. We are grateful to Eric L. Sandquist for sending us his photometric catalogue, to Léo Girardi for the calculation of isochrones in the Vilnius system and to the referee for important comments. The project is partly supported by the Research Council of Lithuania, grant No. MIP-061/2013.
References
- Alves (2000) Alves D. R., 2000, ApJ, 539, 732
- Asplund et al. (2009) Asplund M., Grevesse N., Sauval A. J., Scott P., 2009, ARA&A, 47, 481
- Boyle et al. (1998) Boyle R. P., Kazlauskas A., Vansevičius V., et al., 1998, Baltic Astron., 7, 369
- Bressan et al. (2012) Bressan A., Marigo P., Girardi L., et al., 2012, MNRAS, 427, 127
- Caffau et al. (2011) Caffau E., Ludwig H.-G., Steffen M., et al., 2011, Solar Phys., 268, 255
- Carraro et al. (1998) Carraro G., Ng Y. K., Portinari L., 1998, MNRAS, 296, 1045
- Cheng et al. (2012) Cheng J. Y., Rockosi C. M., Morrison H. L., et al., 2012, ApJ, 746, 149
- Crinklaw & Talbert (1991) Crinklaw G., Talbert F. D., 1991, PASP, 103, 536
- Dobashi et al. (2005) Dobashi K., Uehara H., Kandori R., et al., 2005, PASJ, 57, S1
- Friel (1995) Friel E. D., 1995, ARA&A, 33, 381
- Friel & Janes (1993) Friel E. D., Janes K. A., 1993, A&A, 267, 75
- Friel et al. (1989) Friel E. D., Liu T., Janes K. A., 1989, PASP, 101, 1105
- Geisler et al. (1991) Geisler D., Claria J. J., Minniti D., 1991, AJ, 102, 1836
- Grocholski & Sarajedini (2002) Grocholski A. J., Sarajedini A., 2002, AJ, 123, 1603
- Hoag et al. (1961) Hoag A. A., Johnson H. L., Iriarte B., et al., 1961, Publ. US Naval Obs., 17, 343
- Jacobson et al. (2007) Jacobson H. R., Friel E. D., Pilachowski C. A., 2007, AJ, 134, 1216
- Jacobson et al. (2008) Jacobson H. R., Friel E. D., Pilachowski C. A., 2008, AJ, 135, 2341
- Janes & Hoq (2011) Janes K. A., Hoq S., 2011, AJ, 141, 92
- Janes & Phelps (1994) Janes K. A., Phelps R. L., 1994, AJ, 108, 1773
- Johnson et al. (1961) Johnson H. L., Hoag A. A., Iriarte B., et al., 1961, Lowell Obs. Bull., 5, 133
- Kazlauskas et al. (2006) Kazlauskas A., Straižys V., Bartašiūtė S., et al., 2006, Baltic Astron., 15, 511
- Kun et al. (2008) Kun M., Kiss Z. T., Balog Z., 2008, Handbook of Star Forming Regions, Volume I. ed. Reipurth, B., p. 136
- Laugalys et al. (2004) Laugalys V., Kazlauskas A., Boyle R. P., et al., 2004, Baltic Astron., 13, 1
- Maskoliūnas et al. (2012) Maskoliūnas M., Zdanavičius J. M., Zdanavičius K., Straižys V., 2012, Baltic Astron., 21, 465
- Perryman et al. (1997) Perryman M. A. C., Lindegren L., Kovalevsky J., et al., 1997, A&A, 323, L49
- Phelps et al. (1994) Phelps R. L., Janes K. A., Montgomery K. A., 1994, AJ, 107, 1079
- Roeser et al. (2010) Roeser S., Demleitner M., Schilbach E., 2010, AJ, 139, 2440
- Salaris et al. (2004) Salaris M., Weiss A., Percival S. M., 2004, A&A, 414, 163
- Sandquist et al. (2011) Sandquist E. L., Serio A. W., Shetrone M., 2011, AJ, 142, 194
- Sandquist et al. (2013) Sandquist E. L., Shetrone M., Serio A. W., Orosz J., 2013, AJ, 146, 40
- Schlegel et al. (1998) Schlegel D. J., Finkbeiner D. P., Davis M., 1998, ApJ, 500, 525
- Sharov (1968) Sharov A. S., 1968, AZh, 45, 693
- Skrutskie et al. (2006) Skrutskie M. F., Cutri R. M., Stiening R., et al., 2006, AJ, 131, 1163
- Straižys (1992) Straižys V., 1992, Multicolor Stellar Photometry. Pachart Publishing House, Tucson, Arizona
- Straižys et al. (2013) Straižys V., Boyle R. P., Janusz R., et al., 2013, A&A, 554, A3
- Straižys & Lazauskaitė (2009) Straižys V., Lazauskaitė R., 2009, Baltic Astron., 18, 19
- Twarog et al. (1997) Twarog B. A., Ashman K. M., Anthony-Twarog B. J., 1997, AJ, 114, 2556
- van den Bergh (1962) van den Bergh S., 1962, JRASC, 56, 41
- van den Bergh & Heeringa (1970) van den Bergh S., Heeringa R., 1970, A&A, 9, 209
- VandenBerg et al. (2010) VandenBerg D. A., Casagrande L., Stetson P. B., 2010, AJ, 140, 1020