Unusual Broad-Line MgII Emitters Among Luminous Galaxies in BOSS
Abstract
Many classes of active galactic nuclei (AGN) have been observed and recorded since the discovery of Seyfert galaxies. In this paper, we examine the sample of luminous galaxies in the Baryon Oscillation Spectroscopic Survey (BOSS). We find a potentially new observational class of AGN, one with strong and broad MgII Å line emission, but very weak emission in other normal indicators of AGN activity, such as the broad line H, H, and the near-ultraviolet AGN continuum, leading to an extreme ratio of broad H/MgII flux relative to normal quasars. Meanwhile, these objects’ narrow-line flux ratios reveal AGN narrow-line regions with levels of activity consistent with the MgII fluxes and in agreement with that of normal quasars. These AGN may represent an extreme case of the Baldwin effect, with very low continuum and high equivalent width relative to typical quasars, but their ratio of broad MgII to broad Balmer emission remains very unusual. They may also be representative of a class of AGN where the central engine is observed indirectly with scattered light. These galaxies represent a small fraction of the total population of luminous galaxies (%), but are more likely (about 3.5 times) to have AGN-like nuclear line emission properties than other luminous galaxiess. Because MgII is usually inaccessible for the population of nearby galaxies, there may exist a related population of broad-line MgII emitters in the local universe which are currently classified as narrow-line emitters (Seyfert 2s) or LINERs.
Subject headings:
galaxies: active — galaxies: Seyfert — quasars: emission lines1. Introduction
Astronomers have concluded that most, and possibly all, massive galaxies contain supermassive black holes at their centers. The accretion of gas onto these black holes emits light, in continuum and line emission — in such cases the black hole is referred to as an active galactic nucleus (AGN). We believe the geometry of gas and dust around AGN is complex, leading to substantially different observational signatures depending on viewing angle and other factors. In addition, the bolometric luminosity and spectrum depend strongly on the amount of fuel available for accretion.
The Eddington ratio of an AGN is a useful quantification of its activity. For luminous quasars , but at low redshift most supermassive black holes spend most of their time with much lower activity (–). These low-luminosity AGN are thought to have a different physical structure and emission mechanism. In particular, given estimates of the available mass for accretion, it appears inevitable that they are radiatively inefficient, which at least partly explains their low luminosity.
At low luminosities, several studies suggest that AGN do not exhibit broad-line regions (Ho, 2008). Although the effect in Ho (2008) is probably dominated by Low Ionization Nuclear Emission-line Regions (LINERs), whose status as AGN is controversial (Yan & Blanton 2012; Sarzi et al. 2010), the same effect is seen for Seyfert nuclei as well (Elitzur & Ho 2009). In addition, low luminosity AGN lack the “big blue bump” in the ultraviolet-optical range, thought to be indicative of emission from the inner accretion disk, and are instead dominated by mid-infrared energy output. Finally, underluminous quasars exhibit the Baldwin Effect in a number of broad emission lines: the equivalent widths of these lines decrease with increasing luminosity (Baldwin 1977; Boroson et al. 1993; Thompson et al. 1999). This last trend appears consistent with the low ultraviolet-optical emission for very low luminosity AGN.
The Seyfert classification scheme, based on Balmer line widths, differentiates galaxies according to the region emitting the observed lines. Broad lines, produced in the high velocity dispersion region within a few parsecs of the black hole, are frequently obscured by a presumed dust torus surrounding the AGN. Most of the time this dusty torus completely hides the broad line region — however, sometimes the broad line region remains visible (at least partially) due to light scattering into our line of sight off of material near the AGN. However, in all cases, the narrow line region extends to 100s of parsecs, outside the dusty region of greatest obscuration. Therefore, observationally AGN fall into two rough classes, Seyfert 1 galaxies with both broad and narrow hydrogen lines, and Seyfert 2 galaxies with only narrow-line hydrogen emission.
Variations in the relative strength and visibility of the Balmer lines have led some investigators to define more detailed subdivisions of Seyferts. Seyfert 1.5 galaxies have moderate-strength broad H and H; Seyfert 1.8 have weak broad H and H; and Seyfert 1.9 have weak broad H and only narrow H (see Osterbrock & Ferland 2006; Ho 2008).
In this paper, we search the Baryon Oscillation Spectroscopic Survey (BOSS; Dawson et al. 2012) sample of target galaxies for broad MgII 2799Å emission. BOSS’s large wavelength coverage and its target redshift distribution permits coverage of the MgII line at its 2799Å vacuum rest frame wavelength region for a large fraction of its objects.
We find a new spectral class of AGN with broad MgII 2799Å emission, but apparently extremely low near-ultraviolet continuum luminosity and broad-line Balmer emission. These galaxies appear to be even closer spectroscopically to Seyfert 2 galaxies than the Seyfert 1.9s are — with no visible broad H or H, but a broad component in MgII indicating AGN activity.
2. Sample Selection and Line Fitting
BOSS (Dawson et al. 2012) is part of the Sloan Digital Sky Survey III (SDSS-III; Eisenstein et al. 2011) and is designed to measure the large-scale structure of the universe by observing many luminous galaxies up to redshift . In the process of doing so, it takes spectra of a very large (1.5 million) sample of galaxies, allowing the discovery of unusual objects. In addition, BOSS’s observed wavelength coverage (3600 to 10400 Å) and redshift range allows us to observe the MgII line (as measured in the vacuum) for a much larger sample than possible with the SDSS-II target galaxy sample (which had wavelength coverage between 3800 and 9200 Å and a redshift limit ).
We selected objects from BOSS galaxy targets observed prior to January 2011, originally picked from the v5_4_14 reductions but updated to now use the v5_4_45 spectroscopic reductions corresponding to Data Release 9 (Ahn et al. 2012). We restrict the sample to redshifts, , for which both MgII and H are within the BOSS spectral window (around 250,000 objects). Most of the LRGs in the BOSS data have , so extending the limit to only adds a small number of objects.
We locate strong, broad-line MgII 2799Å emitters in these spectra by fitting a model consisting of a stellar continuum plus emission lines. The stellar continuum is composed of eleven Chabrier IMF stellar models of differing ages (13 Gyear to 0.1 Gyear), as detailed in Bruzual & Charlot (2003). We find the best-fit linear combination of these models to the observed continuum spectrum, with all non-stellar emission line regions masked. Next, we fit the residuals around each individual line region independently, with a single Gaussian model, whose width, center, and flux are allowed to vary within reasonable limits. In the region around H, instead of independently fitting the emission lines, we fit the [NII] doublet and the H lines simultaneously with three Gaussians. In the fits described here, we model each line with just a single Gaussian regardless of whether we expect both broad/narrow components to exist.
After we perform this fit, we select galaxies based on their MgII Å properties in the v5_4_14 reductions. We select all galaxies that have a signal-to-noise ratio of at least and Å in the rest frame after de-redshifting the spectra (corresponding to a velocity dispersion of approximately km/s at ).As an important note, in the update to v5_4_45, the inverse variance recorded in the spectra was decreased by approximately a factor of 2 in all spectra, rendering the criteria used for this selection inaccurate for later versions — to select a similar sample, we would need to reduce the signal-to-noise criteria by a factor of about 1.4. Finally, if the software was unable to correctly fit the MgII line in a candidate luminous galaxy, we rejected the object (indicated by the line width returning its maximum value, Å ) This selection method ensures that only galaxies with real MgII detections remain in the sample — some real and weak lines may be thrown out (rejecting all objects with Å removes about 150 objects, many of which may not have passed the visual inspection performed afterwards anyway), but the remaining sample we study will be as close to pure as possible. With these criteria, we pre-selected around 700 galaxies out of the BOSS sample.
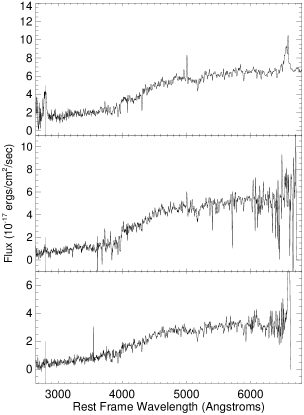
Finally, we examined each of the spectra visually, inspecting the MgII line to see if it was a visually convincing strong line, and that the fit to the data was reasonable. If the fit was unreasonable, or the line extremely weak but broad (indicating a potential problem with continuum subtraction), we dropped the galaxy from the sample. This process eliminated about half of the previous galaxies, leaving us with a sample of 293 galaxies that show broad MgII lines that were both clearly visible and well-fit by our software. Some examples of these are shown in Fig. 1 to show the varied types of MgII lines that qualified as “strong” in this paper’s sample. To better compare properties discussed later in the paper, we then split the sample in half based on redshift alone, into one set of luminous galaxies with (those with the H line in the spectral coverage) and one set of luminous galaxiess with (those without the H line).
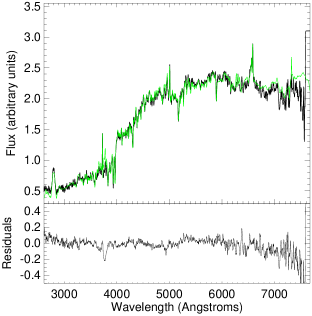
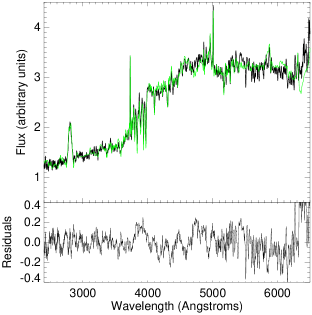
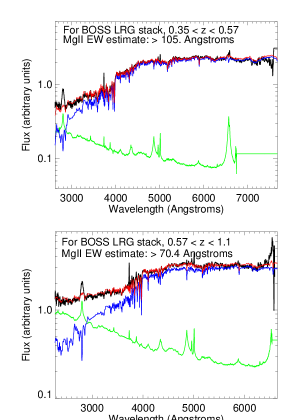
Because these spectra are not individually high enough signal-to-noise ratio to measure line fluxes and continuum levels precisely, we de-redshifted and stacked the two subsets of the BOSS data. The results of this stacking are shown (smoothed) as Figs. 2 and 3 in black. We fit the same model described earlier for the individual spectra to each stacked spectrum; the figures show the result in green. As the residuals show, the fitting method is successful at matching the spectra with a stellar continuum + Gaussian emission lines, with the only major discrepancies arising on the red end of the spectra.
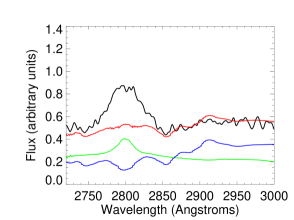
The spectra show very strong MgII, but the other common lines expected in AGN are less obvious and only appear to contain narrow-line flux. For H, the amount of measured flux corresponds to what would be expected based on the H ratio. However, because of the underlying stellar absorption, the line is only weakly apparent under visual inspection. The H and [NII] complex is distinct in Fig. 2 (or for a closer view, see Fig. 4), but only the narrow components of these lines are detected (H km/s, H km/s). Finally, despite selecting strong MgII emitters that are presumed luminous galaxies hiding AGN, the ultraviolet continuum is well described by stellar continuum, without much of a rise at the blue end as a typical quasar power law model would predict.
3. What type of quasars are these?
3.1. Are the narrow lines consistent with AGN?
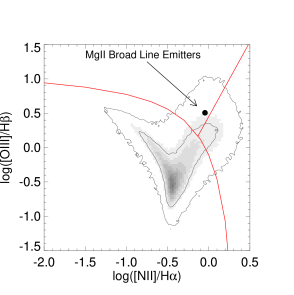
With the sample of luminous galaxies selected from BOSS identified, the question now becomes “what type of quasars are these?” A first step in understanding these objects is making a BPT diagram (as in Baldwin et al. 1981) with the subset that have spectra covering H. This is shown in Fig. 5, along with the standard theoretical divisions from Kewley et al. (2001) and Kauffmann et al. (2003). The stack falls into a Seyfert classification, though it lies rather close to the conventional dividing line between Seyferts and LINERs. However, as Table 1 shows, many of the objects do not have at least one of the four lines measured, either due to low signal-to-noise in the individual spectra or redshift shifting the line out of the spectral range. For the objects with all lines, though, it’s clear that AGN-like emission (either Seyfert or LINER) is more common in these MgII emitters than in the luminous galaxy population as a whole.
| All Luminous Galaxiess | MgII Emitters | ||
|---|---|---|---|
| Total Number | 252228 | 293 | |
| Missing 1+ BPT Line | 206849 (81.9%) | 171 (58.4%) | |
| Starbursts | 26843 (10.6%) | 44 (15.0%) | |
| LINERs | 13770 (5.5%) | 58 (19.8%) | |
| Seyferts | 4826 (1.9%) | 20 (6.8%) |
3.2. Where are the broad Balmer lines?
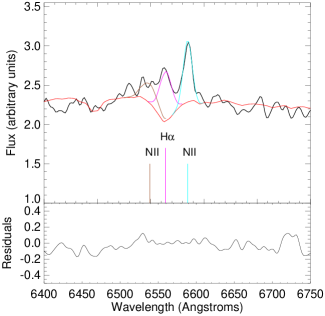
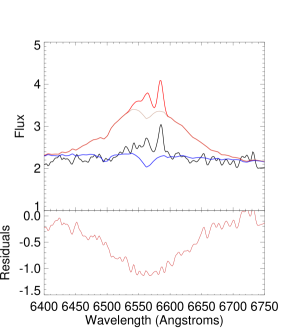
Despite this evidence of the existence of the narrow-line region of a quasar, the H line and H line do not appear as strong and broad as the Mg II line. In principle the broad component could be present but not easily visible. In this section we will use line ratios from SDSS quasars to predict what we expect for broad lines in our BOSS objects, and also compare various broad:narrow and broad:broad lines to search for significant discrepencies in the hope of further understanding our BOSS sample. First, to test whether these broad lines are present, we considered the set of quasars in the DR7 catalog (Shen et al., 2011) with both broad and narrow H lines detected — approximately 4600 objects. Assuming that the ratio of narrow H flux to broad H flux is consistent in most quasars, and that the DR7 catalog has objects comparable to the ones we are considering in BOSS, we can predict what the broad H flux would be in our BOSS stacked spectrum from the observed narrow-line flux. We find that on average, the SDSS quasars with both broad and narrow H measured have a narrow line to broad line flux ratio of at least 1:10 in H. When we apply that same ratio to the observed H narrow line in the AGN in our sample of luminous galaxies in BOSS, we can quickly see that the broad line emission (if present) would be clearly visible to us — and so while there may be small amounts of broad line flux present, it is certain that these objects have a much smaller ratio of broad-to-narrow H than the Shen quasar sample. Fig. 6 shows what we would expect to see if we had the “proper” amount of broad H in these quasars given the measured narrow H. The key to this is the standard [NII] doublet at 6550 and 6589 Å, as the redder line in the doublet is clearly visible, forcing the blueward line to have a well-defined flux to be close to the normal ratio (approximately 3:1). However, the [NII] 6550 line is weak in our sample, and this constraint on [NII] 6550 strongly limits the strength of any broad feature underlying the H-[NII] complex.
| 0.35 z 0.57 | z 0.57 | ||
|---|---|---|---|
| Objects | N. H/MgII | [OIII]/MgII | [OIII]/MgII |
| BOSS galaxiess | 0.3060.01 | 0.2800.007 | 0.2440.006 |
| SDSS quasars | 0.458 | 0.149 | 0.091 |
| SDSS quasars | |||
| (high MgII EW) | 0.160 | 0.113 | 0.112 |
| 0.35 z 0.57 | ||
| Objects | Broad H/MgII | Broad H/Narrow H |
| BOSS LRGs | 0.101 | 0.330 |
| SDSS quasars | 2.85 | 36.6 |
| SDSS quasars | ||
| (high MgII EW) | 1.29 | 42.8 |
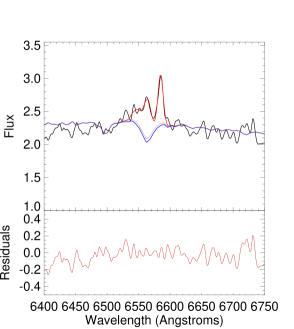
In addition to this test, we consider how much broad H we could possibly allow, to quantitatively determine how close our narrow-to-broad ratio is to that in the Shen quasar sample. We adjusted our fitting routine to fit 4 Gaussians around the H + [NII] complex — one for each [NII] line, and a broad and narrow H. Because our fit was very good to the narrow lines, we fix the widths of the two [NII] Gaussians and the narrow H line. Since we believe the MgII line accurately traces the broad line region as well, we fixed the width of the broad H line to that value, because both lines should be produced in a similar environment. In the end, then, our fitting program only can adjust the relative amounts of flux in the four Gaussians in its attempt to model the spectrum. We find in Fig. 7 that very little broad H can be hidden under the continuum.
Table 2 shows a comparison of some of the line ratios between the luminous BOSS galaxies and the SDSS quasars. We compared various narrow:broad line ratios in our BOSS objects, the full set of SDSS quasars, and the subselected set of SDSS quasars described later in Sec. 3.4. Because we already found a difference in the ratio of narrow H to broad H, we examined whether the discrepency persisted in other ratios. Table 2 shows a far smaller, but by no means negligible, level of discrepancy. We consistently find a modestly higher flux of [OIII] narrow-line emission relative to broad MgII (qualitatively similar to the high narrow-to-broad H ratio, but a much smaller quantitative effect). We also find that considering a subset of SDSS quasars with similarly large MgII EW gives us much smaller flux ratios, as the amount of MgII flux has increased without a change in the other line on average. Based on this table, our luminous BOSS galaxies seem similar to ordinary SDSS quasars in their properties, except for their apparently very low broad H flux.
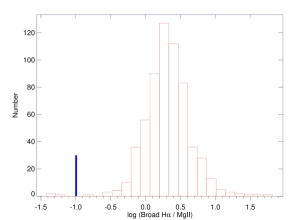
However, the more interesting results come in comparing broad:broad line ratios, as Table 3 does. Here we find an extreme difference - the ratio of broad H to MgII is exceptionally small in our BOSS objects compared to the Shen sample, both the selected subset and the entire sample. To show the magnitude of this, Fig. 8 shows the distribution of this ratio for all Shen objects with both lines detected (the mean and standard deviation of which are presented in Table 3). Only 7 or so objects are as extreme in this flux ratio out of the nearly 650 objects in the Shen catalog that have both lines detected, suggesting that this object is far from the norm in this ratio. Similarly when comparing the broad H flux to the narrow H flux, we find that the BOSS objects are quite low in comparison to the Shen sample — the ratio is about 3:1 narrow to broad rather than the 1:30 narrow to broad found from the Shen quasars. These results combined, in addition to what we visually found by fitting the spectrum in Fig 7 suggests that the broad H flux is strongly suppressed, an unexpected result given how strong and broad the MgII line is.
Most notable in the results from these two tables is lack of any dramatic discrepency between the ratios of broad MgII and narrow H when compared to the SDSS quasars, combined with the large difference found between broad H and narrow H discussed above. Together, these results imply that the broad H is very strongly suppressed even with respect to broad MgII.
3.3. Where is the continuum flux?
Next, we compared the two spectra in more detail to that of known SDSS quasars, again taken from the catalog of Shen et al. (2011). To do this, we created a “typical” SDSS quasar by splitting the quasars into the same two groups based on spectral coverage of H, H, and MgII as described previously and then stacking them (for these objects, the corresponding redshift ranges are and ). Because the BOSS target galaxiess were identified primarily as luminous galaxies and had a strong and easily fit stellar continuum component, to best determine how much of the flux was from the quasar component we took both the SDSS quasar stack and the stellar continuum models from earlier (shown in Figs. 2 and 3), and combined them into one 12-component model with which we refit our stacked spectra. The model parameters reveal how much continuum can be attributable to the stars in the luminous galaxy and how much can be attributable to the quasar, as well as estimate or place a limit on the equivalent width of MgII relative to the quasar continuum. Fig. 9 shows these results for the H and no-H stacks.
The details of the quasar component of the best-fit model are not particularly well constrained, and it is better to express the results as an upper limit on the component that can be coming from a typical quasar. To do so, we evaluated the 95% confidence limit based on the increase in as we increased the quasar amplitude. This limit is shown as the green line in Figure 9.
These figures suggest that these luminous galaxies, despite their broad MgII emission, do not have typical quasar spectra. The ultraviolet continuum in Figure 10 is sufficiently well-explained by the stellar emission such that the much bluer quasar continuum is forced to low amplitude in our best-fit model (the vertical scale is logarithmic in these figures).
Spectrophotometric calibration is a potential concern; the systematic uncertainties in the ultraviolet due to calibration are likely to be larger than the statistical errors. To test for such issues issues, we also attempted modeling the stacked spectra with the 12 components described above, and two additional components, one constant and one linear in wavelength, to allow the spectrum to tilt a bit. While this did indeed produce a somewhat better fit with a greater contribution from the quasar model, it also required that we have fluxing errors on the order of a factor of two at the blue end of the spectrum (below 4000 Å mostly), far more than should be expected in these spectra (around 10% at most).
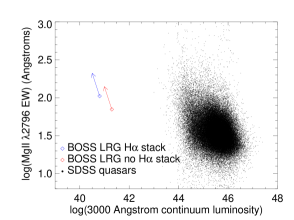
3.4. What do the continuum limits tell us?
Now noting that the AGN portion of the continuum is apparently very low, we wanted to see if the large MgII flux is possibly an extension of the Baldwin Effect as described in Baldwin (1977) in an extreme case of very low continuum. We calculate the equivalent width (EW) of the MgII Å line by using the line flux found in our line fitting procedure from earlier, and take the 95% confidence maximum quasar continuum as our continuum value. Fig. 11 shows that the luminous BOSS galaxies are indeed low continuum and high MgII flux. Because our measurement of the AGN continuum is an upper limit, we show the luminosity and EW in this plot as a 95% confidence limit. Thus, although these luminous galaxies are certainly not similar spectroscopically to the Shen catalog of SDSS quasars, they do following a known trend for quasars and are conceivably just an extreme but not unknown case.
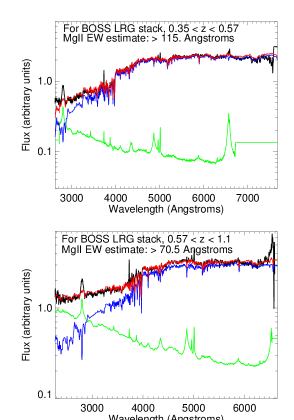
To further examine this comparison of large MgII EW quasars to our BOSS galaxies, we then selected the subset of quasars from the Shen catalog that have large MgII equivalent widths, potentially the closest subset to the luminous BOSS galaxies we are examining. Few are as extreme as the luminous BOSS galaxies in both EW and luminosity, but if our objects are best compared to quasars with large MgII EW, then performing the same fit from before with only large MgII EW SDSS quasars should result in a better match for both the continuum and emission lines. This alternative fit is shown as Fig. 12. Here we see progress in matching the spectra, especially in the bottom panel where our model seems to explain the data relatively well, but note that the top panel still shows a significant MgII flux deficit, suggesting that possibly our objects require the most extreme MgII EW quasars to be explained. Also of note is that this subset of quasars still does not address the issues around the missing broad H. Other subsets of the Shen catalog were considered (objects with small broad H/MgII ratio, objects with low Eddington ratio, and objects with the broadest MgII lines), but none of these approaches led to improved fit qualities in any of the lines or continuum regions.
3.5. Should we expect a broad line region?
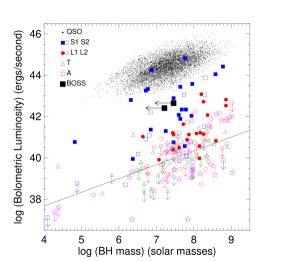
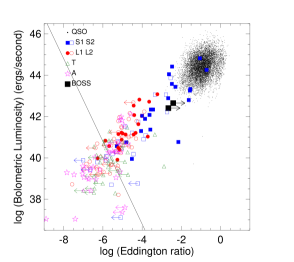
The broad line regions in these luminous galaxies appear unusual, with a very low broad-line flux in the Balmer lines; in addition, the AGN have a remarkably low continuum. Elitzur & Ho (2009) found that given a BH mass, there was a bolometric luminosity below which no broad-line regions were found in the H and H lines. The question arises whether, given the result of Elitzur & Ho (2009) and the observed narrow-line fluxes, we should have expected our MgII emitting luminous galaxies to have broad-line regions, or whether Elitzur & Ho (2009) would have predicted no broad line region.
To do so, we use the MgII line and Å continuum luminosity to estimate a black hole (BH) mass, following the prescription given in Wang et al. (2009). Our Å continuum luminosity is obtained from the 95% confidence maximum quasar continuum in the fits displayed in Fig. 9. This procedure yields an upper limit on the BH mass. Once the BH mass is obtained, we calculate its Eddington luminosity. Finally, we derive a bolometric luminosity from the [OIII] Å line using the relation derived in Heckman et al. (2004), and then compute the Eddington ratio used in Figure 1 of Elitzur & Ho (2009). Note that as these measurements were derived from a 95% confidence continuum, they correspond to a maximal BH mass and a minimum Eddington ratio respectively, and are plotted as limits rather than data points. Figs. 13 and 14 reproduce Figure 1 from Elitzur & Ho (2009) with our data added as large black points, with arrows showing the direction of the minimal/maximal uncertainties explained above.
All these estimates are made on the basis of the MgII line because the other, more commonly used lines are much weaker. Based on our findings above, these objects are unusual, and therefore the black hole masses and Eddington ratios estimates may be incorrect. In fact, we present some evidence for these black holes masses being somewhat underestimated below. Nevertheless, given the bolometric luminosities from [OIII], the black hole masses would have to be larger than any known black holes in the universe to violate the relation given in Elitzur & Ho (2009).
These results suggest that the broad-line regions in these luminous galaxies are safely consistent with the luminosity limits presented in Elitzur & Ho (2009). However, it is notable that these luminous galaxies are missing this BLR evidence in H and H, which for most local samples are the only accessible lines. It is possible that some galaxies in the local Universe currently classified as Seyfert 2s actually house a detectable MgII region — potentially even some of those below the threshold determined in Elitzur & Ho 2009.
3.6. Radio properties
Here we investigate the radio properties of our sample galaxies, and compare to typical broad-line radio galaxies (BLRGs). Rafter et al. (2011) investigated radio properties of confirmed broadline AGN in SDSS in an attempt to correlate radio loudness with other properties. To compare our sample with theirs, we searched the FIRST catalog for objects in our sample with FIRST detections. Very few objects appeared in both — only 4 distinct objects of the 293 had matches in FIRST within 0.5 arcseconds that were brighter than 3 mJy integrated radio flux. Four other objects were found with very weak radio flux and are also included, but they are barely above the detection limit — clearly not strong radio emitters. Despite several similar optical spectra, our sample does not appear to be similar to the BLRGs discussed in Rafter et al. (2011) on the whole.
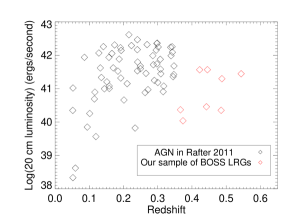
However, it is worth noting that the objects that do have radio detections are of similar luminosities as the sample in Rafter et al. (2011). Fig. 15 shows both sets of objects plotting redshift versus luminosity. Since our objects are higher redshift, it is possible that the reason fewer are detected was a selection effect in FIRST; this appears to not be the case, however, because we are missing objects in the high luminosity range as well. Although our objects may end up being physically similar to typical BLRGs, they are typically lower radio luminosity.
3.7. Position relative to the - relation
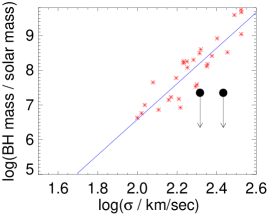
As a comparison to other black holes, we can place these stacked objects from BOSS on the relationship between black hole mass and stellar velocity dispersion. However, not every one of the luminous galaxies has a recorded stellar velocity dispersion, so our data needed some slight modification. To avoid biasing the estimated black hole mass due to a systematic reason for an unmeasureable stellar velocity dispersion, for this plot we added one more cut before stacking the objects, measuring line and continuum fluxes, and calculating a black hole mass. This new cut removed all objects that did not have an estimated stellar velocity dispersion — although this is a small percentage of the total objects we kept, it has a non-negligible effect on the upper limit BH mass estimate. Fig. 16 shows where our objects lie, with the caveat as previously mentioned that we can only estimate an upper limit on the black hole masses due to the very weak AGN continuum.
Fig. 16 suggests quite strongly that for these luminous BOSS galaxies, the standard prescriptions (such as that of Wang et al. 2009) for deriving a black hole mass from MgII do not work well. However, it is important to note that these values assume we are seeing the entire flux from the relevant lines. In section 3.9, we will note that perhaps our objects have scattered broad line flux and are not seen directly, and perhaps these estimates are too low for that reason. By not seeing the broad line region directly, we may not see the entirety of the MgII flux that is produced, and so our estimates depending on the fluxes in any broad lines could be underestimates. For normal (viewed directly) objects, MgII provides consistent (with H) BH masses (see Matsuoka et al. 2013; Onken & Kollmeier 2008; McGill et al. 2008). However, in our sample we find much smaller black hole masses than the - relation predicts. If the MgII line remains accurate as a BH mass indicator in these objects, they fall below the typical masses given the velocity dispersions of the galaxies, by much more than the scatter in the relationship.
3.8. Dust properties in the narrow line region
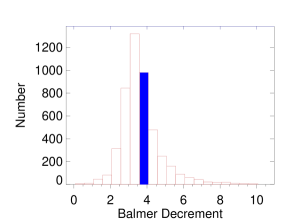
For the subset of the luminous galaxies in this sample observed between redshifts and , we can calculate the Balmer decrement in the narrow-line fluxes, to estimate the degree of interstellar reddening of the narrow-line region. A very reddened narrow-line region would be suggestive of an unusual geometry or very dusty system, which might allow us to attribute the lack of broad Balmer lines to these properties of the system as well (though it would still be unusual that MgII was not even more extincted). Typical Seyfert galaxies have a Balmer decrement H/H– (Osterbrock & Ferland 2006) and for our objects we find a Balmer decrements of . Figure 17 shows the distribution of Balmer decrements for typical SDSS quasars; the BOSS objects are near the median of from this distribution. Of course, the fact that the narrow-line region is not unusually affected by dust does not rule out that the broad-line region still might be.
3.9. Scattering and polarization in the broad line region
In the previous section, we noted that no dust reddening was apparent in the narrow-line region. However, as we do not have any visible broad line H or H, we cannot make the same conclusion for the broad line region. It is possible that these objects have a geometry where there is a cloud (internal to the narrow line region, but external to the broad line region) obscuring the broad line region from our direct line of sight.Then, the broad lines we observe could be scattered instead of in direct line of sight of us, while the narrow line emission is unchanged. Objects like this have been observed in the past — see Schmidt et al. (2002, 2007); di Serego Alighieri et al. (1996) among many others recording spectra of these rare but known objects.
Many quasars hidden in galaxies exhibit flat quasar spectra (see especially di Serego Alighieri et al. (1996)) with prominent narrow lines. This is in contrast to a directly viewed, very luminous quasar, which have a power law shape to their continua, but similar to our observed objects (see Fig. 9). At the least, we cannot rule out a flat quasar spectrum to the same degree we can a standard luminous quasar spectrum — objects such as those presented in the above papers would be better fits to our spectra. Unfortunately, none of these previously studied objects have the spectral coverage for both MgII and H, so we are unable to compare the broad line fluxes in both simultaneously. While none of them have such a strong galaxy component in their spectra, the quasar portions of the spectra are potentially very similar.
This flat spectrum can actually be hiding a more standard quasar spectrum in polarized light, as seen in IRAS 09104+4109 (discussed in several papers: see Hines & Wills (1993) and Hines et al. (1999) for details). This object’s unpolarized continuum is nearly flat between 2500 and 6500 Å, but when the polarized flux is examined the object reveals a clear quasar continuum with standard power law slope. It’s quite possible that our objects resemble this, although we cannot confirm that without spectropolarimetry. The most important characteristic of IRAS 09104+4019 is that it, like our objects, had no broad line emission recorded in the Balmer lines in the initial detections in Kleinmann et al. (1988) — as the MgII line was not observed due to wavelength coverage — until it was re-observed with broader band spectrophotometry by Hines and Wills. These followup observations showed similar broad MgII emission to our objects. As IRAS 09104+4109 was eventually found to have broad Balmer line emission in a polarized spectrum, further investigation of our objects with spectropolarimetry may be useful to see if similarities persist.
If the MgII line is being seen via scattered light, and our quasars remain normal in terms of H emission line production, then the efficiency of the scattering of H must be very low relative to that of MgII. We see a large MgII flux already and no definitive broad H — so the scattering properties must be such to emphasize this discrepency (perhaps similar to those in IRAS 09104+4019).
It would be very valuable to examine some of the strongest examples of these objects using spectropolarimetry to see if the MgII line is polarized as this hypothesis would predict, and to confirm the narrow lines are unpolarized as well, as observed in IRAS 09104+4109.
4. Summary
We have found a set of luminous galaxies in BOSS that exhibit unusual properties related to the MgII Å line. Specifically we reach the following conclusions:
-
1.
This sample of galaxies has clear broad MgII line emission, but a much smaller broad H flux ratio relative to MgII than typical for luminous quasars (by a factor of a few tens).
-
2.
This sample of galaxies have narrow Balmer line fluxes and [OIII] flux ratios relative to MgII that are roughly typical for luminous quasars (within a factor of two or three).
-
3.
Galaxies with this property are an extremely small subset of the BOSS sample (%).
-
4.
The continuum flux from the AGN in these luminous galaxies is undetectably low, which means they must have a large equivalent width in the MgII line (possibly consistent with the Baldwin Effect seen for more luminous quasars).
-
5.
Given the - relation, either the MgII based black hole mass indicators used for more luminous quasars do not work for these lower luminosity objects, the black holes in these galaxies are small with respect to the expected mass given their host galaxy, or the light from the BLR is scattered such that we only see a fraction of the MgII emission.
-
6.
The galaxies appear to be low Eddington ratio () given the expected black hole mass.
The physical nature of these objects is unclear. Their lack of low continuum flux may be related to whatever physical cause lies behind the Baldwin Effect, which is itself still under debate. Given how uncommon these galaxies are, some unusual configuration around the black hole may allow obscuration of the continuum but not the broad-line region. Many ideas have been proposed to explain how these and other causes could contribute to the Baldwin effect (see Green et al. 2001 for a discussion), such as disk inclination, luminosity-dependent spectral energy distributions, or changing optical thickness of clouds around the black hole, and it is possible that one or more of these may be at play in our sample.
Why the broad-line Balmer emission remains so weak is also unknown. Differences of this objects from luminous quasars in metallicity or relative ionization fractions are unlikely to cause as large a difference in flux ratios as we observe. We can only offer up the wavelength-dependent scattering of the broad-line region as a possible explanation as to why the broad Balmer lines could be missing and the broad MgII line so strong.
Among known Seyfert 2 galaxies of lower stellar mass than these luminous galaxies, very few have had their rest-frame MgII Å region observed, because the vast majority of known galaxies are at low redshift and MgII is too blue to be observed. The population of broad-line galaxies found here may exist in lower luminosity galaxies as well, in lesser or greater abundance than found for the luminous BOSS galaxies. Therefore, some fraction of galaxies currently classified as Seyfert 2s may have broad-line regions that are observable, but only in the as-yet-unobserved MgII line.
References
- Ahn et al. (2012) Ahn, C. P., Alexandroff, R., Allende Prieto, C., Anderson, S. F., Anderton, T., Andrews, B. H., Aubourg, É., Bailey, S., Balbinot, E., Barnes, R., & et al. 2012, ApJS, 203, 21
- Baldwin (1977) Baldwin, J. A. 1977, ApJ, 214, 679
- Baldwin et al. (1981) Baldwin, J. A., Phillips, M. M., & Terlevich, R. 1981, PASP, 93, 5
- Boroson et al. (1993) Boroson, T. A., Salzer, J. J., & Trotter, A. 1993, ApJ, 412, 524
- Bruzual & Charlot (2003) Bruzual, G. & Charlot, S. 2003, MNRAS, 344, 1000
- Dawson et al. (2012) Dawson, K. S. et al. 2012, ArXiv e-prints
- di Serego Alighieri et al. (1996) di Serego Alighieri, S., Cimatti, A., Fosbury, R. A. E., & Perez-Fournon, I. 1996, MNRAS, 279, L57
- Eisenstein et al. (2011) Eisenstein, D. J., Weinberg, D. H., Agol, E., Aihara, H., Allende Prieto, C., Anderson, S. F., Arns, J. A., Aubourg, É., Bailey, S., Balbinot, E., & et al. 2011, AJ, 142, 72
- Elitzur & Ho (2009) Elitzur, M. & Ho, L. C. 2009, ApJ, 701, L91
- Graham et al. (2011) Graham, A. W., Onken, C. A., Athanassoula, E., & Combes, F. 2011, MNRAS, 412, 2211
- Green et al. (2001) Green, P. J., Forster, K., & Kuraszkiewicz, J. 2001, ApJ, 556, 727
- Heckman et al. (2004) Heckman, T. M., Kauffmann, G., Brinchmann, J., Charlot, S., Tremonti, C., & White, S. D. M. 2004, ApJ, 613, 109
- Hines et al. (1999) Hines, D. C., Schmidt, G. D., & Smith, P. S. 1999, ApJ, 514, L91
- Hines & Wills (1993) Hines, D. C. & Wills, B. J. 1993, ApJ, 415, 82
- Ho (2008) Ho, L. C. 2008, ARA&A, 46, 475
- Kauffmann et al. (2003) Kauffmann, G., Heckman, T. M., Tremonti, C., Brinchmann, J., Charlot, S., White, S. D. M., Ridgway, S. E., Brinkmann, J., Fukugita, M., Hall, P. B., Ivezić, Ž., Richards, G. T., & Schneider, D. P. 2003, MNRAS, 346, 1055
- Kewley et al. (2001) Kewley, L. J., Dopita, M. A., Sutherland, R. S., Heisler, C. A., & Trevena, J. 2001, ApJ, 556, 121
- Kleinmann et al. (1988) Kleinmann, S. G., Hamilton, D., Keel, W. C., Wynn-Williams, C. G., Eales, S. A., Becklin, E. E., & Kuntz, K. D. 1988, ApJ, 328, 161
- Matsuoka et al. (2013) Matsuoka, K., Silverman, J. D., Schramm, M., Steinhardt, C. L., Nagao, T., Kartaltepe, J., Sanders, D. B., Treister, E., Hasinger, G., Akiyama, M., Ohta, K., Ueda, Y., Bongiorno, A., Brandt, W. N., Brusa, M., Capak, P., Civano, F., Comastri, A., Elvis, M., Ho, L. C., Lilly, S. J., Mainieri, V., Masters, D., Mignoli, M., Salvato, M., Trump, J. R., Taniguchi, Y., Zamorani, G., Alexander, D. M., & Lin, Y.-T. 2013, ArXiv e-prints
- McGill et al. (2008) McGill, K. L., Woo, J.-H., Treu, T., & Malkan, M. A. 2008, ApJ, 673, 703
- Onken & Kollmeier (2008) Onken, C. A. & Kollmeier, J. A. 2008, ApJ, 689, L13
- Osterbrock & Ferland (2006) Osterbrock, D. E. & Ferland, G. J. 2006, Astrophysics of gaseous nebulae and active galactic nuclei
- Rafter et al. (2011) Rafter, S. E., Crenshaw, D. M., & Wiita, P. J. 2011, AJ, 141, 85
- Sarzi et al. (2010) Sarzi, M., Shields, J. C., Schawinski, K., Jeong, H., Shapiro, K., Bacon, R., Bureau, M., Cappellari, M., Davies, R. L., de Zeeuw, P. T., Emsellem, E., Falcón-Barroso, J., Krajnovi’c, D., Kuntschner, H., McDermid, R. M., Peletier, R. F., van den Bosch, R. C. E., van de Ven, G., & Yi, S. K. 2010, MNRAS, 402, 2187
- Schmidt et al. (2002) Schmidt, G. D., Smith, P. S., Foltz, C. B., & Hines, D. C. 2002, ApJ, 578, L99
- Schmidt et al. (2007) Schmidt, G. D., Smith, P. S., Hines, D. C., Tremonti, C. A., & Low, F. J. 2007, ApJ, 666, 784
- Shen et al. (2011) Shen, Y., Richards, G. T., Strauss, M. A., Hall, P. B., Schneider, D. P., Snedden, S., Bizyaev, D., Brewington, H., Malanushenko, V., Malanushenko, E., Oravetz, D., Pan, K., & Simmons, A. 2011, ApJS, 194, 45
- Thompson et al. (1999) Thompson, K. L., Hill, G. J., & Elston, R. 1999, ApJ, 515, 487
- Wang et al. (2009) Wang, J.-G., Dong, X.-B., Wang, T.-G., Ho, L. C., Yuan, W., Wang, H., Zhang, K., Zhang, S., & Zhou, H. 2009, ApJ, 707, 1334
- Yan & Blanton (2012) Yan, R. & Blanton, M. R. 2012, ApJ, 747, 61