Bar slowdown and the distribution of dark matter in barred galaxies
Abstract
‘Conspiracy’ between the dark and the baryonic mater prohibits an unambiguous decomposition of disc galaxy rotation curves into the corresponding components. Several methods have been proposed to counter this difficulty, but their results are widely discrepant. In this paper, I revisit one of these methods, which relies on the relation between the halo density and the decrease of the bar pattern speed. The latter is routinely characterised by the ratio of the corotation radius to the bar length , . I use a set of -body+SPH simulations, including sub-grid physics, whose initial conditions cover a range of gas fractions and halo shapes. The models, by construction, have roughly the same azimuthally averaged circular velocity curve and halo density and they are all submaximal, i.e. according to previous works they are expected to have all roughly the same value, well outside the fast bar range (1.2 0.2). Contrary to these expectations, however, these simulations end up having widely different values, either within the fast bar range, or well outside it. This shows that the value can not constrain the halo density, nor determine whether galactic discs are maximal or submaximal. I argue that this is true even for early type discs (S0s and Sas).
keywords:
methods: -body simulations – galaxies: evolution – galaxies: haloes – galaxies: kinematics and dynamics – galaxies: structure1 Introduction
1.1 Disc-to-halo mass degeneracy in disc galaxies
Although extended HI rotation curves have clearly shown that there is dark matter in disc galaxies (Bosma, 1978), it is is still unclear how massive this is and how it is distributed (Bosma, 2004). Indeed, a rotation curve sets constraints only on the total circular velocity, but not on the contribution of each component individually at a given radius. There is thus a degeneracy between the baryonic and the dark mass, due to the fact that the mass-to-light ratio of the stellar component () is poorly known. There is an upper limit to the disc mass, since the contribution of the baryons can not exceed the total circular velocity at any radius, which is referred to as maximum disc. But the baryonic contribution could also be considerably less, in which case the disc is referred to as submaximum.
Several methods have been proposed to solve this degeneracy. Most of them rely on dynamical arguments, such as fitting the velocity field of barred or spiral galaxies (e.g. Lindblad et al, 1996; Kranz, Slyz & Rix, 2001, 2003; Weiner, Sellwood & Williams, 2001; Perez, Fux & Freeman, 2004; Zánmar et al., 2008), measurements of the stellar velocity dispersion (Bottema, 1993; Kregel, van der Kruit & Freeman, 2005; Herrmann & Ciardullo, 2009; Bershady et al., 2011; Martinsson et al., 2013), the multiplicity of the spiral arms (Athanassoula, Bosma & Papaioannou, 1987), or the slow-down of the bar (Debattista & Sellwood, 1998, 2000, hereafter DS98 and DS00, respectively). Non-dynamical arguments include the colour - relation (Kassin, de Jong & Weiner, 2006), lensing (Trott & Webster, 2002; Tisserand et al., 2007; Hamadache et al., 2006; Trott et al., 2010) and deviations from the Tully-Fisher relation (Courteau & Rix, 1999; Gnedin et al., 2007). Some of these methods argue for maximum and others for submaximum discs, so that no clear picture has yet emerged.
1.2 Bar slowdown
Both analytical work (Weinberg, 1985) and simulations (Little & Carlberg 1991; Hernquist & Weinberg 1992; DS98; DS00; Athanassoula 2003, hereafter A03; O’Neill & Dubinski 2003; Martinez-Valpuesta, Shlosman & Heller 2006; 2009, etc.) have shown that the bar pattern speed decreases during the evolution of a disc galaxy, sometimes very considerably. This result, initially shown for purely stellar models, holds also for simulations with gas (Berentzen et al., 2007; Villa-Vargas, Shlosman, & Heller, 2010, and references therein). It can be explained as due to the angular momentum exchange within the galaxy or, alternatively but equivalently, by the dynamical friction exerted by the halo on the bar, which results in a decrease of the pattern speed. From both explanations, it is clear that a denser halo will cause a more rapid bar slowdown, because it will result in more halo mass in near-resonance locations, ready to absorb angular momentum, and a stronger dynamical friction. This link between bar slowdown and dark matter was used by DS98 and DS00 to set constraints on the halo mass and density and thus break the disc/halo degeneracy, in favour of maximum discs.
It is not easy to compare pattern speed values of different galaxies between them, or to simulations, because the various galaxies and models have different maximum rotational velocities and different total masses and mass distributions. Instead, it is customary to compare the corotation radius (), which depends on the pattern speed, to the bar length (). The ratio of these two lengths, , is thus often used as a yardstick for measuring the pattern speed and it allows direct comparisons between real galaxies and simulations. If (or 1.5 for some authors) the bar is called fast, while if (1.5) it is considered slow.
A further difficulty comes from the fact that the pattern speed of bars in real galaxies can not be measured directly. The most widely used indirect method (Tremaine & Weinberg, 1984) uses the luminosity and the kinematics of the old stellar population along a slit and provides a measure of the pattern relying on the assumption that the galaxy is in steady-state and the disc infinitesimally thin. This method was applied to a number of galaxies, as reviewed by Corsini (2011). Alternatively, the existence of specific morphological features can give strong clues to the location of the corotation radius (e.g. Rautiainen, Salo & Laurikainen, 2005, 2008; Athanassoula et al., 2010). Pérez, Aguerri & Méndez-Abreu (2012) used outer rings, and thus were able to study a much larger sample of galaxies than what had been possible kinematically.
Dynamical arguments have also been used. Orbital structure theory (Contopoulos, 1980) and resonant responses (Athanassoula, 1980) show that the bar can not extend beyond corotation, or, equivalently, that 1. Athanassoula (1992) used hydrodynamic simulations to show that, in order for the shock loci in the bar to have the same shape as the observed dust lanes, the pattern speed must be such as to fulfil . This is the tightest constraint to date, but it has not yet been tested to what extent the tightness of these limits is model dependent. Note also that the above methods give information on the value of the pattern speed at the present time, not on its decrease with time, which would have been the most useful quantity for our purposes.
DS98 and DS00 used -body simulations to set constraints on the halo mass and found that, for their simulations, models with a maximum disc have , while galaxies with a submaximum disc (and therefore a halo of high density in the central parts) have . Taking into account the above described dynamical and observational constraints on the ratio, they concluded that discs must be maximum.
A03 first suggested that the value of can not set constraints on the halo-to-disc mass ratio in disc galaxies, because it depends on the angular momentum redistribution in general, and therefore on many quantities other than the disc-to-halo mass ratio.
In this paper I will re-examine the bar slow-down method and check whether it can be used to set constraints to the amount and distribution of dark matter. Sect. 2 presents the simulations and Sect. 3 the results. Discussion and conclusions are given in Sect. 4 and 5, respectively.
2 Simulations
I will here discuss fifteen simulations, including cases with nonspherical haloes and/or with gas. They are described at length by Athanassoula, Machado & Rodionov (2013, hereafter AMR13), where the reader can find all necessary information on the initial conditions and the run parameters.
Three different initial halo shapes are considered: spherical, mildly triaxial (with axial ratios = 0.8 and = 0.6) and strongly triaxial ( = 0.6 and = 0.4). These axial ratios increase during the evolution and end up much more spherical. Furthermore, five different values of the initial gas fraction in the disc (0, 20, 50, 75 and 100%) are considered, but, since star formation is included in the simulations, these values change with time, reaching after 6 Gyrs values between 4 and 9%, and after 10 Gyrs values between 3 and 7% of the disc mass (Fig. 2 of AMR13).
Initially, all simulations have roughly the same azimuthally averaged halo and total circular velocity curves. The maximum contribution of the disc to the total circular velocity curve is roughly equal to that of the halo at the same radius, i.e. the disc is clearly submaximum with a mean value of the Sackett parameter (Sackett, 1997) roughly equal to 0.7. More precisely, averaging over all runs I get = 0.68 0.01, where and are the circular velocity of the disc and the total circular velocity, both measured at the location where the disc’s contribution is maximum. From figure 2 of DS98, one would then expect that all these simulations will have 2.5.
3 Results
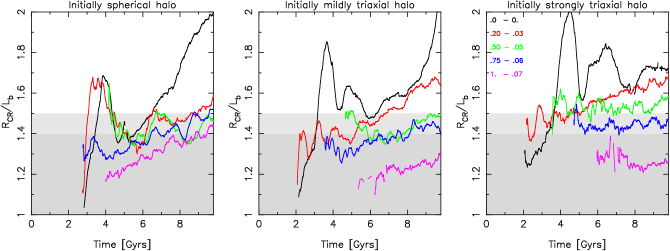
Fig. 1 shows the ratio as a function of time for the fifteen simulations. The curves do not start out from = 0 because the bar must have grown considerably before the pattern speed can be safely measured. In a number of the curves, particularly those corresponding to simulations which have both a high initial gas fraction and initial triaxiality, there are clear gaps. These correspond to time ranges during which the bar length is particularly difficult to measure, so I preferred to leave out the corresponding estimates (see Appendix).
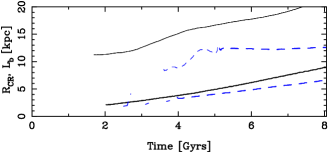
The general evolutionary trend is an increase of with time. This increase varies from very strong (as in the gas-less cases), to practically zero. The latter is seen in cases with a strong initial triaxiality and an initial gas fraction between 50 and 100%, i.e. between 5 and 7% at =10 Gyrs. This behaviour is explained in Fig. 2, where I plot both the (smoothed) corotation radius and bar length as a function of time for two runs, one gasless and the other with initially 100% gas, but having the same haloes. As expected, the gasless simulation has too large corotation and bar lengths, while the initially very gas rich one has very realistic values. This, together with its implications, will be discussed at length elsewhere. This plot also explains the relatively low values of for gas rich versus gas poor cases. It thus becomes clear that in models with a low gas fraction and no or low triaxiality the corotation radius increases much more rapidly than the bar length, so that their ratio increases, sometimes very considerably. In contrast, for models with high gas fraction and triaxiality, the increase of is not much stronger than that of the bar length, so that the ratio increases little, if at all, with time. No models had a corotation radius increasing less than the bar length over a long period of time, i.e. in no models did the ratio decrease globally over the evolution.
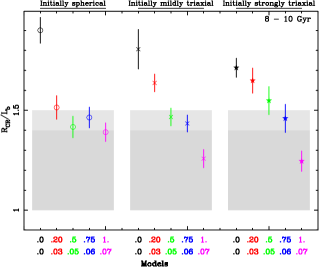
A global view of these results is given in Fig. 3. We plot the averages of in a time range towards the end of the simulation, namely between 8 and 10 Gyrs, in a way that displays clearly the two main results of this study. First, the values depend very strongly on the gas fraction in the simulation. For simulations with no gas they are quite high, and they decrease as we consider simulations with a larger gas fraction. This is clear for all three halo triaxialities. All simulations with initially 100% or 75% gas (7% or 6% at =10 Gyrs), as well as the majority of those with 50% gas (5% at =10 Gyrs), are in the range (1., 1.5). But most of the remaining cases, and in particular the cases with no gas, are well outside these limits. Note also that the minimum values of are around 1.2, and that no case with 1 has been found.
The above lead to the second result, which is the most important in the context of this paper, namely that, although initially the radial profile of the disc-to-halo mass ratio is roughly the same for all models shown here, their ratios differ very considerably, some corresponding to fast and others to slow bars.
4 Discussion
There are a number of differences between the simulations of DS00 and those of AMR13, which can explain the differences between our conclusions. A fair number of these differences are due to the relatively restricted computer power available 10 - 15 years ago. In order of increasing importance these are: First, the simulations of DS00 have a much lower resolution (larger softening) than those discussed here. Second, the initial conditions of the AMR13 simulations were built specifically so as to be near axisymmetric equilibrium (i.e. in good equilibrium for timescales up to bar formation times). In contrast, the simulations in DS98 and DS00 generally start off with Toomre’s parameter = 0.05, i.e. they are strongly axisymmetrically unstable which will drive a strong reorganisation of the disc material with corresponding transients and heating. Third, the DS98 and DS00 submaximum disc rotation curves drop too steeply after the maximum to be realistic (e.g. Fig. 1 of DS98 and 2 and 8 of DS00), in contrast to ours, shown in Fig. 1 of AMR13. Fourth and most important, our simulations consider a larger variety of models, including gas and its physics, as well as nonspherical haloes.
Both halo nonaxisymmetry and particularly the presence of gas occur naturally in disc galaxies and thus need to be included in numerical simulations before any conclusions on constraints on halo mass can be reached. Cosmological simulations show that haloes form triaxial, with axial ratios compatible with those assumed in our initial conditions (e.g. Vera-Ciro et al., 2011, and references therein). Then the formation of discs and bars decreases this triaxiality and brings it to levels compatible with the present observational constraints. The presence of gas in galactic discs is also to be expected. It is dominant in these discs early on and its fraction decreases with time due to star formation, to reach present day levels at redshift = 0. I showed here that both the halo nonaxisymmetry and particularly the presence of gas lead to a reduction of values, bringing some slow bar cases within the fast bar range.
All theoretical works presented so far – and independent of the method used (orbital structure theory, response calculations, or simulations) – agree well on the fact that should be larger than unity, i.e. that the whole bar should lie within corotation. Yet observations have come up with a number of galaxies where this is not the case (Corsini, 2011; Pérez et al., 2012). Either some substantial physics is missing from all the theoretical approaches, or, more likely, the error bars of the observations are underestimated. By this I mean not only the statistical errors, e.g. due to a wrong estimate of the viewing angles, but also biases, such as can be due to time evolution or to the existence of out of the plane motions in the bar.
The simulations used in this study have different gas fractions and different halo shapes, while the remaining quantities were kept constant across the models. It is thus not possible to draw from them conclusions about the variations of the ratio across the Hubble sequence. Indeed, late type disc galaxies are not only more gas rich than early types, but they are also less massive, have a relatively less massive classical bulge and a less steeply rising rotation curve. Thus one can not, based only on the results presented here, draw conclusions on how varies as a function of galaxy type, nor confirm or invalidate the results found by Rautiainen, Salo & Laurikainen (2005, 2008).
A ratio which is near-constant with time, does not does not necessarily imply that there is no evolution, and no increase of the corotation radius or bar length with time. Indeed, it is possible that both and increase with time in such a way that their ratio stays roughly constant. For example, in runs with an initial gas fraction between 50 and 100% and a strongly triaxial halo, stays roughly constant with time, yet both the bar length and corotation radius increase steadily with time. Similar behaviour has been found in a number of other simulations, e.g. as displayed in Fig. 4 of Martinez-Valpuesta et al. (2006) for a gasless case.
The results found here concern also S0 and Sa galaxies, despite the fact that these galaxies have little gas, because their discs, like those of all other disc galaxies, must have formed from gas, so must have been at earlier times quite gas rich. Furthermore, it is not clear at what stage of the bar formation and evolution process their gas was expelled or turned into stars, so that the bar evolution could well have been influenced by it. For example the simulations in AMR13 lost most of their gas and of their triaxiality early on during their evolution and yet their gas influences the ratio sufficiently to make the big difference we can see in Figs. 1 and 3.
Even more important, although I focused here on the gas content and halo shape, these two properties should not be considered as the only two (other than the halo mass distribution) to influence the bar slowdown. Any property influencing the redistribution of angular momentum within the galaxy will also influence the bar slow down. As already discussed in A03, this includes a number of other properties such as the velocity dispersion of the stellar disc, the possible existence of a classical bulge and its mass distribution, whether the spheroidal components rotate, and if yes how much, the velocity dispersion in these spheroidals, etc. It is thus not possible to use the value of to set constraints on the halo density in the inner parts, even for S0s. This is particularly important since most of the observational measures of using kinematics have been made on early type, high surface brightness barred galaxies.
5 Conclusions
In this paper I examined one of the methods often used to argue against submaximum discs (and thus indirectly against cuspy halo profiles as in Navaro, Frenk & White 1996), using a more general class of simulations than those often used so far, namely simulations including gas and its physics and halo triaxiality. I find a clear trend between the value of the ratio and the fraction of the disc mass which is in gas. Namely, for smaller amounts of gas I find that both the bar length and the corotation radius increase stronger with time, in such a way that globally also increases. Most important, I find that for roughly the same halo-to-disc mass ratio profiles, the value can, depending on the gas fraction and the halo shape, be within either the fast or the slow bar region. In particular, I find several submaximum disc models which have an value which was so far thought to correspond only to maximum disc models. Thus the value of can not be used to discriminate between maximum and submaximum discs. Hence one of the arguments very often used in favour of near-maximum discs is dismissed. This does not mean that discs are submaximum, it just means that this method can not solve the problem and that more work is necessary to break the disc/halo degeneracy.
Acknowledgements
I thank A. Bosma and S. Rodionov for useful and stimulating discussions, the referee for helpful comments and J.-C. Lambert for computer assistance. I acknowledge financial support to the DAGAL network from the European Union’s Programme FP7/2007-2013/ under REA grant agreement number PITN-GA-2011-289313.
References
- Athanassoula (1980) Athanassoula, E. 1980, A&A, 88, 184
- Athanassoula (1992) Athanassoula, E. 1992, MNRAS, 259, 345
- Athanassoula (2003) Athanassoula, E. 2003, MNRAS, 341, 1179 (A03)
- Athanassoula, Bosma & Papaioannou (1987) Athanassoula, E., Bosma, A., Papaioannou, S. 1987, A&A, 179, 23
- Athanassoula, Machado & Rodionov (2013) Athanassoula, E., Machado, R., Rodionov, S. 2013, MNRAS, 429, 1949 (AMR13)
- Athanassoula & Misiriotis (2002) Athanassoula, E., Misiriotis, A. 2002, MNRAS, 330, 35 (AM02)
- Athanassoula et al. (1990) Athanassoula, E., Morin, S., Wozniak, H., Puy, D., Pierce, M. J., Lombard, J., Bosma, A. 1990, MNRAS, 245, 130
- Athanassoula et al. (2010) Athanassoula, E., Romero-Gómez, M., Bosma, A., Masdemont, J.J. 2010, MNRAS, 407, 1433
- Berentzen et al. (2007) Berentzen I., Shlosman I., Martinez-Valpuesta I., Heller C. H., 2007, ApJ, 666, 189
- Bershady et al. (2011) Bershady, M., Martinsson, T., Verheijen, M. A. W., Westfall, K. B., Andersen, D. R.; Swaters, R. A. 2011, ApJ, 739, 47L
- Bosma (1978) Bosma, A. 1978, PhD Thesis, Groningen Univ.
- Bosma (2004) Bosma, A. 2004, IAU Symp. 220, eds. S. D. Ryder, D. J. Pisano, M. A. Walker, and K. C. Freeman. San Francisco: ASP, 39
- Bottema (1993) Bottema, R. 1993, A&A, 275, 16
- Contopoulos (1980) Contopoulos, G. 1980, A&A, 81, 198
- Corsini (2011) Corsini, E. M. 2011, MSAIS, 18, 23
- Courteau & Rix (1999) Courteau, P., Rix, H. W. 1999, ApJ, 513, 561
- Debattista & Sellwood (1998) Debattista, V., Sellwood, J. A. 1998, ApJ, 493, L5 (DS98)
- Debattista & Sellwood (2000) Debattista, V., Sellwood, J. A. 2000, ApJ, 543, 704 (DS00)
- (19) Dubinski, J., Berentzen, I., Shlosman, I. 2009, ApJ, 697, 293
- Gadotti et al. (2007) Gadotti, D. A., Athanassoula, E., Carrasco, L., Bosma, A., de Souza, R. E., Recillas, E. 2007, MNRAS, 381, 943
- Gnedin et al. (2007) Gnedin, O. Y., Weinberg, D. H., Pizagno, J., Prada, F., Rix, H. W. 2007, ApJ, 671, 1115
- Hamadache et al. (2006) Hamadache, C. et al. 2006, A&A, 454, 185
- Herrmann & Ciardullo (2009) Herrmann, K. A., Ciardullo, R. 2009, ApJ, 705, 1686
- Hernquist & Weinberg (1992) Hernquist L., Weinberg, M. D. 1992, ApJ, 361, 69
- Kassin, de Jong & Weiner (2006) Kassin, S., de Jong, R. S.. Weiner, B. J. 2006, ApJ, 643, 864
- Kranz, Slyz & Rix (2001) Kranz, T., Slyz, A., Rix, H. W. 2001, ApJ, 562, 164
- Kranz, Slyz & Rix (2003) Kranz, T., Slyz, A., Rix, H. W. 2003, ApJ, 586, 143
- Kregel, van der Kruit & Freeman (2005) Kregel, M., van der Kruit, P. C., Freeman, K. C. 2005, MNRAS, 358, 503
- Lindblad et al (1996) Lindblad P. A. B., Lindblad P. O., Athanassoula E. 1996, A&A, 313, 65
- Little & Carlberg (1991) Little B. Carlberg R. G. 1991, MNRAS, 250, 161
- Martinsson et al. (2013) Martinsson, T. P. K., Verheijen, M. A. W., Westfall, K. B., Bershady, M. A., Andersen, D. R., Swaters, R. A. 2013, A&A, 557, A131
- Martinez-Valpuesta et al. (2006) Martinez-Valpuesta I., Shlosman I., Heller C., 2006, ApJ, 637, 214
- Navaro, Frenk & White (1996) Navarro, J., Frenk, C., White, S. D. M. 1996, ApJ, 462, 563
- O’Neill & Dubinski (2003) O’Neill J. K., Dubinski J., 2003, MNRAS, 346, 251
- Perez, Fux & Freeman (2004) Perez, I., Fux, R., Freeman, K. 2004, A&A, 424, 799
- Pérez et al. (2012) Pérez, I., Aguerri, J. A. L., Méndez-Abreu, J. 2012, A&A, 540, 103
- Rautiainen, Salo & Laurikainen (2005) Rautiainen, P., Salo, H., Laurikainen, E., 2005, ApJ, 631, 129L
- Rautiainen, Salo & Laurikainen (2008) Rautiainen, P., Salo, H., Laurikainen, E., 2008, MNRAS, 388, 1803
- Sackett (1997) Sackett, P. 1997, ApJ, 483, 103
- Tisserand et al. (2007) Tisserand, P. et al. 2007, A&A, 469, 387
- Tremaine & Weinberg (1984) Tremaine, S., Weinberg, M. 1984, ApJL, 282, 5
- Trott & Webster (2002) Trott, C. M., Webster, R. L. 2002, MNRAS, 334, 621
- Trott et al. (2010) Trott, C. M., Treu, T., Koopmans, L. V. E., Webster, R. L. 2010, MNRAS, 401, 1540
- Vera-Ciro et al. (2011) Vera-Ciro C. A., Sales L. V., Helmi A., Frenk C. S., Navarro J. F., Springel V., Vogelsberger M., White S. D. M., 2011, MNRAS, 416, 1377
- Villa-Vargas, Shlosman, & Heller (2010) Villa-Vargas J., Shlosman I., Heller C., 2010, ApJ, 719, 1470
- Weinberg (1985) Weinberg, M. D. 1985, MNRAS, 213, 451
- Weiner, Sellwood & Williams (2001) Weiner, B. J., Sellwood, J. A., Williams, T. B. 2001, ApJ, 546, 916
- Zánmar et al. (2008) Zánmar Sánchez, R., Sellwood, J. A., Weiner, B. J., Williams, T. B. 2008, ApJ, 674, 797
- (49)
Appendix A Measuring the corotation radius and the bar length
For all the runs I calculated the pattern speed as a function of time and from this and the mass distribution at the corresponding time, I obtained for all times after the bar has grown sufficiently for its angle to be accurately measured,.
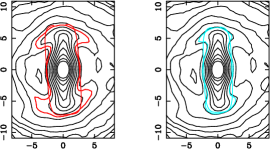
The workhorse for our measurements of the bar length is a method very similar to what was used in DS00 and in Athanassoula & Misiriotis (2002, hereafter AM02), i.e. the surface of the disc was cut in annuli and in each one of these I calculated the phase of the =2 component. The radius at which this angle deviated significantly from that of the bar is a measure of the bar length (DS00, AM02 etc.). I also used two further methods described in AM02, which rely on the fit of generalised ellipses (Athanassoula et al., 1990) to the isophotes. This fit gives us also the angle of the isophote, from which the bar length can be deduced as the radius within which this angle does not vary significantly. Third, if the bar is sufficiently strong, the ellipticity as a function of radius shows a clear drop, which can be used as a measure of the bar length (see e.g. the upper left panel of figure 4 of AM02), as already discussed in AM02 and Gadotti et al. 2007. In the latter work, this third method was compared to other methods using real galaxies and was found to give quite satisfactory results. Fourth, we included eye estimates of the bar length for a number of randomly chosen snapshots – as a test of the various methods – as well as for the times when one or more of the methods presented a problem. The finally adopted bar length is the average of all results which did not present any problem. For snapshots which presented problems for several methods I did not adopt any result: since a snapshot was saved 2000 times per run, some of these times could be easily neglected.
The results of the first and third method, which rely on very different properties of the bar, are compared for a typical snapshot in Fig. 4. It shows that a different isophote was picked out by each of the two methods, the ellipticity drop method leading systematically to somewhat longer bars. This difference is, however, relatively small due to the fact that the drop of the density at the bar end along the direction of the bar major axis is quite abrupt, so that exactly which isodensity is picked does not change the results substantially. Note that if I use ellipses rather than generalised ellipses, this difference becomes much more important because the ellipse shape can not describe adequately the end of the bar, contrary to the generalised ellipse, where this is easily achieved. This inadequacy has to be kept in mind when applying this method to large observational samples. A complete discussion on the calculations of bar lengths will be given elsewhere.