The Pressure of the Star Forming ISM in Cosmological Simulations
Abstract
We examine the pressure of the star-forming interstellar medium (ISM) of Milky-Way sized disk galaxies using fully cosmological SPH+N-body, high resolution simulations. These simulations include explicit treatment of metal-line cooling in addition to dust and self-shielding, based star formation. The 4 simulated halos have masses ranging from a few times to nearly solar masses. Using a kinematic decomposition of these galaxies into present-day bulge and disk components, we find that the typical pressure of the star-forming ISM in the present-day bulge is higher than that in the present-day disk by an order of magnitude. We also find that pressure of the star-forming ISM at high redshift is on average, higher than ISM pressures at low redshift. This explains the why the bulge forms at higher pressures: the disk assembles at lower redshift, when the ISM is lower pressure and the bulge forms at high redshift, when the ISM is at higher pressure. If ISM pressure and IMF variation are tied together as suggested in studies like Conroy & van Dokkum (2012), these results could indicate a time-dependent IMF in Milky-Way like systems, as well as a different IMF in the bulge and the disk.
Subject headings:
galaxies : star formation — galaxies : evolution — methods : numerical — N-body simulations1. Introduction
The origin of the stellar initial mass function (IMF) is paramount to our understanding of star formation, stellar evolution and feedback and galaxy formation. The IMF influences most of the observable properties of both stellar populations and galaxies. Detecting variations of the IMF will provide deep insights into the process by which stars form including but not limited to: the origin of the stellar mass scale, the effects of metallicity and environment and the energetics of feedback. Additionally, the IMF is a key ingredient into a huge range of models of all the above phenomena, and a necessary assumption when deriving physical parameters from observations. Despite being such a vital ingredient, the origin and variations of the IMF still remain poorly understood.
In particular, of critical importance, is the question of whether the IMF is universal or whether the IMF is sensitive to the initial conditions of star formation- i.e., the structure of the ISM in which the stars are forming (see e.g. Kroupa et al. 2011). Growing observational evidence suggests that the high mass behavior of the IMF is uniform, including observations of the IMF in the Magellanic Clouds (Kroupa & Weidner, 2003; Bastian et al., 2010; Chabrier, 2003). However at the low mass end, there are many indications, both observationally and theoretically, that there may be a variation in the IMF. For example, Conroy & van Dokkum (2012) and van Dokkum & Conroy (2011) show that the IMF in these systems is bottom heavy using gravity sensitive absorption lines in the cores of giant elliptical galaxies. This has also been independently suggested by kinematic and lensing data (Treu et al., 2010; Cappellari, 2012; Dutton et al., 2013). As these systems formed their stars at high redshift, these studies give us insight into the time-evolution of the IMF. Observationally, Conroy & van Dokkum (2012) show that the mass to light ratios of spheroidal systems indicate a more bottom heavy IMF at higher pressures, and at higher SFRs. This indicates that ISM pressure and the intensity of star formation are both key in understanding how and where stars form- and whether or not the IMF is varying.
Despite the importance of the IMF, a universally agreed upon, fully cosmological, physical theory of its origin and variation with environment has yet to be found: rather, many competing models exist. In particular, explaining the evolution of the IMF has been a challenge for theoretical models, especially in ’normal’ systems. In general, these studies predict large IMF variations with local thermal Jeans Mass (Larson, 1998, 2005), Mach number of the star-forming ISM, or the distribution of densities in a supersonically turbulent ISM (Padoan et al., 1997, 2012; Hennebelle & Chabrier, 2008; Hopkins, 2012b, a). Most theoretical models offer explanations of IMF variation in more extreme conditions- ULIRG, nuclear starbursts owing to the extreme mergers and large gas inflows (Kormendy & Sanders, 1992; Hopkins et al., 2008; Hopkins, 2013; Narayanan & Davé, 2012; Narayanan & Hopkins, 2013) but many predict a top-heavy scenario, contradictory to the observational evidence. Furthermore, Krumholz (2011) shows that the critical mass, i.e. the fragmentation mass of a collapsing star-forming cloud, is dependent on the metallicity and pressure of the cloud itself. In a toy model, Weidner et al. (2013) suggest a time dependent IMF with a top heavy IMF slope followed by a prolonged bottom heavy slope which will bring the ISM pressure, temperature and turbulence into states that will drastically alter fragmentation of the gas, to explain observations.
In this letter, we perform SPH+-body simulations of four medium-mass galaxies to directly explore the star-forming ISM in a cosmological context. This study is unique in that SPH simulations, being particle based, allow us to follow the full thermodynamic history of the gas. Furthermore, the resolution and star formation recipe in these simulations allow us to begin to probe the density structure of a more realistic star-forming ISM, in a cosmological setting. Here we specifically focus on a comparison between the star forming ISM of stars that make up the present-day bulge and those that make up the present-day disk. We find that stars form at ISM pressures an order of magnitude higher in the bulge than those in the disk, on average. Additionally, we find that at early times both bulge and disk stars form in a high pressure ISM. Finally, we find that differences in the formation radius of bulge and disk stars are not responsible for the different pressures. In short, we show that there ISM pressure varies with time, which could imply that the IMF varies with time as well.
2. Simulations and Analysis
The simulations used in this work were run with the N-Body + SPH code GASOLINE (Wadsley et al., 2004; Stinson et al., 2006) in a fully cosmological CDM context: , =0.74, , =0.77, n=0.96. Using the ‘zoomed-in’ volume renormalization technique (Katz & White, 1993; Pontzen et al., 2008),we selected from uniform DM-only simulations field–like regions which we then resimulated at higher resolution. This set of simulations includes metal line cooling (Shen et al., 2010) and tracks non-equilibrium abundances (Christensen et al., 2012b, hereafter CH12). As in CH12, the star formation rate (SFR) in our simulations is set by the local gas density and the H2 fraction; SF (f c∗, with 0.1. Star formation is limited to gas with density greater than 0.1 amu/cc and temperature less than 3000 K, although the dependency of star formation on the H2 abundance makes these limitations largely inconsequential. Tests of the convergence of star formation histories for this star formation perscription are described in CH12.
The full details of our SN feedback “blastwave” approach are described in several papers including, Stinson et al. (2006); Governato et al. (2012). As massive stars evolve into SN, mass, thermal energy and metals are deposited into nearby gas particles, with energy of 1051 ergs per event. Gas cooling is shut-off until the end of the snow-plow phase as described the Sedov-Taylor solution, typically ten million years. We also include gas heating from a uniform, time evolving UV cosmic background, which turns on at and modifies the ionization and excitation state of the gas, following the model of Haardt & Madau (1996).The efficient deposition of SN energy into the ISM, and the modeling of recurring SN by the Sedov solution, should be interpreted as a proxy we have tuned to model the effect of processes related to young stars and to model the effect of energy deposited in the local ISM including UV radiation from massive stars (Hopkins et al., 2011; Wise et al., 2012). The simulations also include a scheme for turbulent mixing that redistributes heavy elements among gas particles (Shen et al., 2010). These feedback, star formation, and ISM parameters in simulations of the same resolution produced galaxies with realistically-concentrated bulges (Christensen et al., 2012a). Furthermore, it is important to note that because the simulations are tuned to produce realistic present-day galaxies (see e.g. Munshi et al. (2013)), with correct surface densities, the mean ISM pressure in these simulations should be approximately correct, even if the feedback model does not include processes specifically related to young stars, stellar winds and radiation pressure (Hopkins et al., 2011; Hopkins, 2013).
| Galaxy Name | Mhalo (M⊙) | Gas Particle Mass (M⊙) | Softening (pc) |
|---|---|---|---|
| h986 | |||
| h277 | |||
| h258 | |||
| h239 |
We have simulated four different disk galaxies, at high resolution, described in Table 1. We dynamically decompose our disk galaxies based on cuts in angular momentum and energy(Scannapieco et al., 2011; Governato et al., 2009). Each star particle at is traced back to the gas particle from which it formed in order in order to sample the properties of the ISM from which each component formed. Using the cold gas in the central few kiloparsecs of he galaxy, a star particle is established as disk when its specific angular momentum () is a large fraction of the angular momentum of a circular orbit with the same binding energy, i.e., . Using the potential of the entire matter distribution (dark, gas and stars), we determine the total energy for each particle and subsequently it’s angular momentum. For the bulge and halo stars, star particles are identified based on their radial orbits and their binding energy: bulge stars have higher binding energies than halo stars. Furthermore bulge and halo are also distinguished by the radius where the spheroid mass profile changes to a shallower slope. We checked the stability of our kinematic decomposition across three simulation outputs in time- ie over the course of Myr which approximates the dynamical time of the systems. We compared the results of our analysis in the case of the strictest definition that particles must be classified as the same component over a whole dynamical time to the weakest definition that particles need only be classified a component at and found that the resulting trends remain unchanged.
Using full information from the simulations (kinematics, ages, metallicity), we have traced the density, temperature, velocity dispersion and pressure of the ISM in which the stars of each component form. Being particle based, the SPH approach of our simulations allows us to follow in detail the thermodynamical history of the gas through cosmic times, without resorting to additional ’tracer elements’ (Genel et al., 2013). This allows us to examine not only where, but also in what environment stars are forming in our simulated Milky-Way like galaxies. In our analysis, we define pressure in very simple terms: . We get temperature and density by tracing each star particle belonging to disk and bulge back to the gas particle from which it formed. Each gas particle is tagged with a local density and temperature that is a function of the simulation force resolution and softening length. Gas properties are calculated based on the 32 nearest neighbors. Our definition of pressure is limited to a “thermal” pressure term, which, as we do not resolve disks of highly turbulent gas, is actually a proxy for the entire pressure in the gas. Namely, it is the primary pressure support against the gravitational pressure in the disk.
3. Results
In this section we show that ISM structure is closely tied to star formation. Additionally, we show that at earlier times in a galaxy’s history, stars are forming in a higher pressure ISM environment than that in which stars form today. This is theoretical evidence for a variation in IMF in a “normal” Milky-Way environment, if IMF variations are indeed tied to ISM structural parameters, like temperature, density, metallicity and pressure (Conroy & van Dokkum, 2012; Krumholz, 2011). For brevity, we show plots for one of our simulated halos, demonstrating the trends observed for all four halos.
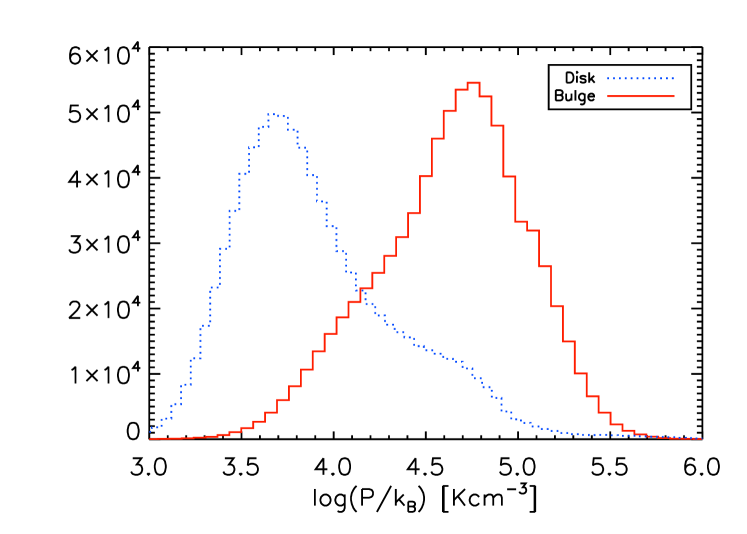
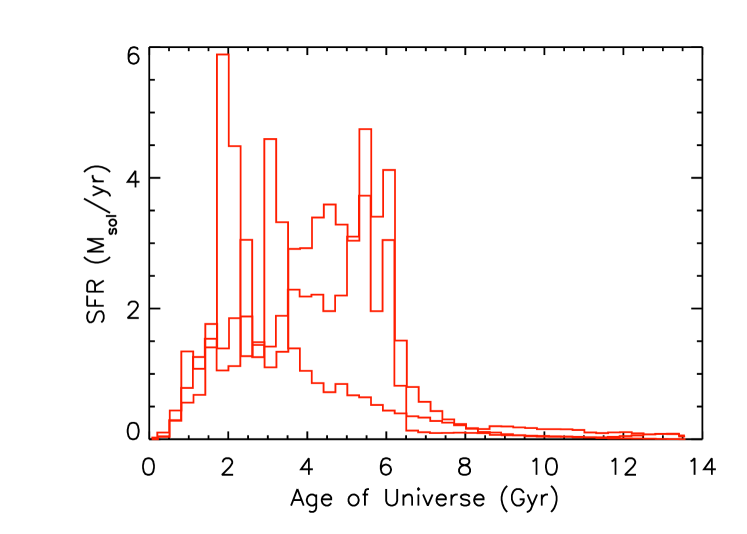
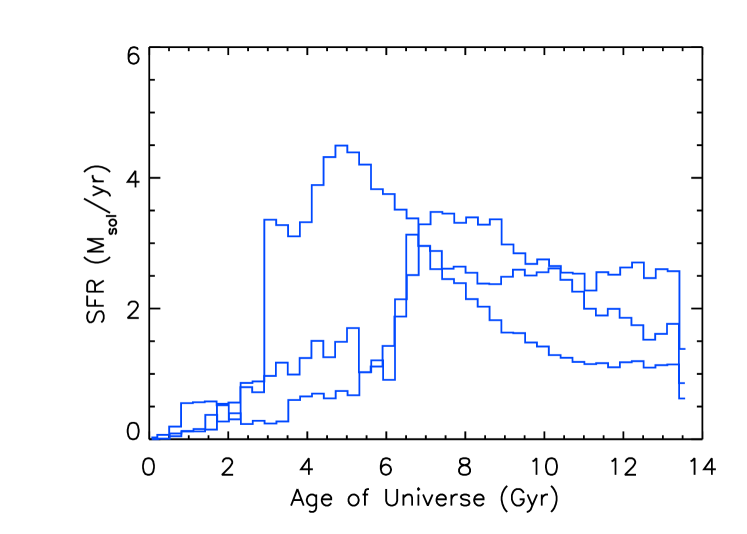
In all four simulated halos, each cosmological and with varying merger and star formation histories, the distribution of pressure values in the ISM that forms the present day bulge is higher by an order of magnitude than that which forms the present day disk. In Figure 1a, we show the distribution of formation pressures for one of our simulated Milky-Ways, h986. The peak pressure of both distributions is different: bulge stars peak at pressures an order of magnitude higher pressure than disk stars. This shows that in general, bulge stars are forming ISM that is structurally different in terms of gas temperature and density: specifically, stars are forming from denser gas. It is important to note that the actual values for pressure are not comparable to pressures found in observations. As our star formation prescription is resolution limited, the maximum gas densities achieved are resolution dependent. What should be highlighted is the relative difference between the pressures found in the bulge and disk of our simulated galaxies. In Figure 1b and 1c, we show the SFHs for the 3 simulated halos, not directly discussed here, to show that in general, for all halos, the bulge forms at early times, and the disk forms later.
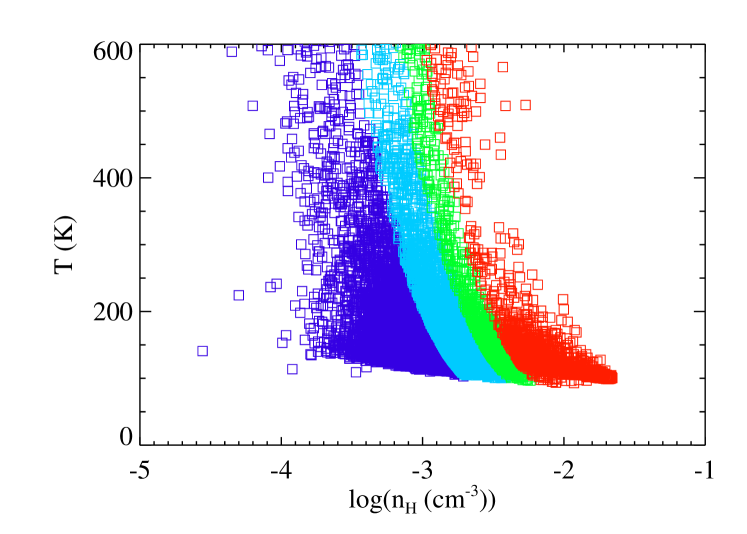
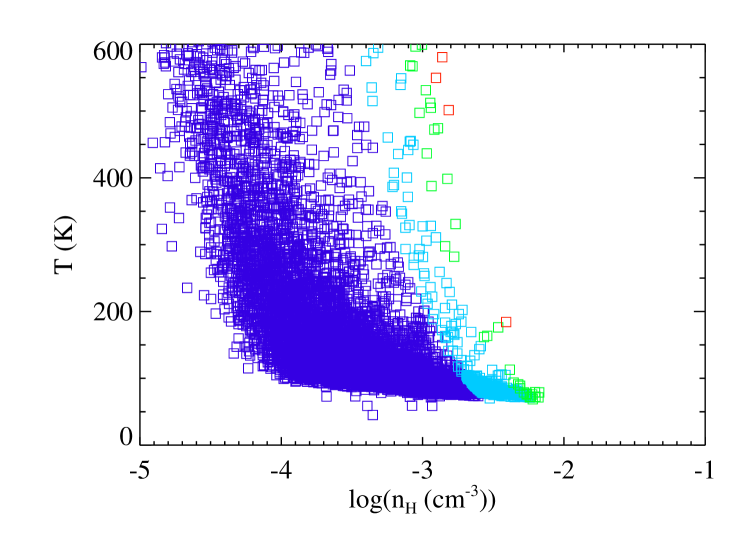
In Figure 2 we compare the phase diagrams for bulge and disk during a star formation event which contributes to the components’ overall mass growth: for the bulge, this was between and Gyrs and for the disk, between and Gyrs. This figure at first glance, demonstrates that in general, the the bulge forms in a range of densities that is higher than that of the disk, and that the temperature range is very similar. Each point in the phase diagrams is color coded according to pressure where hotter colors represent higher pressures (red is the highest pressure bin). This color-coding further drives home that it is the high densities in the bulge star formation event that drive the high pressures, while in the disk, the high pressures result from higher temperatures. Since our simulations use an H2-dependent star formation recipe, low metallicity gas particles would be expected to form stars at higher densities. However, from the bottom panel of Figure 2 is is clear that even at the same metallicities, bulge stars form from denser gas.
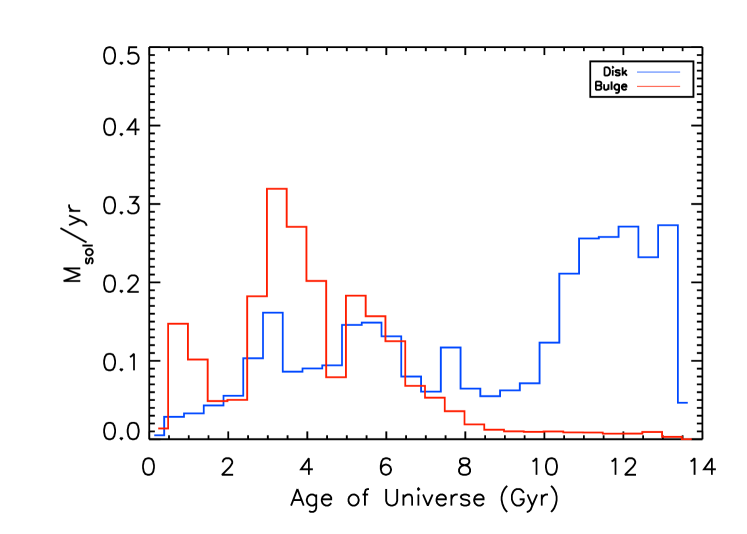
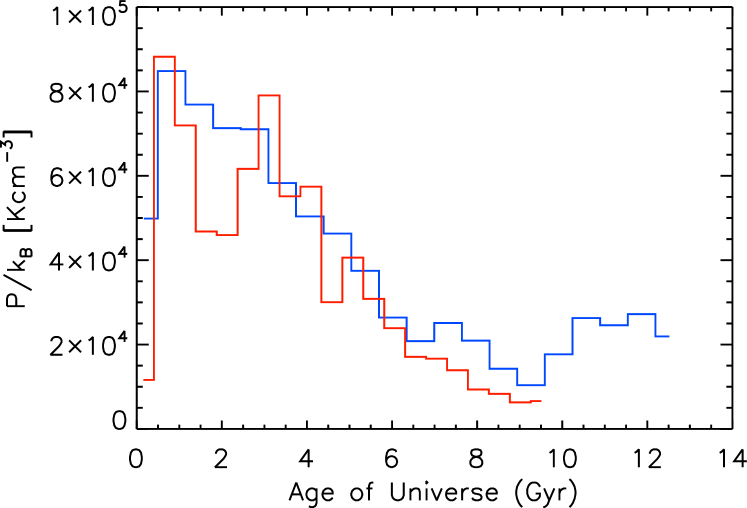
In Figure 3, we present the star formation history for the same galaxy, h986, for the dynamical bulge (red) and disk (blue). We also present the median pressure as a function of time for both components in the same time bins. Figure 2 highlights that both components are forming stars at higher pressures early in the galaxy’s history. The star formation histories show that the bulge forms the majority of its stars early on, when typical ISM pressures are high, while the disk forms its stars later, when ISM pressures are lower. We also can see the parallel in the bulge SFH and the bulge pressure, in that bursts of bulge star formation seem to be contemporaneous with ISM pressure peaks. We discuss what this may imply in the summary.
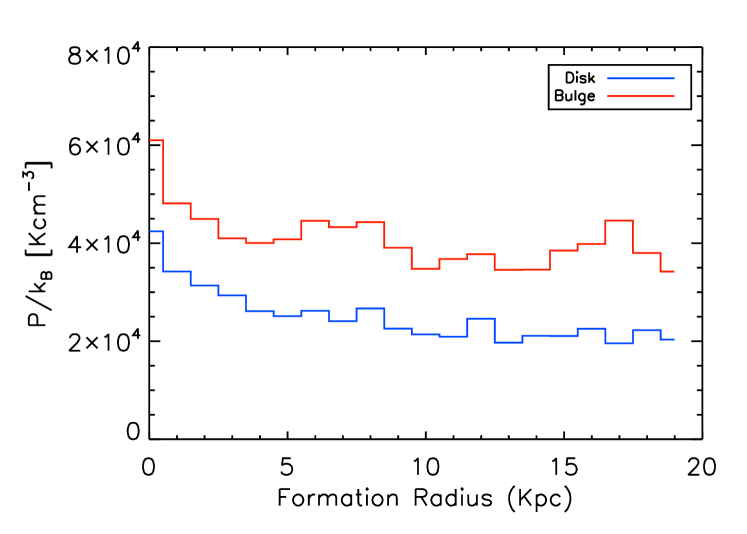
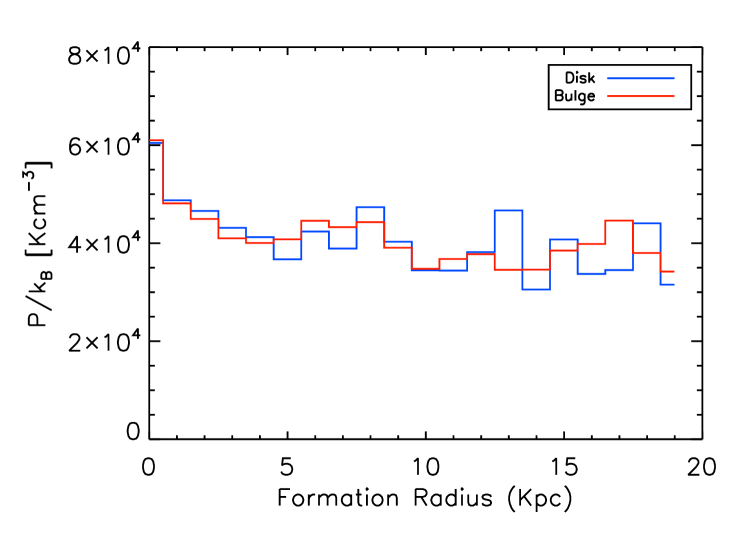
Finally, in Figure 4, we explore whether formation location has any bearing on the pressure of the gas. We expect that pressure is higher closer to the center of the galaxy (i.e., where one would expect to find bulge stars), given that the vertical gravity and surface density should be higher closer to the center. As a result, one would expect high pressures towards the center of the galaxy. However, Figure 3 shows that this explanation cannot entirely explain the pressure differential between bulge and disk. In the top panel we see that there is no correlation between formation radius and pressure for either component, over the galaxy’s whole history and that bulge stars are in forming at higher pressures than disk stars. In the second panel, we look only at the stars that formed in the early protogalaxy: specifically, the gas that forms stars that are 6 Gyrs old or more, when both components are should be at higher pressures. We see that with that cut, at any formation radius, bulge stars and disk stars are forming at high pressures in the early universe, implying the existence of an early high pressure star-forming environment in the protogalaxy.
4. Summary
In this letter, we provide evidence that ISM pressure is redshift dependent by examining the ISM pressures during the formation of the present-day bulge and disk. Because the present-day bulge predominantly forms early in the galaxy’s history, it forms at higher pressures than the present-day disk. We show that in general, at early times, star formation occurs at higher pressures- specifically higher densities. We show that this is not the result of formation location and the higher densities found in the center of the protogalaxy: in general bulge and disk stars are forming over all formation radii. If ISM pressure and IMF are related as postulated in Krumholz (2011); Conroy & van Dokkum (2012), we have evidence for a redshift dependence of the IMF and further, that bulge stars formed with a different IMF from disk stars. Furthermore, we show that even at high redshift, bulge stars and disk stars in general, are forming at higher pressures, regardless of formation radius. This further supports the redshift dependence of ISM pressure: we see that in the young protogalaxy stars form in a high pressure disk, regardless of classification at . However, as Figure 3 demonstrates, the majority of bulge stars are formed in this high-pressure star formation epoch, while the majority of disk stars form in the later, low-pressure epoch. In our analysis we also examine the differences in metallically and H2 fraction between bulge and disk, to isolate why the early protogalaxy is at high density (and thus high pressure). We find that bulge stars form from gas with higher H2 fractions and even when holding metallicity constant, bulge stars form from denser gas. These trends point toward the high redshift progenitors having more dense gas, likely as a result of early rapid accretion.
Future work will include following the assembly history of these galaxies to determine the role of mergers and gas accretion in the formation of the present-day bulge and disk. We will follow the build-up of each component tracing each star back in time, including a full merger-tree. In this way we can determine isolate the role of mergers and in-situ star formation on the structure of the star-forming ISM
References
- Bastian et al. (2010) Bastian, N., Covey, K. R., & Meyer, M. R. 2010, ARA&A, 48, 339
- Cappellari (2012) Cappellari, M. 2012, ArXiv e-prints
- Chabrier (2003) Chabrier, G. 2003, PASP, 115, 763
- Christensen et al. (2012a) Christensen, C., Governato, F., Quinn, T., Brooks, A. M., Fisher, D. B., Shen, S., McCleary, J., & Wadsley, J. 2012a, ArXiv e-prints
- Christensen et al. (2012b) Christensen, C., Quinn, T., Governato, F., Stilp, A., Shen, S., & Wadsley, J. 2012b, MNRAS, 425, 3058
- Conroy & van Dokkum (2012) Conroy, C., & van Dokkum, P. G. 2012, ApJ, 760, 71
- Dutton et al. (2013) Dutton, A. A., Macciò, A. V., Mendel, J. T., & Simard, L. 2013, MNRAS, 432, 2496
- Genel et al. (2013) Genel, S., Vogelsberger, M., Nelson, D., Sijacki, D., Springel, V., & Hernquist, L. 2013, MNRAS
- Governato et al. (2009) Governato, F. et al. 2009, MNRAS, 398, 312
- Governato et al. (2012) —. 2012, ArXiv e-prints
- Haardt & Madau (1996) Haardt, F., & Madau, P. 1996, ApJ, 461, 20
- Hennebelle & Chabrier (2008) Hennebelle, P., & Chabrier, G. 2008, ApJ, 684, 395
- Hopkins et al. (2008) Hopkins, A. M., McClure-Griffiths, N. M., & Gaensler, B. M. 2008, ApJ, 682, L13
- Hopkins (2012a) Hopkins, P. F. 2012a, MNRAS, 423, 2016
- Hopkins (2012b) —. 2012b, MNRAS, 423, 2037
- Hopkins (2013) —. 2013, MNRAS, 428, 2840
- Hopkins et al. (2011) Hopkins, P. F., Quataert, E., & Murray, N. 2011, ArXiv e-prints
- Katz & White (1993) Katz, N., & White, S. D. M. 1993, ApJ, 412, 455
- Kormendy & Sanders (1992) Kormendy, J., & Sanders, D. B. 1992, ApJ, 390, L53
- Kroupa & Weidner (2003) Kroupa, P., & Weidner, C. 2003, ApJ, 598, 1076
- Krumholz (2011) Krumholz, M. R. 2011, ApJ, 743, 110
- Larson (1998) Larson, R. B. 1998, MNRAS, 301, 569
- Larson (2005) Larson, R. B. 2005, in Astrophysics and Space Science Library, Vol. 327, The Initial Mass Function 50 Years Later, ed. E. Corbelli, F. Palla, & H. Zinnecker, 329
- Munshi et al. (2013) Munshi, F. et al. 2013, ApJ, 766, 56
- Narayanan & Davé (2012) Narayanan, D., & Davé, R. 2012, MNRAS, 423, 3601
- Narayanan & Hopkins (2013) Narayanan, D., & Hopkins, P. F. 2013, MNRAS, 433, 1223
- Padoan et al. (2012) Padoan, P., Haugbølle, T., & Nordlund, Å. 2012, ApJ, 759, L27
- Padoan et al. (1997) Padoan, P., Nordlund, A., & Jones, B. J. T. 1997, MNRAS, 288, 145
- Pontzen et al. (2008) Pontzen, A. et al. 2008, MNRAS, 390, 1349
- Scannapieco et al. (2011) Scannapieco, C., White, S. D. M., Springel, V., & Tissera, P. B. 2011, MNRAS, 417, 154
- Shen et al. (2010) Shen, S., Wadsley, J., & Stinson, G. 2010, MNRAS, 407, 1581
- Stinson et al. (2006) Stinson, G., Seth, A., Katz, N., Wadsley, J., Governato, F., & Quinn, T. 2006, MNRAS, 373, 1074
- Treu et al. (2010) Treu, T., Auger, M. W., Koopmans, L. V. E., Gavazzi, R., Marshall, P. J., & Bolton, A. S. 2010, ApJ, 709, 1195
- van Dokkum & Conroy (2011) van Dokkum, P. G., & Conroy, C. 2011, ApJ, 735, L13
- Wadsley et al. (2004) Wadsley, J. W., Stadel, J., & Quinn, T. 2004, New Astronomy, 9, 137
- Weidner et al. (2013) Weidner, C., Ferreras, I., Vazdekis, A., & La Barbera, F. 2013, MNRAS
- Wise et al. (2012) Wise, J. H., Turk, M. J., Norman, M. L., & Abel, T. 2012, ApJ, 745, 50