Dynamic synchrotron X-ray imaging study of effective temperature in a vibrated granular medium
Abstract
We present a dynamic synchrotron X-ray imaging study of the effective temperature in a vibrated granular medium. By tracking the directed motion and the fluctuation dynamics of the tracers inside, we obtained of the system using Einstein relation. We found that as the system unjams with increasing vibration intensities , the structural relaxation time increases substantially which can be fitted by an Arrhenius law using . And the characteristic energy scale of structural relaxation yielded by the Arrhenius fitting is , where is the pressure and is the background particle diameter, which is consistent with those from hard sphere simulations in which the structural relaxation happens via the opening up of free volume against pressure.
pacs:
45.70.Mg, 05.70.Ln, 87.59.-eThe effective temperature has attracted a lot of interest in the study of out-of-equilibrium glassy systems like structural glass, colloids, foams, and granular materialsCugliandolo (2007). The introduction of can help the understanding of the aging and various transport phenomenaCugliandolo (2007) in these systems. This is evidenced by the fact that the structural relaxation processes under shear in these out-of equilibrium systems are controlled by the long-time scale instead of the short-time scale kinetic temperature Ilg and Barrat (2011); Cugliandolo et al. (1997); Berthier and Barrat (2002); O’Hern et al. (2004). Additionally, the study of can lead to a unified understanding of the jamming phase diagramHaxton et al. (2011) and the plastic deformation of solids under shearHaxton and Liu (2007); Haxton (2012). The usefulness of has also been validated by the fact that various definitions have yielded consistent values which makes it easy for experimental measurementsBarrat and Berthier (2000); Ono et al. (2002); Makse and Kurchan (2002). Recently, has become one of the key concepts in the development of mesoscopic thermodynamic theories of amorphous solid plasticity and soft glassy rheologyFalk and Langer (2011); Sollich and Cates (2012).
Granular systems are by nature out-of-equilibrium systems since they will simply come to rest without outside energy input. However, when agitated by shaking or shear, they can display gas-, fluid- and solid-like phases under different energy input strength, which prompts possible thermodynamic description of these phases. Kinetic theory originally based on ideal gas has been quite successful in describing highly agitated dilute granular gases after taking into account the dissipationJenkins and Savage (1983). In the dilute limit, based on the fluctuation-dissipation theorem can be defined, which justifies a thermodynamic approachD’Anna et al. (2003) despite energy non-equipartition and velocity non-Gaussian distributionFeitosa and Menon (2002). In this case, where is the vibration intensity and is on the same order of magnitude as the particle’s mean kinetic energyD’Anna et al. (2003). At the other limit, when the outside energy input is absent, the granular system undergoes a jamming phase transition into a disordered solid phaseLiu and Nagel (1998). Edwards first suggested that when a granular packing is slowly sheared, the system explores the stable mechanical states which is the same as taking a flat average of the jammed configurationsEdwards and Oakeshott (1989). The corresponding configurational temperature defined based on this ensemble turns out to be equivalent to the temperature based on fluctuation-dissipation theoremMakse and Kurchan (2002). In practice, volume or stress instead of energy is normally considered as the conserved quantity and concepts similar to temperature like compactivity, angoricity or a combination of these two have been introduced and studiedMakse and Kurchan (2002); Edwards and Oakeshott (1989); Edwards (2005); Blumenfeld and Edwards (2009); Henkes et al. (2012); Blumenfeld et al. (2012); Wang et al. (2012). Experimentally, this thermodynamic approach has been adopted in granular compaction studies in which the vibration intensity has been interpreted as the temperature-like parameterRichard et al. (2005) similar to the granular gas caseD’Anna et al. (2003). Between the slowly sheared state and the highly-agitated granular gas, the system is in a dense liquid state in which both particle collisions and perpetual contacts are important. This regime is important in many scientific and industrial applications and empirical constitutive relations have been introduced to describe its rheological behaviourMidi (2004); Jop et al. (2006). However, a more fundamental theory based on microscopic dynamics is needed to justify these models. Therefore, it is interesting to see whether a thermodynamic theory is still valid to the different phases of a granular system when it is sheared or shaken with increasing strength as it evolves from a static packing into a granular gas, , whether a valid and consistent can be defined for all phases. It is also important to understand what determines and how does it influence the glassy transport properties and solid plasticityHaxton and Liu (2007); Falk and Langer (2011); Langer (2008); Sollich et al. (1997).
In the current study, we investigated inside a three-dimensional (3D) mechanically driven granular system when it evolves from a dense granular fluid to a granular gas. By introducing tracers different from the background particles, we can monitor their trajectories inside the 3D granular medium non-invasively and dynamically using synchrotron X-ray imaging techniqueWang et al. (2008); Fezzaa and Wang (2008). We can observe the otherwise invisible particle motions inside the granular medium with high spatial and temporal resolutions. We obtained of the system using Einstein relation by tracking the directed motion and the fluctuation dynamics of the tracers inside. It has been observed that as the system unjams, the structural relaxation time increases substantially and an Arrhenius fitting of versus yields a characteristic activation dynamics energy scale similar to those from hard sphere simulations. It suggests that the structural relaxation in dense granular fluid can be interpreted similar to those in hard spheres as opening up free volume against background pressureHaxton (2012); Haxton and Liu (2007); Xu et al. (2009).
I Experimental setup and imaging technique
The experiment was carried out at 2BM beam line of the Advanced Photon Source of Argonne National Laboratory. The brilliant unfiltered “pink” X-ray beam from the synchrotron ring is utilized for the dynamic X-ray studies. The imaging system consists of a fast LAG scintillator coupled to a high-speed Cooke Dimax CMOS camera (m pixel, pixel array) via a microscope objective. The effective X-ray field-of-view is . The imaging system was placed m away from the sample to optimize the phase-contrast effects, which are very useful in the detection of the boundaries of the granular particles. A smooth acrylic container which has a square base with area was filled up to a height of mm using polydisperse glass particles with diameter mm and density g/cm3 (see schematic in Fig. 1(a)). Two steel tracer balls with diameter mm and density g/cm3 were buried near one corner of the container bottom. Subsequently, the container was mounted on an electromagnetic exciter which vibrates sinusoidally at a fixed frequency Hz. The effective vibration intensity was varied from g to g by changing the vibration amplitude , where g is the gravitational acceleration.
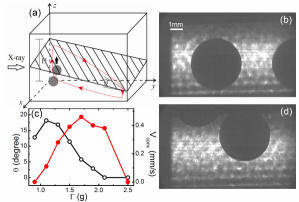
In Fig. 1(b) and (d), X-ray images of the granular medium (tracers within the X-ray field-of-view) before and after more than thirty-minutes of vibration are shown. The small glass particles appear as a speckle background in the images due to the X-ray multiple-scattering effects. The distinctive contrast between the tracers and the background is owing to the large X-ray absorption coefficient difference between steel and glass, which greatly facilitates the identification of the locations and speeds of the tracers.
II Convection and surface tilting
Macroscopic convection roll and surface tilting are both present in the system with the former serving as the major mechanism of Brazil nut effect for the ascension movements of the tracers under shakingKudrolli (2004); Schröter et al. (2006). As the vibration intensity is gradually increased, the granular medium first develops a large surface tilting angle at g without macroscopic flow (see fig. 1(c)). The granular bed is not fluidized and two tracers remain trapped at their original positions close to the container bottom. As increases to g, gradually decreases and a single convection roll develops, which drags the tracers to move upward. This is consistent with previous study that the unjamming transition is concurrent with the appearance of convection and surface tiltingPhilippe and Bideau (2003). The convection speeds are calculated by averaging the directed motion of background glass particles within the convection roll whose trajectories could be tracked at different . As shown in Fig. 1(c), the convection speed reaches maximum at intermediate . When is above g, the granular medium turns into a granular gas and both surface tilting and convection disappear. Visual inspection from the top reveals that only rapid colliding and rattling motions of the granular particles can be seen which is different from the convective regime where the particles are in seemingly permanent contacts with each other during the flow. The progression of the phenomena suggests that as increases, the system first unjams, then turns into a dense granular fluid, and subsequently into a granular gas.
III Motion characteristics of the tracers
We took X-ray images at an imaging speed of fps and tracked the tracers’ displacements along both and directions (see Fig. 1(a)) using an image processing routine. To avoid the artefacts brought by tracking the particle displacements at different phases of the vibration, we only analyse the images at the same phases which yields an effective imaging speed of fps. Tracers’ motions under three typical are shown in the movies of the supplementary materials. We also checked the reproducibility of the vibration motion by monitoring objects fixed on the shaker and found its position variance from different vibration cycles are negligible.
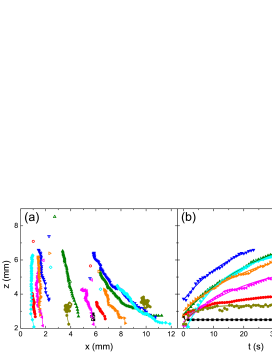
Figure 2(a) shows the trajectories of both tracers in the plane. Due to the initial position difference in the convection roll, the left tracer shows an almost -direction motion while the right one has a large -direction displacement component. The terminal equilibrium positions of the tracers were recorded after more than thirty-minutes of vibration and are marked by open symbols in Fig. 2(a). Fig. 2(b) plots the left tracer’s vertical height vs. time for different . Similar to the observation in a split-bottom Couette shear experiment, the tracers’ vertical trajectory seems to satisfy an exponential behaviorNichol et al. (2010); Nichol and Hecke (2012) which suggests an viscous-type of force is in action. By numerically differentiating the trajectory curves, we obtain the curves as shown in Fig. 3, where is the tracer’s vertical velocity.
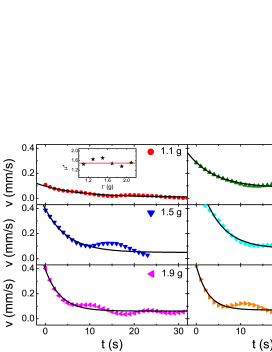
The curves can be fitted by an exponential law
| (1) |
where () is the initial (final) velocity, and is a characteristic time.
IV Equation of motion and effective viscosity
In order to obtain using the Einstein relation , where is the viscosity and is the diffusion constantGeng and Behringer (2004); Zik et al. (1992), we obtain and by measuring the viscous drag force on the tracer and its fluctuation dynamics respectively. There is still no generally accepted drag force model in granular medium for both fluidized or nonfluidized granular systems despite long-term study. Empirical constitutive relation using dynamic friction coefficient based on inertial number has been quite successful in describing the dense flow regimeMidi (2004). Recent study has also found that the effective friction coefficient increases with the drag velocity in addition to a linear depth dependencyHarich et al. (2011). Similarly, it has been observed that a granular system under shear behaves very similarly to a simple fluid which satisfies typical Archimedes’ law and has well-defined effective viscosityNichol et al. (2010); Nichol and Hecke (2012); Tripathi and Khakhar (2011). In the following, we adopt a force model to account for the aforementioned exponential law observed. We separate the drag force into a frictional term and a “viscous” termSeguin et al. (2011). We assume that there are three forces in action: namely, the effective gravity of tracer g, the Coulomb friction force , and the viscous drag force due to convection. The tracers’ movements are over-damped, so the inertial effects can be neglected. , the sum of the Coulomb friction force and viscous drag force will balance the tracer’s effective gravity,
| (2) |
It is well-known that the Coulomb friction force has a linear depth-dependencyHarich et al. (2011) with the form , where is the effective friction coefficient, here we assume is a constant without any drag velocity dependency, is the effective density of the granular medium, is the surface height, and is the tracer’s height at time . We also adopt a Stokes-type viscous drag force . We insert the expressions of and into Eq. (2) and simplify it to have the form
| (3) |
where and are constants, .
It is obvious there exists two unknown parameters in the equation, including both and . However, the magnitude of these two parameters can be determined since they are proportional to each other as expressed in Eq. 4 when we try to match the time constant of Eq. 3 with the experimentally measured . Additionally, the two forces have to balance the tracer’s gravity as expressed in Eq. 5, which specifies the force balance equation the tracer satisfied at . In the current study, we obtain and by solving these two equations,
| (4) |
| (5) |
One thing to note is that we have assumed that both and are constant within the narrow range investigated. The solution yields as shown in the inset of Fig. 3, and relative values used in calculation are listed in Table 1. The rather constant value of for different suggests the consistency of our force model. Interestingly, the value of is larger than the static frictional one as determined by repose angle measurement which is also observed in previous measurementsCaballero-Robledo and Clément (2009); Harich et al. (2011). We notice that in our system, the tracers in most cases do not rise all the way to the top of the surface and the calculated magnitude of and are consistent with this observation, , when g, in the early stage, the frictional force is N, accounting for about of the effective gravity while the viscous drag force is N, which accounts for the rest . As the tracer rises to equilibrium position when the drag velocity is maximum, the viscous drag force increase to N. However, it still cannot balance the gravity alone.
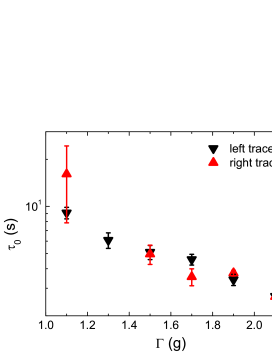
The resulting and the corresponding is shown in Fig. 4. It is observed that as decreases, increases by about a decade.
| (g) | (∘) | (mm/s) | (mm/s) | (mm) | (s) | (Pas) | ( m2/s) | (s) | () | () | |
|---|---|---|---|---|---|---|---|---|---|---|---|
| 0.9 | 12.8 | 0 | / | / | / | / | / | / | / | / | / |
| 1.1 | 18.2 | 0.11 | 0.02 | 3.6 | 9.1 0.8 | 1.5 | 698 59 | 7.4 | 1197.8 | 0.20 0.02 | 1.1 |
| 1.3 | 16.9 | 0.28 | 0.11 | 4.7 | 6.1 0.7 | 1.7 | 466 53 | 81.5 | 109.0 | 1.5 0.2 | 2.1 |
| 1.5 | 11.4 | 0.39 | 0.09 | 5.4 | 5.1 0.5 | 1.7 | 391 41 | 122.5 | 72.5 | 1.9 0.2 | 7.6 |
| 1.7 | 5.8 | 0.46 | 0.16 | 4.3 | 4.6 0.4 | 1.5 | 351 28 | 235.0 | 37.8 | 3.2 0.3 | 10.8 |
| 1.9 | 2.9 | 0.40 | 0.11 | 3.3 | 3.4 0.3 | 1.4 | 260 21 | 229.0 | 38.8 | 2.3 0.2 | 15.1 |
| 2.1 | 0 | 0.38 | 0.11 | 3.8 | 2.7 0.3 | 1.5 | 205 21 | 233.0 | 38.1 | 1.9 0.2 | 12.4 |
| 2.5 | 0 | 0 | / | / | / | / | / | / | / | / | 493.0 |
V Fluctuation and diffusion dynamics
We studied the tracers’ diffusion dynamics along -direction. To obtain the fluctuating dynamics only, we subtract trajectories along -direction by their smoothed counterparts using exponential fits. The corresponding mean square displacement (MSD) as a function of under different is shown in Fig. 5(a) and (b).
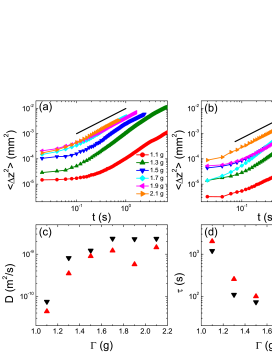
The diffusive dynamics is clearly established and from each curve we can extract a diffusion constant . We also define the structural relaxation time as the corresponding time scale when the MSD of each curve equals . These two parameters are plotted in Fig. 5 (c) and (d) respectively as functions of . Overall, the diffusion constants increases as increases initially and saturates at large , while has a decreasing trend as increases and also saturates at large .
VI Effective temperature and activation energy
The measured remains above for the wide range of studied as shown in fig. 6(a) and listed in Table 1. This energy roughly equals where is the glass particle mass, which is reminiscent of the measurement using a Couette cell under constant shearSong et al. (2005). To understand the significance of , we studied how structural relaxation time is dependent on . Similar approach has been adopted to study the compaction process of granular packings under tappingRichard et al. (2005), where is used instead of and an Arrhenius law has been adoptedReddy et al. (2011). In the following, we follow the same strategy and compare our results with those from a hard sphere simulation on a more quantitative fashion. To be consistent with the dimensionless results from the hard sphere simulation, we normalize and with the typical energy scale and time scale . We notice that our system can be assumed to be under fairly constant pressure Pa when the tracer position is around mm, and is the approximate number of glass particles above the tracer in the system with packing fraction .
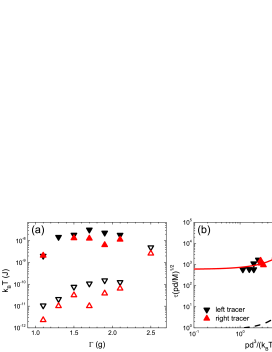
Once is known, we obtain the dimensionless relation between and as shown in Fig. 6(b). The divergence of towards jamming is fitted using a simple Arrhenius law
| (6) |
where and . The fitting result yields an activation dynamics energy scale , which we found to be consistent with that of out-of-equilibrium hard sphere fluid under shearHaxton (2012) where and that of thermal hard sphere fluidXu et al. (2009) where . This suggests that the structural relaxation energy scale in vibrated dense granular medium is similar to those in hard spheres systems where structural relaxation happens by opening up of free volume against the pressureHaxton (2012); Xu et al. (2009).
VII Kinetic temperature
We also define a lower bound estimate of the kinetic temperature of the tracers using the mean square fluctuating velocity along -direction during a time period of s. This corresponds to our shortest time resolution in resolving the particle displacements. The reason is a lower bound is due to the fact that even in dense flows, ballistic motions of granular particles can still be present and will lead the real higher than . The measured is shown in fig. 6(a). It is clear that is substantially lower than over the whole range and only reaches the same order of magnitude with our measured when the system turns into a gas state at g. At this , the dominating particle motions are colliding motions. This contrasts with the small regime when the particles are seemingly in frictional motions against each other. When g, is on the same order of magnitude as which also suggests that the system reaches thermal equilibrium between its short- and long-time dynamics when it turns into a granular gas.
VIII Conclusions
In the current study, we have examined the complex behaviour of a dense granular system under vibration very close to the jamming density. It is found that close to jamming, the system does not show a simple in highly agitated granular mediumD’Anna et al. (2003) where the is on the same order of magnitude as the tracers’ kinetic temperature . Instead, we observe that is controlled by pressure Xu and O’Hern (2005) which is owning to the possible universal structural relaxation mechanism similar to hard spheresHaxton (2012); Xu et al. (2009). We also notice that similar energy scale could be relevant for plastic deformation. How is related to STZFalk and Langer (2011) or SGR theorySollich et al. (1997) remains future study.
IX Acknowledgement
We thank Thomas K. Haxton and Ning Xu for many helpful discussions. Some of the initial work has been carried out at BL13W1 beamline of Shanghai Synchrotron Radiation Facility (SSRF), and the work is supported by the Chinese National Science Foundation No. 11175121, and National Basic Research Program of China (973 Program; 2010CB834301). The use of the APS was supported by the U. S. Department of Energy, Office of Science, Office of Basic Energy Sciences, under Contract No. DE-AC02-06CH11357.
References
- Cugliandolo (2007) L. F. Cugliandolo, Europhys. Lett. 79, 26001 (2007).
- Ilg and Barrat (2011) P. Ilg and J.-L. Barrat, J. Phys. A: Math. Theor. 44, 483001 (2011).
- Cugliandolo et al. (1997) L. F. Cugliandolo, J. Kurchan, and L. Peliti, Phys. Rev. E 55, 3898 (1997).
- Berthier and Barrat (2002) L. Berthier and J.-L. Barrat, J. Chem. Phys. 116, 6228 (2002).
- O’Hern et al. (2004) C. S. O’Hern, A. J. Liu, and S. R. Nagel, Phys. Rev. Lett. 93, 165702 (2004).
- Haxton et al. (2011) T. K. Haxton, M. Schmiedeberg, and A. J. Liu, Phys. Rev. E 83, 031503 (2011).
- Haxton and Liu (2007) T. K. Haxton and A. J. Liu, Phys. Rev. Lett. 99, 195701 (2007).
- Haxton (2012) T. K. Haxton, Phys. Rev. E 85, 011503 (2012).
- Barrat and Berthier (2000) J.-L. Barrat and L. Berthier, Phys. Rev. E 63, 012503 (2000).
- Ono et al. (2002) I. K. Ono, C. S. O’Hern, D. J. Durian, S. A. Langer, A. J. Liu, and S. R. Nagel, Phys. Rev. Lett. 89, 095703 (2002).
- Makse and Kurchan (2002) H. A. Makse and J. Kurchan, Nature 415, 614 (2002).
- Falk and Langer (2011) M. L. Falk and J. S. Langer, Annu. Rev. Condens. Matter Phys. 2, 353 (2011).
- Sollich and Cates (2012) P. Sollich and M. E. Cates, Phys. Rev. E 85, 031127 (2012).
- Jenkins and Savage (1983) J. Jenkins and S. Savage, J. Fluid Mech. 130, 187 (1983).
- D’Anna et al. (2003) G. D’Anna, P. Mayor, A. Barrat, V. Lotero, and F. Nori, Nature 424, 909 (2003).
- Feitosa and Menon (2002) K. Feitosa and N. Menon, Phys. Rev. Lett. 88, 198301 (2002).
- Liu and Nagel (1998) A. J. Liu and S. R. Nagel, Nature 396, 21 (1998).
- Edwards and Oakeshott (1989) S. F. Edwards and R. Oakeshott, Physica A 157, 1080 (1989).
- Edwards (2005) S. F. Edwards, Physica A 353, 114 (2005).
- Blumenfeld and Edwards (2009) R. Blumenfeld and S. F. Edwards, J. Phys. Chem. B 99, 038002 (2009).
- Henkes et al. (2012) S. Henkes, C. S. O’Hern, and B. Chakraborty, Phys. Rev. Lett. 109, 238001 (2012).
- Blumenfeld et al. (2012) R. Blumenfeld, J. F. Jordan, and S. F. Edwards, Phys. Rev. Lett. 109, 238001 (2012).
- Wang et al. (2012) K. Wang, C. Song, P. Wang, and H. A. Makse, Phys. Rev. E 86, 011305 (2012).
- Richard et al. (2005) P. Richard, M. Nicodemi, R. Delannay, P. Ribière, and D. Bideau, Nat. Mater. 4, 121 (2005).
- Midi (2004) G. D. R. Midi, Eur. Phys. J. E 14, 341 (2004).
- Jop et al. (2006) P. Jop, Y. Forterre, and O. Pouliquen, Nature 441, 727 (2006).
- Langer (2008) J. S. Langer, Phys. Rev. E 77, 061309 (2008).
- Sollich et al. (1997) P. Sollich, F. Lequeux, P. Hébraud, and M. E. Cates, Phys. Rev. Lett. 78, 2020 (1997).
- Wang et al. (2008) Y. J. Wang, X. Liu, K.-S. Im, W.-K. Lee, J. Wang, K. Fezzaa, D. L. S. Hung, and J. R. Winkelman, Nat. Phys. 4, 305 (2008).
- Fezzaa and Wang (2008) K. Fezzaa and Y. J. Wang, Phys. Rev. Lett. 100, 104501 (2008).
- Xu et al. (2009) N. Xu, T. K. Haxton, A. J. Liu, and S. R. Nagel, Phys. Rev. Lett. 103, 245701 (2009).
- Kudrolli (2004) A. Kudrolli, Rep. Prog. Phys. 67, 209 (2004).
- Schröter et al. (2006) M. Schröter, S. Ulrich, J. Kreft, J. B. Swift, and H. L. Swinney, Phys. Rev. E 74, 011307 (2006).
- Philippe and Bideau (2003) P. Philippe and D. Bideau, Phys. Rev. Lett. 91, 104302 (2003).
- Nichol et al. (2010) K. Nichol, A. Zanin, R. Bastien, E. Wandersman, and M. V. Hecke, Phys. Rev. Lett. 104, 078302 (2010).
- Nichol and Hecke (2012) K. Nichol and M. V. Hecke, Phys. Rev. E 85, 061309 (2012).
- Geng and Behringer (2004) J. Geng and R. P. Behringer, Phys. Rev. Lett. 93, 238002 (2004).
- Zik et al. (1992) O. Zik, J. Stavans, and Y. Rabin, Europhys. Lett. 17, 315 (1992).
- Harich et al. (2011) R. Harich, T. Darnige, E. Kolb, and E. Clément, Europhys. Lett. 96, 54003 (2011).
- Tripathi and Khakhar (2011) A. Tripathi and D. V. Khakhar, Phys. Rev. Lett. 107, 108001 (2011).
- Seguin et al. (2011) A. Seguin, Y. Bertho, P. Gondret, and J. Crassous, Phys. Rev. Lett. 107, 048001 (2011).
- Caballero-Robledo and Clément (2009) G. A. Caballero-Robledo and E. Clément, Eur. Phys. J. E 30, 395 (2009).
- Song et al. (2005) C. Song, P. Wang, and H. A. Makse, Proc. Natl. Acad. Sci. 102, 2299 (2005).
- Reddy et al. (2011) K. A. Reddy, Y. Forterre, and O. Pouliquen, Phys. Rev. Lett. 106, 108301 (2011).
- Xu and O’Hern (2005) N. Xu and C. S. O’Hern, Phys. Rev. Lett. 94, 055701 (2005).