Jet Production Measurements at CMS
Abstract:
Jet production cross-section measurements are presented. The measurements are done with the data from Large Hadron Collider (LHC) proton-proton collisions, collected with the Compact Muon Solenoid (CMS) detector. The inclusive jet production measurements are carried out with data collected at and with total integrated luminosity () and respectively. The dijet production measurements are carried out with the dataset. Jets are reconstructed with the anti- clustering algorithm with size parameter . The measured cross sections are corrected for detector effects and compared to perturbative QCD predictions at NLO, corrected for NP factors, using various sets of PDF. The inclusive jet cross-section ratio of the jets reconstructed with the anti- (AK) algorithm and two radius parameter and are also presented. The data used is CMS data corresponding to . Significant discrepancies are found comparing the data to leading order calculations and to fixed order calculations at NLO, corrected for NP effects, whereas simulations with NLO matrix elements matched to the parton showers describe the data quite well. A study of color coherence effects in pp collisions has been performed with the data collected at and . The measurement of the azimuthal angular correlation between the second and third jets is compared to the predictions of Monte Carlo models with different implementations of color coherence effects.
1 Introduction
Quantum Chromo Dynamics (QCD) is a gauge quantum field theory which describes the interaction among sub-nuclear colored partons, viz. quarks, gluons etc. The theory predicts scattering cross-section of partons for a fixed order of perturbation theory. In a multi-hadron collision scenario at high center of mass (COM) energy, the fundamental interacting particles are partons whose initial four-momenta are not fixed and their distribution is described by parton distribution function (PDF). The outgoing scattered partons fragment and hadronize to form colorless stable particles, viz. hadrons. The fixed order perturbative QCD (pQCD) calculations along with non-perturbative (NP) hadronization model and PDF parametrization, predicts the dynamics and cross-section of a hadron collision processes within uncertainty limits.
The QCD theory suffers from divergences originating from soft and collinear branching of the partons. In order to remove these divergences from the observables computed out of this theory, certain clustering algorithm are designed to cluster the outgoing colorless hadrons. The clustered particles are combinedly called jet whose four momenta carries a signature of parton level kinematics in the collision phenomena. By virtue of these recombination algorithms, the jet observables are free from any kind of divergence, making them a key variable of study in experimental measurements.
At LHC proton-proton collisions take place at high COM energy ( few TeV). At LHC energy scale the fundamental colliding objects are gluons and quarks and hence QCD is the most dominant interaction process with very large cross-section. In order to test and validate QCD theory predictions at LHC, jet observable measurements become an important and interesting study. These measurements at LHC help to test and validate QCD predictions at unexplored kinematic regimes. Using the jet variables one can optimize the hadronization and parton shower models and also can constrain the parameters of PDF’s. The running of strong coupling constant in the new kinematic regimes can also be extracted using the jet observables. QCD processes act as a major background to other standard model process and new physics searches. A precise estimation of QCD background becomes essential in those studies, which can be accurately done using jet observables.
2 Jet reconstruction and jet energy correction
In CMS detector at LHC [1], several event reconstruction techniques are used and one of the most popular among them is the paricle flow (PF) technique. PF algorithm [5] is an event reconstruction technique which attempts to reconstruct and identify all stable particles in an event from all sub-detector components viz. tracker, electromagnetic calorimeter (ECAL), hadronic calorimeter (HCAL), muon detector. In a typical collision scenario, the stable particles reconstructed are , which along with neutron and proton are reconstructed by jet clustering algorithm to form jets.
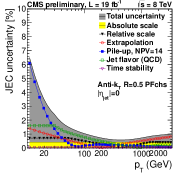
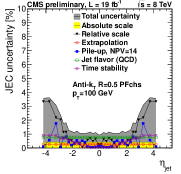
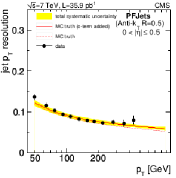
One of the widely used jet reconstruction algorithm in CMS is anti- (AK) algorithm [6] with and . The reconstructed jet four momenta are corrected for the additional energy reconstructed, originating from multiple proton-proton scattering vertices in a single bunch crossing, called pileup. The jet four momenta are further corrected to compensate for the non uniform detector response along jet pseudo-rapidity (), viz. residual correction and jet transverse momentum () termed as absolute correction. An additional correction is also imposed to account for data-MC mismatch, called residual correction. In Fig.1 the uncertainty on the jet energy scale (JES), due to jet energy correction (JEC) is shown in the first two plots [2]. With the new derived sources, the total JES uncertainty goes down below for the central jets around jet . The same is true for high in central region. The right most plot shows the jet energy resolution as a function of jet for central jets, which is about for jet .
3 Jet cross-section measurements
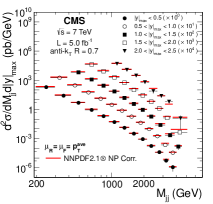
At CMS jet production double differential cross-sections are measured as a function of jet and dijet invariant mass () for different rapidity bins, respectively [3, 4]. The jets are selected with tight jet identification criteria, to reject detector level noise, followed by JEC applied on selected jets. The double differential cross section are measured using the formula
| (1) |
| (2) |
where is the total integrated luminosity, is the trigger efficiency, is the number of jets in a bin. , , are the inclusive jet , and jet rapidity bin widths respectively and is the unfolding correction factor.
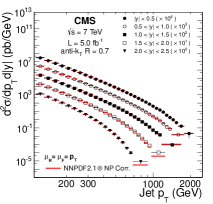
For the data collected at () with CMS detector, the inclusive jet cross-section measurements extend upto jet and rapidity with an interval of . The dijet invariant mass measurement extends upto with the similar rapidity coverage as inclusive jet measurements as shown in Fig.2.
For the inclusive jet measurement, events are required to contain at least one tight jet with 114 GeV, 196 GeV, 300 GeV, 362 GeV, and 507 GeV for the five single-jet high level triggers (HLT) used respectively. For the dijet measurement, at least two tight reconstructed jets with 60 GeV and 30 GeV are required. The measured spectra are unfolded using Bayesian unfolding (D’Agostini)[7] technique to remove detector smearing effects. The measured cross-section is then compared to NLO theory predictions corrected by the NP correction factor. The later is required in order to account for the hadronization and multi-parton interaction (MPI) effects.
The next to leading (NLO) theory calculation is done by NLOJet++ package using fastNLO program [8] using five different PDF sets viz. ABKM09, MSTW2008, HERA1.5, CT10, NNPDF2.1. The renormalization scale () and factorization scale () set for the NLO calculation are the jet and for the inclusive and dijet production cross-section calculations, respectively. The scale uncertainty due to fixed order theory calculation is estimated by varying the and for the six points , where is kept fixed to jet or for the inclusive and dijet cross-section calculations respectively. The NP factor is derived by taking the ratios of two cross-section predictions, calculated by tuning on and off the hadronization and MPI effects. For this analysis, the NP correction factor is derived using PYTHIA6 (uses Lund string fragmentation model) and HERWIG++ (uses cluster fragmentation model) generators and difference between these two predictions are quoted as the uncertainty in the NP factor.
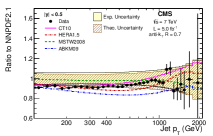
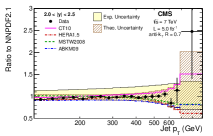
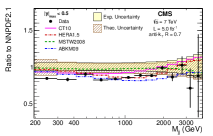
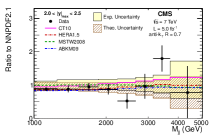
In Fig.3 we see that in the central rapidity region (), data is within 5-10 agreement with the NNPDF2.1 theory prediction. The CT10 prediction fluctuates up-to 20 in this bin and the total theoretical and experimental uncertainties are within 5-20 limit for the inclusive jet case. For the outer bin () the experimental uncertainty reaches up-to 40. For the dijet measurement the data is within 20 agreement with NNPDF2.1 theory for central region where as deviates up-to 80 in the outer bin where experimental uncertainty also increases to 60.
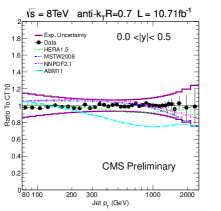
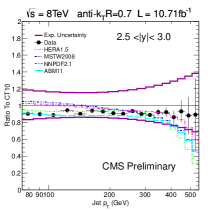
An analogous inclusive jet cross-section measurement is carried out with () [4] CMS data. In this analysis the measurement extends in rapidity upto and the jet . For the theory comparison ABM11 PDF set is used instead of ABKM09. The six single jet HLT triggers used to reconstruct the spectrum have the threshold values 40 GeV, 80 GeV, 140 GeV, 200 GeV, 240 GeV and 320 GeV respectively. As seen in Fig.4, for the central region, data is within 5 agreement to CT10 theory prediction whereas it fluctuates up to 10 for the outer most bin. The total experimental uncertainty in central region varies within 5-20 but reaches to 40 for the outermost rapidity bin. In the outer rapidity bin, for the high region, the theory predictions mismatch among themselves significantly.
4 Cross-section ratio measurements
The collinear branching of partons in a QCD process carry away the momenta carried by the original mother parton. In order to reconstruct the four momenta of the original hard scattered partons, it is essential to cluster all these radiations in jet clustering and hence a wider jet radius is preferable. At the same time jets with larger radii gets more contribution from pileup, distorting their four momenta distribution. So an optimal intermediate value of the jet radius is preferable in order to balance between these two effects.
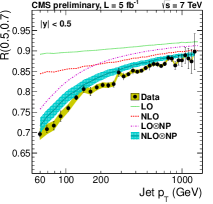
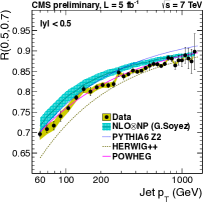
In order to optimize jet radius, a measurement of inclusive jet cross section ratio (R(0.5,0.7)) is carried out in CMS where the jets are reconstructed with AK5 and AK7 algorithm [9]. The dataset used is () CMS data. In this case the jet measurement goes down to 60 GeV. In Fig.5 the comparison between measured ratio to different order theory calculations of R(0.5,0.7) are shown. The theory prediction matches with data well compared to predictions. The pQCD predictions without NP corrections are in clear disagreement with the data. A feature of the ratio R(0.5,0.7) is that the ratio doesn’t change significantly for a given bin across the rapidity range . The comparison of data with theories from different generator prediction shows that POWHEG matches with data best in most of the region. The fixed order pQCD calculation matched with parton shower has in general a better agreement with data compared to pQCD calculations corrected for the NP effects. In this measurement pileup is the main source of experimental uncertainty as two jets with different radii have different amount of pileup clustering.
This measurement shows that collinear radiation is one of the main source of discrepancy between measurement and pQCD theory predictions. Hence larger radius jets are more reliable for absolute cross-section measurements and PDF fits. The optimal radius is a trade-off between collinear radiation(), NP effects() and pileup contribution().
5 Color coherence measurement
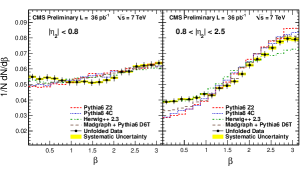
In a parton scattering process, the outgoing color connected final state partons keep on interfering among themselves while fragmentation and this phenomena is known as color coherence. The angulur correlation between 2nd and 3rd jet in an event (ordered by ) is measured with CMS () data [10]. The variable designed to study the color coherence effect is . In presence of color coherence, an enhancement of 3rd jet population is expected in the region and a suppression is expected in the region . The events are selected with at-least 3 jet whose and .
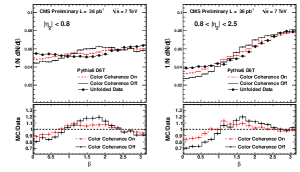
In Fig.6 we see that the distribution of , compared between data and different MC predictions. In general HERWIG++ shows a better agreement with data except in the forward region . The middle and the right plot in the same figure shows that MC predictions with color coherence effect switched on gives better agreement with data compared to the MC distributions with color coherence turned off. This study verifies the color correlation among outgoing partons in a hard scattering process.
6 Summary
In this proceedings, first we discussed about PF algorithm and jet reconstruction in CMS. The multiplicative jet energy correction procedure is described followed by a discussion on evaluation of JES uncertainties from different sources as evaluated from the full CMS data. Next we discuss about the absolute jet production cross-section measurements at CMS for both datasets. Double differential inclusive and dijet production cross-section measurements are reported along with the comparison to theory predictions from five different PDF sets.
Cross-section ratios of two different jet radii were reported following the discussion on absolute cross-section measurements. A comparison between data and different MC generators show that fixed order pQCD prediction matched with parton shower in general agrees with data well. This results also optimize the jet radius to be fixed in order to incorporate the collinear branching of partons, NP effects and pileup effect.
Finally we discussed the study of color-coherence effects in the fragmentation of final state partons for three-jet final states. Color-coherence effects were demonstrated by switching it on and off in PYTHIA6 spectrum and comparing it with the measured observable which clearly showed a favour towards data with color-coherence effects turned on.
In general jet physics study is a very vibrant activity within CMS. An excellent jet performance is obtained for the two LHC runs. Starting from jet object reconstruction to several different measurements are carried out within CMS. Some more results of extracting running and PDF fitting with the measured jet cross-sections are coming up. Overall the jet studies at CMS are leading towards better understanding of QCD in new energy regime.
References
-
[1]
The CMS experiment at the CERN LHC
The CMS Collaboration, 2008 JINST 3 S08004 -
[2]
Status of the 8 TeV Jet Energy Corrections and Uncertainties based on 11 of data in CMS
The CMS Collaboration, CMS-DP-2013-011 -
[3]
Measurements of differential jet cross sections in proton-proton collisions at with the CMS detector
The CMS Collaboration, Phys. Rev. D 87, 112002 (2013) -
[4]
Measurement of the double-differential inclusive jet cross section at = 8 TeV with the CMS detector
The CMS Collaboration, CMS-PAS-SMP-12-012 -
[5]
Particle-Flow Event Reconstruction in CMS and Performance for Jets, Taus, and MET
The CMS Collaboration, CMS-PAS-PFT-09-001 -
[6]
The anti- jet clustering algorithm
Matteo Cacciari et al, JHEP04(2008)063 -
[7]
Unfolding algorithms and tests using RooUnfold.
T. Adye, Arxiv:data-an/1105.1160 - [8] fastNLO: Fast pQCD calculations for PDF fits T. Kluge, K. Rabbertz, M. Wobisch, Arxiv:hep-ph/0609285v2
-
[9]
Measurement of the ratio of inclusive jet cross sections with radius parameters R=0.5 and R=0.7 using the anti-kt algorithm
The CMS Collaboration, CMS-PAS-SMP-13-002 - [10] Measurement of color coherence effects in pp collisions at The CMS Collaboration, CMS-PAS-SMP-12-010