Constraining the age of the NGC 4565 H i Disk Warp: Determining the Origin of Gas Warps
Abstract
We have mapped the distribution of young and old stars in the gaseous H i warp of NGC 4565. We find a clear correlation of young stars ( Myr) with the warp, but no coincident old stars ( Gyr), which places an upper limit on the age of the structure. The formation rate of the young stars, which increased Myr ago relative to the surrounding regions, is yr-1 kpc-2. This implies a Gyr depletion time of the H i warp, similar to the timescales calculated for the outer H i disks of nearby spiral galaxies. While some stars associated with the warp fall into the asymptotic giant branch (AGB) region of the color magnitude diagram, where stars could be as old as 1 Gyr, further investigation suggests that they may be interlopers rather than real AGB stars. We discuss the implications of these age constraints for the formation of H i warps, and the gas fueling of disk galaxies.
Subject headings:
galaxies: formation – galaxies: individual (NGC 4565) - galaxies: spiral – galaxies: stellar content – galaxies: structure – techniques: photometric1. Introduction
The neutral hydrogen (H i) gaseous disks of many nearby disk galaxies are warped. From a sample of 26 edge-on galaxies, García-Ruiz et al. (2002b) postulated that all H i disks that extend beyond their optical counterpart are warped. Unlike stellar warps, the onset of the H i warp is often abrupt, discontinuous, and in edge-on systems coincides with the break in the exponential disk profile (Briggs, 1990; van der Kruit, 2007). However, the mechanisms forming these distortions are still unclear (for review, see van der Kruit & Freeman, 2011).
One possible explanation is that the warp is a manifestation of ongoing gas accretion (e.g., Macciò et al., 2006; Spavone et al., 2010). Many galaxies show possible signs of accretion in their H i outskirts in the form of bridges to companions, asymmetric density or velocity fields, and gas clouds with anomalous velocities (for review see Sancisi et al., 2008). However, the combined contribution of these phenomena is unable to support the current star formation rates (SFRs) found in the local universe777Although, as noted by Hanish et al. (2006), such estimates of star-formation-rate densities carry large systematic uncertainties. (Tinsley, 1980). Indeed, providing sufficient gas to fuel star formation (SF) remains a key issue in CDM cosmology. Recent theoretical work suggests that for galaxies up to * in size, this gas is primarily accreted as cold, unshocked gas (e.g., Dekel & Birnboim, 2006). For larger systems, the quiescent cooling of shock-heated gas after the last major merger plays the dominant role (e.g., Brook et al., 2004; Robertson et al., 2006). At early times (), colder gas is able to partially penetrate this hot halo through filaments. Although, whether this gas remains cold or is shock heated before accretion is still debated (e.g., Kereš et al., 2005; Brooks et al., 2009; Nelson et al., 2013). If gas warps are a sign of recent gas accretion, then they must play a significant role in galaxy formation and evolution (e.g., Ostriker & Binney, 1989; Binney, 1992; Jiang & Binney, 1999).
However, disk warps may be formed by mechanisms unrelated to accretion (e.g., Binney, 1978; Hunter & Toomre, 1969). For instance, dynamical studies have also reproduced warps purely through gravitational effects. These torques may be due to a misalignment between the angular momentum of the disk and dark-matter halo (Debattista & Sellwood, 1999) or by tidal interactions with nearby galaxies (e.g., Hunter & Toomre, 1969), satellites (e.g., Weinberg & Blitz, 2006), or dark-matter substructure (Kazantzidis et al., 2008). Non-gravitational torques are also possible, e.g., from passage through the intergalactic medium (Kahn & Woltjer, 1959) or intergalactic magnetic fields (Battaner et al., 1990). Although, such magnetohydrodynamical processes may not be strong enough to cause the observed warp angles (Binney, 1992, 2000).
Placing constraints on the age of H i warps, and so determining how long they remain coherent, may help determine their origin (e.g., Roškar et al., 2010). Hence, we need to identify the associated stellar populations, which will encode a record of the formation of the structure. SF beyond the optical disk was first inferred in the outer disks of nearby galaxies via the detection of faint Hii regions (Ferguson et al., 1998a, b). This extreme SF was subsequently confirmed by observations of outer-disk UV emission (Thilker et al., 2007). However, as discussed in de Jong (2008), the inherent degeneracies between stellar age, metallicity, and reddening due to dust preclude a meaningful measurement of the stellar content of these outer regions from integrated-light studies. Studies of resolved stellar populations mitigate many of these problems and allow us to probe the extremely low stellar densities found in the outer envelopes of nearby galaxies (e.g., Radburn-Smith et al., 2012).
In this paper, we present the first study of the resolved stellar populations located within a distinct H i warp. We use imaging from the Hubble Space Telescope () Advanced Camera for Surveys (ACS) of NGC 4565. This edge-on Sb galaxy resides at a distance of 11.90.3 Mpc (Radburn-Smith et al., 2011) and is believed to host a bar and pseudobulge (Kormendy & Barentine, 2010). In Section 2, we discuss the properties of the pronounced gas warp in this system. In Section 3, we describe the reduction of these data, which we then use in Section 4 to study the stellar component of the warp. We further analyze the association of asymptotic giant branch (AGB) stars with the warp in Section 5. In Section 6, we discuss the implications of this study for various formation mechanisms of H i warps before summarizing our findings in Section 7.
2. The Warp of NGC 4565
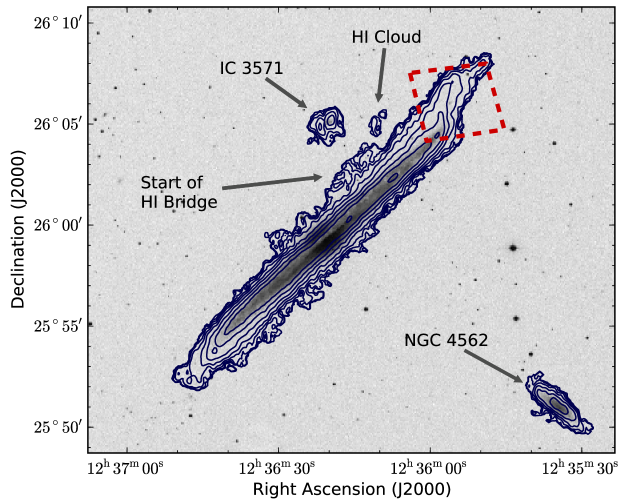
As first noted by Sancisi (1976), the H i disk of NGC 4565 is strongly warped, most notably on the northwestern (NW) side of the galaxy. Rupen (1991) calculated the gas mass of the NW component of the warp to be (c.f. for the entire NGC 4565 system, Heald et al., 2011). However, with evidence for a mild warp along the line of sight, Rupen (1991) suggested that the full warp is continuous around the edge of the disk and encompasses a total mass of , or about of the H i mass of the entire system. Rupen (1991) found this structure to be asymmetric, in that the upward and downward bending modes of the warp are not separated by 180° in azimuth but instead °. The authors note, however, that this apparent lopsidedness may be due to a lack of H i in the southern component of the warp rather than an inherent asymmetry. In Figure 1, the H i data from Dahlem et al. (2005) is overlaid as contours on a IIIaJ (blue) plate scan from the Second Palomar Observatory Sky Survey (POSS-II; Reid et al., 1991).
In order to present lower surface-brightness features, we have reprocessed the H i data, following a similar procedure to Walter et al. (2008). We first created a post-imaging mask by convolving the data cube to a 30″ 30″ resolution and selecting all pixels with flux densities greater than twice the noise in the convolved cube in three consecutive velocity channels. We then edited this mask by hand to remove spurious signals such as sidelobes, noise spikes, and other artifacts. The final mask was applied to the original unconvolved data and a new zeroth moment map was generated by summing the cleaned velocity channels.
Clearly evident in Figure 1 is the abrupt upturn (°) of the NW warp. This structure begins at 75 from the nucleus and coincides with a steep drop in both the density and the rotational velocity of the H i gas (Rupen, 1991). The distinct morphologies of this warp gas and the in-plane gas led van der Kruit (2007) to conclude that the two components are distinct, with the warp representing an accreting component. As evident in the contours of Figure 1, the warp appears to turnover and realign with the gas disk at greater distances, as first noted by Sancisi (1983).
In the optical, the upturn of the NW gaseous warp corresponds with a truncation of the main stellar disk (van der Kruit, 1979; Wu et al., 2002). Internal to this truncation, a mild warp is seen in the optical (van der Kruit, 1979; van der Kruit & Searle, 1981). Naeslund & Joersaeter (1997) have also argued for a possible extension of the optical disk beyond the truncation that coincides with the NW H i warp. In their -band observations with the 2.56 m Nordic Optical Telescope, they measured a surface brightness of mag arcsec-2 for this optical structure. However, they could not rule out this feature as a background galaxy.
Also evident in Figure 1 are the two companion systems. To the southwest is NGC 4562, for which Heald et al. (2011) find a regularly rotating H i disk with a total H i mass of . To the north is IC 3571 (; Heald et al., 2011), which shows evidence of interaction with NGC 4565. Specifically, a weak H i bridge is found between the disk of NGC 4565 and this companion galaxy, which exhibits a smooth change in velocity between the two systems (van der Hulst & Sancisi, 2005; Heald et al., 2011). The initial extension of this bridge from NGC 4565 can be seen as an extended shelf in Figure 1 at (R.A., decl.) (, 26°03′). We also find evidence in Figure 1 for a smaller overdensity, or cloud, of H i lying above the disk at –(, 26°05′) as also seen by Zschaechner et al. (2012). This overdensity appears connected to the bridge between NGC 4565 and IC 3571.
3. ACS Photometry
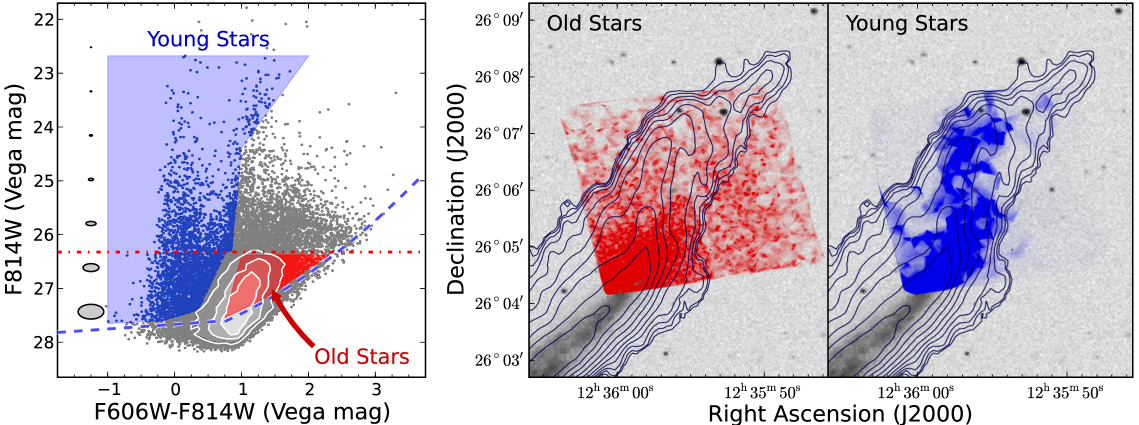
The ACS field covers the extent of the H i NW warp, as indicated in Figure 1 by a dashed box. The field was observed with exposures of 8266 s and 7340 s using the F606W and F814W filters, respectively ( GO program 12196). Each exposure was dithered to aid cosmic-ray rejection and to cover the chip gap. However, in the subsequent analysis, we removed detections from the chip gap region where the detection efficiency is less due to the shorter mean exposure time. We followed the same procedures for the data reduction as detailed by Radburn-Smith et al. (2011). This involved using SExtractor (Bertin & Arnouts, 1996) to mask out resolved sources and the ACS module of dolphot (Dolphin, 2000) to identify stars and measure their photometry. We also used the same crowded-field selection parameters selected by Radburn-Smith et al. (2011) to remove the bulk of unresolved background galaxies. Finally, we generated approximately 250,000 artificial stars that mimicked the color and magnitude distribution of the observed photometry. These artificial stars were added to the ACS image and subsequently passed individually through the same photometry pipeline and selection criteria. By measuring the recovery rate of these stars, we can assess incompleteness in the real data at fainter magnitudes and measure the effects of stellar crowding in the disk. We found that at magnitudes of F814W mag, more than 50% of these stars are recovered. At this magnitude dolphot, reports the typical uncertainty as 0.07 mag. The resulting color-magnitude diagram (CMD) of the stellar detections is shown in the leftmost panel of Figure 2.
By analyzing synthetic CMDs similar to Figure 2, we can identify and date several distinct regions corresponding to different stages of stellar evolution. Such models depend critically on metallicity, which in outer disks is found to range from to (Gil de Paz et al., 2007; Bresolin et al, 2009). If the warp is formed from infalling material, we may expect a particularly metal-poor composition, hence we generated these CMDs with [M/H] .
Using our model CMDs, we identified the region labeled ‘Old Stars’ in Figure 2 to be principally composed of red-giant-branch (RGB) stars, which at 1–10 Gyr are the oldest stellar population present as well as the most abundant. These stars have a well-defined maximum luminosity, which corresponds with the sharp cutoff known as the tip of the red giant branch (TRGB). Immediately above these TRGB stars is an overdensity of the intermediate aged (1–5 Gyr) AGB stars.
The plume at F606W–F814W1 corresponds to the red helium-burning (HeB) branch. These stars, which are undergoing core helium burning, are around 30–600 Myr old. The leftmost plume at F606W–F814W0 traces the main-sequence stars (MS), which are typically 100 Myr. As shown by the shaded region of the CMD, we have binned these two features together to represent young stars. In the middle and rightmost panel of Figure 2, the spatial density of these old and young stars, shown as Voronoi tessellations, are compared with the reprocessed H i gas map as indicated by the contours. A clear correlation with the gas warp is seen with the young stars but not with the old stars. After correcting for completeness, the mean density of these young stars (F814W) in the warp is stars arcsec-2. This is approximately four times less than the mean density of the old stars (F814W) at stars arcsec-2.
4. The stellar component of the warp
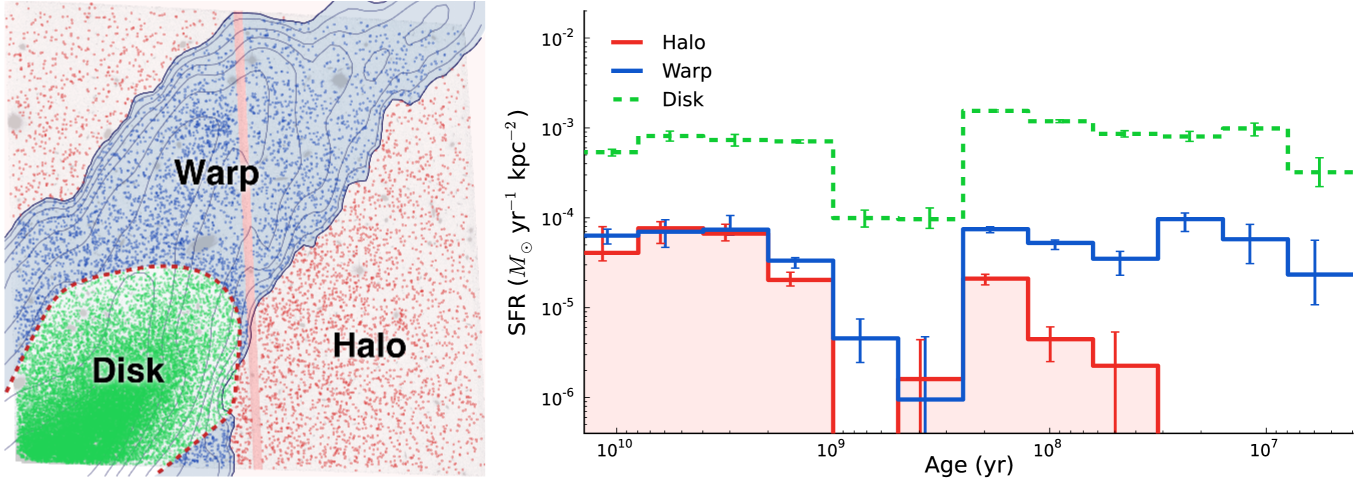
To study the star formation history (SFH) of the warp, we first defined the warp as the region of the ACS image with coincident H i detection ( cm-2). We excluded any detections from the main disk, which we defined as the region in the southeast corner of the ACS field bound by a stellar density of 0.5 stars arcsec-2. The remaining area is attributed to the stellar halo. To measure the SFH of these regions, we used the software package match (Dolphin, 2002), which fits the observed CMD with synthetic stellar populations. These populations were generated using stellar evolution models and a model of completeness and photometric errors, which is computed from the artificial star tests described in Section 3. For this analysis, we used the stellar evolution models of Marigo et al. (2008) with the updated AGB tracks of Girardi et al. (2010) and adopted both a Kroupa (2001) initial mass function (IMF) and a binary fraction of 40%. These synthetic populations were distributed across a 3625 grid in -[] space with bin widths of 0.1 dex. The distance modulus was set to (as measured from the TRGB, Radburn-Smith et al., 2011), the extinction was set to (Schlegel et al., 1998), and the chemical enrichment history was required to increase in metallicity with time. match also allows for up to 0.5 mag of differential reddening for stars younger than 40 Myr, decreasing to 0 mag for stars older than 100 Myr. With this setup, we measured the SFR in fixed logarithmic age bins of width 0.3 dex. To determine the relative uncertainties in SFR between different regions match employs a Markov Chain Monte Carlo approach to sample the probability space around the original data.
The regions, and their respective SFHs, are shown in Figure 3. For ages older than Myr, the SFRs of the halo and warp are remarkably similar. This suggests that the old stars found in the warp are likely contamination from the halo and are not directly associated with the warp. However, a clear difference between the halo and warp populations is seen at younger ages. Specifically, the SFR of the halo rapidly drops off and is undefined at ages Myr while stars in the warp sustain a steady SFR of yr-1 kpc-2 over the last 250 Myr. Following Dolphin (2012), this measurement includes uncertainties in the stellar evolutionary models by incorporating shifts in both luminosity and temperature when computing the Monte Carlo realizations.
Figure 3 also shows a dearth of SF between 1 Gyr and 300 Myr ago. The subsequent rapid increase in SF across all components after this period may indicate a significant event that triggered both the SF and the onset of the warp. However, this feature may also be attributed to a lack of sensitivity at these intermediate timescales. Such stellar ages encompass AGB stars (discussed in Section 5) and faint HeB stars that are at the detection limit of the ACS exposure.
match accounts for interstellar extinction in the fits by allowing for up to 0.5 mag of differential reddening for the very young stars found in dusty stellar nurseries. However, as an extreme case, we may ask how the SFH results would change if interstellar dust affected all populations. To estimate this level of extinction, we used the relation between H i column density and dust extinction as measured locally by Bohlin et al (1978). Given that the average projected surface density of H i in the warp is kpc-2, this relation yields a total extinction of mag. If the stars are embedded in the gas, then half this value may be assumed as the typical stellar extinction. However, we note that such a calculation is likely to overestimate dust extinction in low-metallicity environments such as those expected to be found in the warp (Leroy et al., 2011). To test the impact on the SFH from a reddening of this order of magnitude, we allowed match to fit up to 0.5 mag of differential extinction for all stellar populations. The resulting fits were consistent with the best-fit SFHs presented in Figure 3 given the match reported total uncertainties. We thus conclude that interstellar reddening has little effect on the SFHs.
The projected surface density of H i in the warp is comparable to the typical density of H i outer disks in nearby spiral galaxies (Bigiel et al., 2010b). Using the warp SFR as calculated by match, we infer a depletion time of Gyr. This is also similar to the 100 Gyr depletion times of quiescent outer disks as found by Bigiel et al. (2010b) using far-UV (FUV) emission as a proxy for SFR. This suggests that the same factors setting SF efficiency (defined as the inverse of the depletion time) in galaxy outer disks are also operating in the NGC 4565 H i warp.
4.1. Stellar Populations
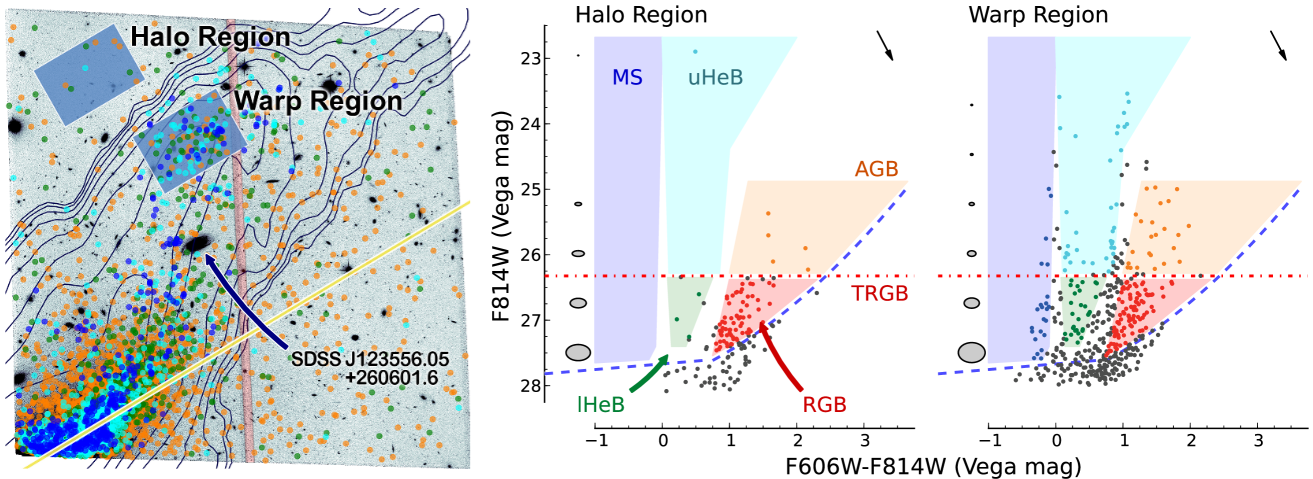
Due to the shallow depth of the observations, the SFHs derived in Figure 3 may lack sensitivity at intermediate ages. Hence, to further examine the stellar content of the H i warp, we investigated the CMD of individual detections. Specifically, we examined detections in a region of the warp with a pronounced overdensity of stars. This includes a massive star cluster lying at (R.A., decl.) (, ′545), which is misidentified in the Sloan Digital Sky Survey (SDSS; York et al., 2000) as a galaxy. By focusing on this overdensity, we minimize contamination from projected halo stars and so maximize the difference between warp and halo populations. This region also avoids the large background galaxy SDSS J123556.05+260601.6, which is resolved in the ACS image. This galaxy can be seen in FUV and near-UV (NUV) imaging from the Galaxy Evolution Explorer (Martin et al., 2005) archive. Although there is some evidence of UV emission from the surrounding warp, the flux in the region is mostly attributed to this galaxy, which thus hampers studies of the UV warp.
We defined a new halo region, which is equal in size (1300 arcsec2) after adjusting for the area removed from the warp region due to the chip gap. For greater age fidelity, we split the CMDs into the distinct stellar populations discussed in Section 3. Based on the stellar isochrones used to construct the SFHs derived earlier, we further split the helium-burning branches into an upper helium-burning branch (uHeB), which corresponds to an age range of 30–200 Myr, and a lower helium-burning branch (lHeB) of 100–600 Myr. Figure 4 plots the new warp and halo regions, and their resulting CMDs.
Clearly evident in the CMD of the overdensity in the warp region is an abundance of younger stars (MS, uHeB and lHeB) that are not present in the halo region. This suggests, as also determined by the SFHs, that SF is ongoing in the warp. However, the density of AGB and RGB stars also appears higher in the warp region. This is likely due to an older, flattened envelope surrounding the main disk, such as a thick disk or inner stellar halo. Such a structure would yield higher densities of old stars closer to the disk axis. To place age constraints on the H i warp, we thus need to assess the correlation of these older stars with the warp.
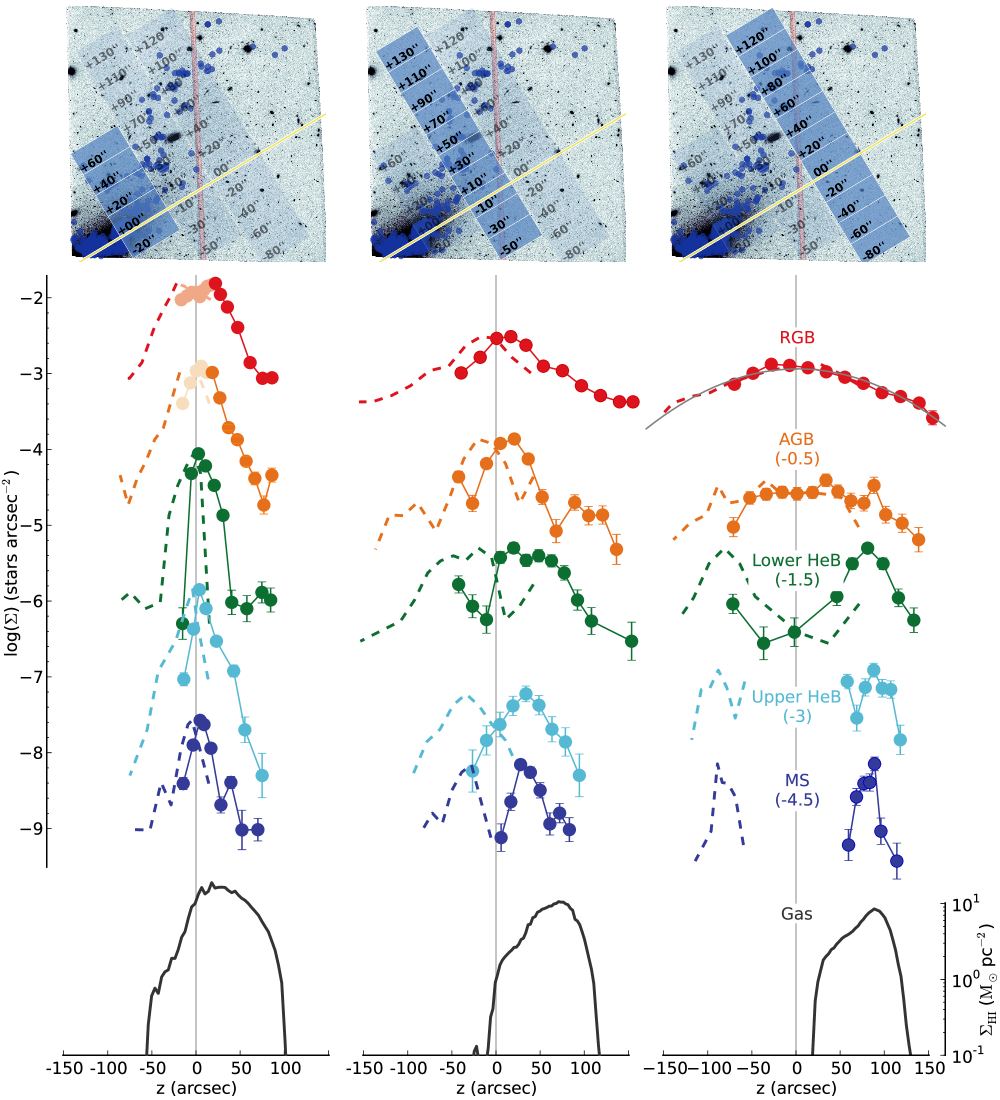
In Figure 5, we define three strips running perpendicular to the disk plane. Along each of these strips, we plot separate stellar density profiles for the RGB, AGB, lHeB, uHeB, and MS detections, as well as the surface density of H i gas. As shown by Radburn-Smith et al. (2011), these stellar densities are equivalent to surface brightnesses. In the crowded region of the disk, detections are lost due to the overlapping point-spread functions of the stars. Although this effect can be partially corrected by artificial star tests, at extreme densities the correction factor can become too large and therefore unreliable. We thus excluded the high density regions within 20″of the disk plane as indicated in the leftmost panels by the lightly shaded points. We also excluded the chip gap from the analysis as the total exposure time in this region is shorter than the rest of the field. This results in a brighter completeness limit, which would affect detections in the fainter CMD selection bins. To illustrate the symmetry of the profiles, dashed lines in the figure correspond to reflections of the profiles around the disk axis.
The leftmost panel of Figure 5 lies largely within the dominant main disk, and so all populations are found to approximately correspond with the gas distribution. We note that this distribution is slightly asymmetrical as the main stellar disk itself gradually warps upward. The middle plot shows the transition from the disk to warp populations, which is described by a gradual increase in the asymmetry of the populations with decreasing age. However, the rightmost panel, which covers the strip in the warp, shows a clear discrepancy between both the RGB and AGB profiles with the younger populations. The RGB stars are symmetrically distributed around the disk axis, as would be expected from a very extended thick-disk-like component or an oblate stellar halo. The AGB population appears to be similarly distributed except for a small overdensity coincident with the peak of the gas distribution. However, the peaks of the asymmetric lHeB, uHeB, and MS populations all strongly coincide with the peak of the H iprofile. This again suggests that the majority of the RGB and AGB stars are not associated directly with the H i structure but rather with an extended outer envelope that is coincident with the warp when seen in projection. Future observations to the south of the field, i.e., from the disk plane, would help measure the symmetry of this older component and so rule out coincidence with the H i warp.
Given the stochastic uncertainties of the profiles in Figure 5, a sufficiently small fraction of the old RGB stars may be associated with the warp without producing any detectable peak. However, as the bulk of detections in the warp are RGB stars (see Figure 4), this small fraction may still be significant. In order to date the warp using stellar ages, we thus need to assess our detection sensitivity to these old stars.
Using the SFH analysis presented in Section 4, we constructed a series of artificial CMDs with increasingly inflated SFRs at ages older than 1 Gyr. The excess RGB stars generated from these higher SFRs were then spatially distributed in the warp following the density of young stars. Finally, the RGB profile from Figure 5 was recomputed and the signal-to-noise of any peak near the warp was measured. Using this assessment, we found that in order to produce a statistically significant peak, the old SFR in the warp needed to be increased by an additional kpc-2 yr-1 relative to the SFR in the halo. This is comparable to the SFR seen in the warp today. Hence, the lack of a peak in the RGB distribution of Figure 5 does not preclude the existence of older SF associated with the warp. However, we note that such SF would likely be seen in Figure 3, as the SFH analysis is sensitive to much lower SFRs in the warp relative to the halo at these stellar ages ( kpc-2 yr-1).
5. AGB Stars
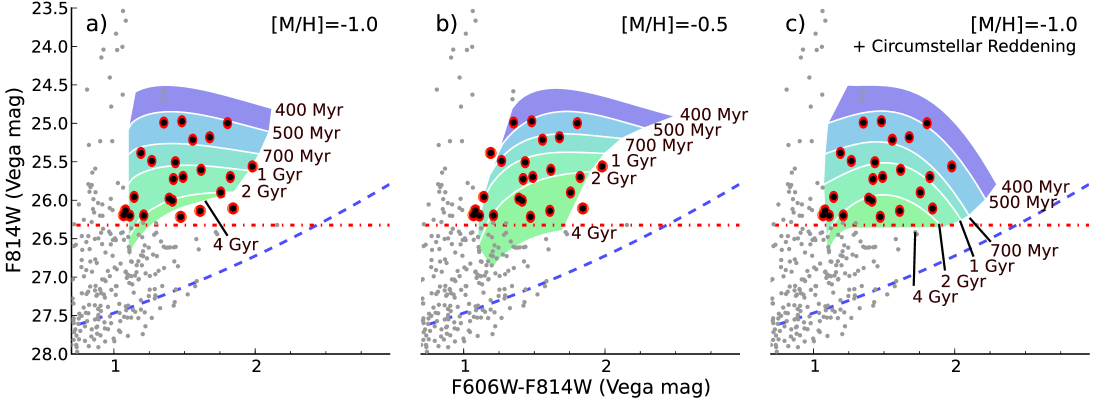
In the outermost profile of Figure 5, a small excess of AGB stars is seen in the region of the warp (″). As previously noted, AGB stars are typically a few Gyr old and so may represent the oldest component of the warp. In Figure 6, we replot the CMD of the warp stars in the stellar overdensity defined in Section 4, which intersects with the third strip of Figure 5. Overplotted in each panel are binned regions of constant age using different assumptions. The underlying isochrones are extracted from the models of Marigo et al. (2008) using mass-loss corrections to the AGB tracks from Girardi et al. (2010). However, we note that as stars evolve upward through the AGB region these bands should be treated as upper-age limits. The bands also average over the effects of thermal pulsations. Typically the effects of these pulsations are smaller than the vertical (F814W) extent of each age bin. For our baseline instance, we use a Chabrier (2001) log-normal IMF, a total extinction of mag with no contribution from circumstellar dust, and a metallicity of ([M/H] = ). As previously noted, this represents the lowest metallicities found in outer disks (Gil de Paz et al., 2007). With this configuration (leftmost panel of Figure 6), the youngest AGB stars correspond to Myr. The ages subsequently increase approximately linearly with F814W magnitude until about 2 Gyr, when the effects of color become more pronounced. AGB stars at the TRGB are typically older than 4 Gyr.
In the middle panel of Figure 6, we dramatically increase the metallicity of the isochrones to ([M/H] = ), as found in the outer disks studied by (Bresolin et al, 2009). This has only a minor effect on the evolutionary tracks for stars younger than 1 Gyr, generally pushing stars toward slightly older ages. However, a much larger effect is seen in the rightmost panel of Figure 6, where we revert to our original metallicity ([M/H] = ) but use isochrones that include circumstellar reddening. To achieve this, Marigo et al. (2008) tracked the C/O ratio in their model stellar atmospheres for stars that experienced significant mass loss. Depending on this ratio, each star was then reddened using the AGB dust absorption models of Groenewegen (2006), either with a mix of 60% aluminum oxide (AlOx) and 40% silicates for oxygen-rich stars, or 85% amorphous carbon (AMC) and 15% silicon carbide (SiC) for carbon-rich stars. With this addition, a strong dependence on color is now seen, with large extinction values in F814W for redder colors.
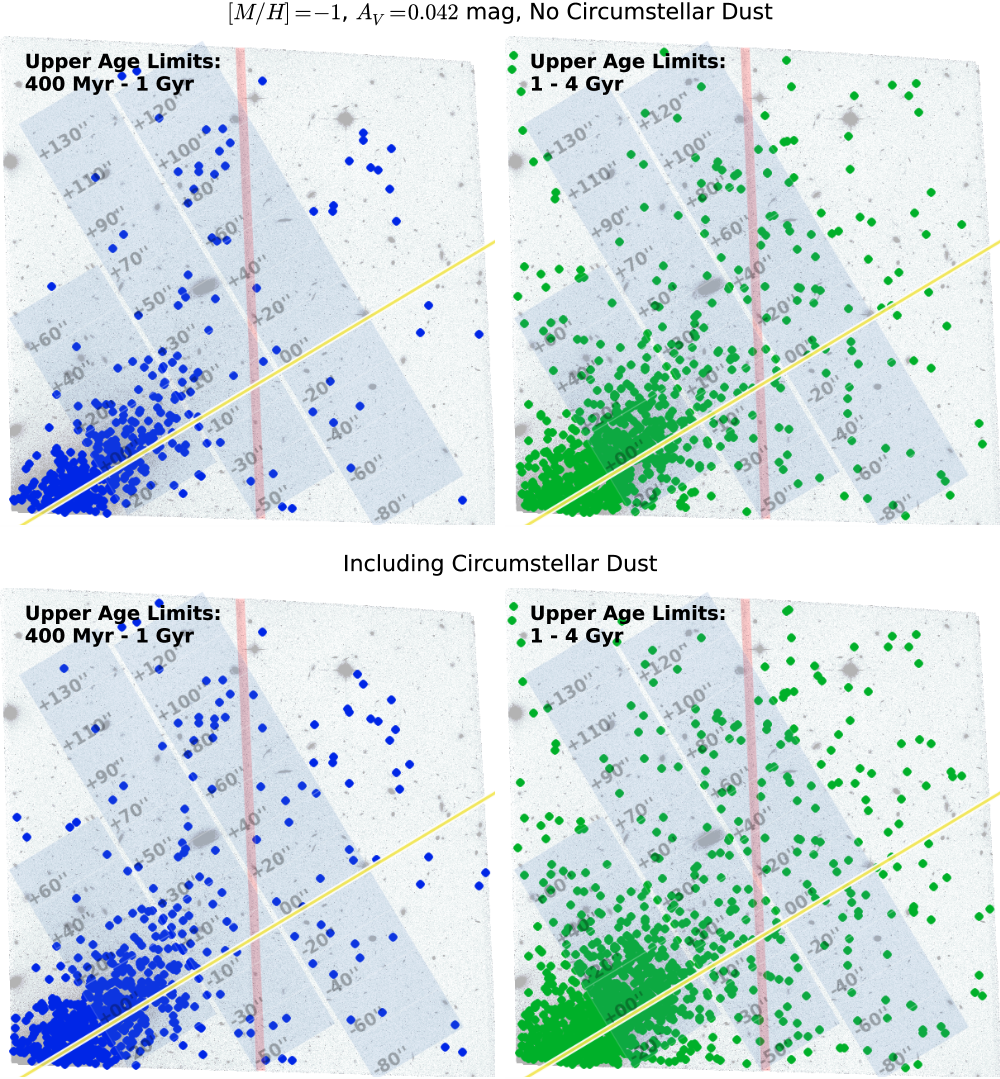
We explored this age dependence on the spatial distribution of AGB stars across the entire ACS field, as shown in Figure 7. In this figure, we only plot stars brighter than the TRGB that fall in the upper-age bands of Figure 6, specifically the 400 Myr to 1 Gyr bands (shown in the left panels) and 1 Gyr to 4 Gyr bands (right panels). Thus not all stars that fall in the classical AGB region are shown. Furthermore, as the bands in each panel of Figure 6 cover different regions of the CMD, selections based on these various models will sample different subsets of the entire AGB population. Using the age definitions from the evolutionary models without circumstellar reddening (upper panels), we found a high spatial correlation between the H i warp and stars Gyr. This correlation is weaker for AGB stars Gyr. Again, we note that as these age definitions are upper limits, young stars ( Gyr) may still contribute to the remaining correlation seen in the vicinity of the gas warp in the upper-right panel. If we repeat this analysis with the models including circumstellar extinction (bottom panels), the correlation is less apparent for all age bins. Given that AGB stars Gyr coincide so well with the H i warp only for the cases without circumstellar reddening, we can reason a priori that these evolutionary models are a better match to these data.
In Section 4, we estimated based on the H i gas density that interstellar reddening from dust may account for up to mag of extinction. Correcting for this would shift the stars by mag in color and mag in F814W magnitude, slightly decreasing the measured ages of the stars. However, we disregarded such shifts in this analysis as they are smaller than the typical systematic uncertainties in the models (e.g., the differences between the left and middle panels of Figure 6).
If these stars do indeed place an upper limit of Gyr on the age of the H i warp structure, we need to assess the validity of using AGB evolutionary models to tag their age. That is, we should assess the likelihood that these stars are AGB stars based solely on their position in the CMD.
5.1. Significance
We studied the dependency of stellar age on position in a CMD by using data from the Optical Gravitational Lensing Experiment (OGLE; Udalski et al., 1997). This survey provides photometry and ages of approximately 600 star clusters in the Large Magellanic Cloud (LMC), spanning ages from Myr up to 1.2 Gyr (Pietrzynski & Udalski, 2000). To assess contamination from field stars in these systems, we also used photometry from the complimentary OGLE maps of dense stellar regions (Udalski et al., 2000). To compare these data with NGC 4565, we transformed the /ACS F606W and F814W photometry to - and -band photometry using the conversions listed in Sirianni et al. (2005) and dereddened all photometry using the extinction values published by Schlegel et al. (1998).
We began by arranging the LMC clusters into nine age bins, spaced logarithmically by 0.3 dex. We then binned the photometry of each cluster into a Hess diagram at a resolution of 0.1 mag in color and 0.2 mag in the -band equivalent. For each of these clusters, Pietrzynski & Udalski (2000) defined a core radius, marked by a major drop in radial stellar density, as well as a total cluster radius, calculated by fitting profiles to the radial stellar density. We subsequently defined a sky region for each system as the annulus that extended outward from the total cluster radius and encompassed an area equal to that of the cluster. Stars from the OGLE stellar maps were then selected in this region by their R.A. and decl., and were similarly binned into a mag Hess diagram. We subtracted this from the original cluster Hess map to define the cluster population.
We degraded the resulting photometry of each cluster using the artificial stars generated for the NGC 4565 ACS field as described in Section 3. For each artificial star that was injected into the ACS image and run through the pipeline, both the input and the recovered colors and magnitudes were recorded. We binned these input magnitudes and colors into the same mag Hess diagram used for the clusters. To generate the degraded photometry, we then randomly drew the same number of artificial stars from each bin as were found in the equivalent bin of the final cluster Hess map. If the selected artificial star was not successfully recovered by the pipeline, then the cluster star was similarly dropped. The measured photometry of the selected artificial stars was then used for the final photometry. These data were combined for all clusters in the same age bin.
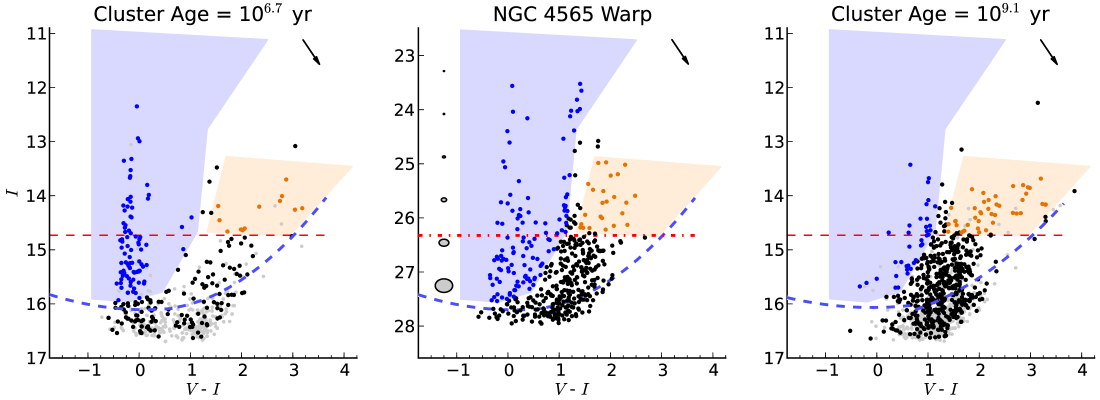
Figure 8 plots examples of these combined CMDs for the youngest (left panel) and oldest (right panel) age bins, together with the CMD of stars in the stellar-overdensity region of the NGC 4565 warp (middle panel). In these CMDs, we shade both the AGB region and a region that encompasses the young stars (MS, lHeB and uHeB). Evident in even the young clusters ( Myr) are stars falling in the AGB region. As discussed earlier, interstellar reddening in the NGC 4565 warp could further shift some of the stars identified as AGB stars in the middle panel out of the shaded AGB region. However, this effect is small ( mag) and will have a minimal effect on the number counts (%).
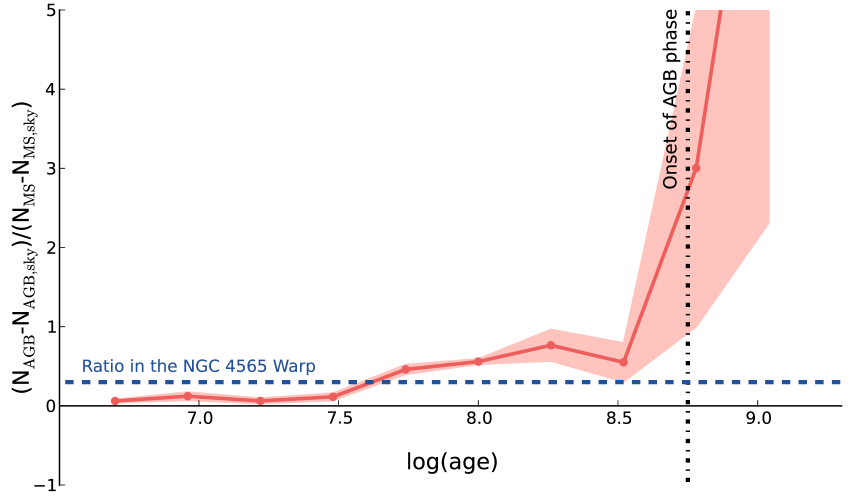
To assess the significance of the stars in the AGB region, we plot in Figure 9 the ratio of these stars to those in the young-star region. To calculate the uncertainty on these values, we run 100 Monte Carlo realizations of these data with random selections from each artificial star bin. The 1 spread of these realizations around the median values is indicated by a shaded region in Figure 9. We note, as expected, a sharp increase in this ratio around the onset of the AGB phase ( Myr). However, even at younger ages the ratio is systematically greater than zero and is consistent with the ratio found in the warp of NGC 4565 (). Note that negative values for the ratio are possible, as clusters where the density of a given population is greater in the sky annulus than in the cluster are carried through as negative detections. Hence, the systematic offset is likely real and indicates that a spatial overdensity of young stars may result in a slight overdensity of stars falling in the AGB region of the CMD that likely are not AGB stars. Thus, the peak in the AGB profile of Figure 5 may not necessarily be attributed to real AGB stars but rather to a small number of younger stars.
6. Implications for Warp
Formation Mechanisms
Early work by Hunter & Toomre (1969) showed that galaxy disks are unable to sustain warps. Hence, the long-lived warps we see today are due to ongoing gravitational effects. Initially, the dark matter halo was believed to be the source of this excitation. By creating a rigid, flattened halo that was misaligned with the disk, many authors were able to create such warps (e.g., Dekel & Shlosman, 1983; Toomre, 1983; Sparke & Casertano, 1988).888Although, as noted by Sparke & Casertano (1988), such models cannot easily explain the turnover of the NGC 4565 warp at larger radii back to the disk plane. However, such halos are unrealistic, and more modern simulations with live halos have shown that the induced warps quickly disappear, primarily due to the shape of the inner halo realigning itself with the disk (Dubinski & Kuijken, 1995; Binney et al., 1998).
Consequently, warps are now suspected to be driven by two broad mechanisms: the tidal interaction of nearby galaxies and the effects of misaligned infall.
6.1. Tidal Interactions
Interactions with satellite galaxies have long been suspected to induce warps (e.g., Huang & Carlberg, 1997) and have been investigated in detail to explain the warp of the Milky Way (MW). However, the masses of the Magellanic Clouds, specifically the LMC, seem insufficient to generate the warp (Hunter & Toomre, 1969). Weinberg (1998) proposed that the response of the halo to the LMC may amplify the torque; this was further modeled and found to be viable by Tsuchiya (2002) and Weinberg & Blitz (2006). However, despite this effect, the orbit of the LMC may be at odds with the location of the existing warp. An analytical and -body simulation by (García-Ruiz et al., 2002a) suggests that the Magellanic Clouds would induce a warp perpendicular to the orientation of the actual warp. Instead, the favorable location of the Sagittarius dwarf galaxy, which has been disrupted in our inner halo, may be the cause of the MW warp (Ibata & Razoumov, 1998; Bailin, 2003; Gómez et al., 2013).
Similar arguments for tidal satellite interactions causing warps have been made for external galaxies such as NGC 5907, which was once thought to be isolated (Shang et al., 1998). Additionally, gravitational encounters with dark-matter substructure within the host halo have also been shown to induce warps (Kazantzidis et al., 2008). Hence, the two nearby companions of NGC 4565, as seen in Figure 1, may in part be responsible for the warp. Indeed, bending of the H i layer toward the closer IC 3571 system has been observed (van der Hulst & Sancisi, 2005). However, this is independent of the larger warp.
If such tidal interactions are warping a pre-existing gas disk, then they will also have an effect on any stars associated with that disk. If such mechanisms formed the prodigious H i warp of NGC 4565, then they need to explain the lack of old stars associated with the warp. The vertical energy of these dynamically hotter stars will likely increase in response to a tidal interaction. However, whether these stars can be sustained in a warped component, as opposed to simply thickening the older stellar disk, remains to be shown by simulations.
SF could also have been triggered by the same process forming the warp. In such a chaotic event, resonances may selectively reinforce the warp perturbation such that both the gas and the newly formed stars spatially coincide, as seen in NGC 4565. If this is the case, these tidal models may need to show that the warp in gas and stars can survive and remain coincident for 1 Gyr, as potentially indicated by the presence of the AGB stars described in Section 5.
6.2. Misaligned Infall
If simulations reveal the satellites of NGC 4565 are unable to induce the warp of the host system, then misaligned infall remains the most likely cause.
In a CDM cosmology, material is regularly accreted from all directions, causing the angular momentum of the host dark-matter halo to continually, and significantly, change over time in a random walk (Vitvitska et al., 2002). Ostriker & Binney (1989) proposed that the continual slewing of the orientation of a flattened outer halo due to this misaligned accretion causes warps in the galaxy disk. Indeed, such warping has been shown in numerical simulations (e.g., Jiang & Binney, 1999; Shen & Sellwood, 2006). More generally, Debattista & Sellwood (1999) showed that when the angular momentum of even a spherical halo and galaxy disk differ, dynamical friction can cause long-lived warps.
As with the tidal interactions, these simulations torque an existing gas disk. Hence, in order to explain the stellar content of the NGC 4565 H i warp, the relative influence of the formation mechanisms on stars older than 1 Gyr needs to be further investigated in these simulations.
Alternately, rather than torquing an existing disk, the warp itself may have formed from the direct accretion of misaligned material. Sancisi et al. (2008) show several examples of gas-rich dwarf galaxies interacting with their host galaxies, e.g., through an H i bridge. If these systems merge, with the higher-angular-momentum material falling into an outer disk, we might expect a gas warp with coincident stars. However, given that approximately 50% of the stellar mass in these dwarf galaxies is in place by (Weisz et al., 2011), older stars would likely lie in the warp as well.
Instead of a dwarf galaxy, Roškar et al. (2010) suggest that the warp forms from infalling gas. In their models, this material cools and sinks through a hot gaseous halo. The spin of this halo, which is not aligned with the disk, torques the infalling material. Hence, the angular momentum of the fresh gas when it finally reaches the disk is aligned with the spin of the gas halo and thus forms a warped disk. These hydrodynamic torques overwhelm the tidal torques from the dark matter halo, which are insufficient for affecting the infalling gas.
Roškar et al. (2010) posit that the cooling gas in the long-lived warp will reach densities sufficient for SF, resulting in young metal-poor stars associated with the warp. Consequently, their Figure 14 shows a remarkable agreement with that of NGC 4565 (Figure 2), namely an old stellar component smoothly distributed around the galaxy and a young stellar component associated with the warp.
Unlike the previous warp formation mechanisms, the Roškar et al. (2010) warp forms from pristine material. Hence, future metallicity measurements of the warp may lend further credence to this model.
7. Conclusions
Using an ACS observation, we have investigated the stellar distribution of stars in the vicinity of the prodigious H i warp of NGC 4565. We find no correlation of old (1 Gyr) stars with the warp. Instead, these older stars lie in a symmetrical distribution around the disk plane, likely due to a thick disk or flattened inner halo. We do, however, find a significant population of young stars (600 Myr) in the warp. An analysis of the SFH shows that the rate of SF in the warp increased, relative to the surrounding regions, at least 300 Myr ago. The sustained SFR over this time is yr-1 kpc-2.
A slight excess of stars falling in the AGB region of the CMD are also found in the warp. Stellar evolutionary models limit the age of these stars to Gyr, therefore placing an upper limit on the age of the current warp. However, analysis of the CMDs of clusters in the LMC suggests that these stars may not be true AGB stars but instead younger stars with anomalous colors. If true, this may lower the age of the warp to the order of hundreds of Myr.
The measured SFR implies a depletion time for the H i gas in the warp of Gyr, similar to the rates found in the H i outer disks of nearby spiral galaxies. However, these outer disks are often dominated by RGB populations (e.g., de Jong et al., 2007; Radburn-Smith et al., 2012). The lack of these stars in the NGC 4565 warp may suggest that the gas has been recently accreted. Indeed, simulations of warp formation from newly accreted gas by Roškar et al. (2010) predict stellar distributions in qualitative agreement with the NGC 4565 H i warp. In this scenario, the warp represents a large reservoir of newly accreted H i gas, which could be a potential fuel source for the galaxy disk it circumscribes (e.g., see discussion in Sancisi et al., 2008; Bigiel et al., 2010a)
These observations help place constraints on numerical and analytical models of warp formation. Future observations of the metallicity of the warp will help clarify the origin of the gas and therefore the mechanisms driving the warp.
References
- Bailin (2003) Bailin, J. 2003, ApJL, 583, L79
- Battaner et al. (1990) Battaner, E., Florido, E., & Sanchez-Saavedra, M. L. 1990, A&A, 236, 1
- Bertin & Arnouts (1996) Bertin, E., & Arnouts, S. 1996, A&ASS, 117, 393
- Bigiel et al. (2010a) Bigiel, F., Leroy, A., Seibert, M., et al. 2010a, ApJL, 720, L31
- Bigiel et al. (2010b) Bigiel, F., Leroy, A., Walter, F., et al. 2010b, AJ, 140, 1194
- Binney (1978) Binney, J. 1978, MNRAS, 183, 779
- Binney (1992) Binney, J. 1992, ARA&A, 30, 51
- Binney et al. (1998) Binney, J., Jiang, I.-G., & Dutta, S. 1998, MNRAS, 297, 1237
- Binney (2000) Binney, J. J. 2000, in ASP Conf. Ser. 197, Dynamics of Galaxies: from the Early Universe to the Present, ed. F. Combes, G. A. Mamon, & V. Charmandaris (San Francisco, CA: ASP), 107
- Bohlin et al (1978) Bohlin, R. C., Savage, B. D., & Drake, J. F. 1978, ApJ, 224, 132
- Bresolin et al (2009) Bresolin, F., Ryan-Weber, E., Kennicutt, R. C., & Goddard, Q. 2009, ApJ, 695, 580
- Briggs (1990) Briggs, F. H. 1990, ApJ, 352, 15
- Brook et al. (2004) Brook, C. B., Kawata, D., Gibson, B. K., & Freeman, K. C. 2004, ApJ, 612, 894
- Brooks et al. (2009) Brooks, A. M., Governato, F., Quinn, T., Brook, C. B., & Wadsley, J. 2009, ApJ, 694, 396
- Chabrier (2001) Chabrier, G. 2001, ApJ, 554, 1274
- Dahlem et al. (2005) Dahlem, M., Ehle, M., Ryder, S. D., Vlajić, M., & Haynes, R. F. 2005, A&A, 432, 475
- Debattista & Sellwood (1999) Debattista, V. P., & Sellwood, J. A. 1999, ApJL, 513, L107
- de Jong (2008) de Jong, R. S. 2008, MNRAS, 388, 1521
- de Jong et al. (2007) de Jong, R. S., Seth, A. C., Radburn-Smith, D. J., et al. 2007, ApJL, 667, L49
- Dekel & Birnboim (2006) Dekel, A., & Birnboim, Y. 2006, MNRAS, 368, 2
- Dekel & Shlosman (1983) Dekel, A., & Shlosman, I. 1983, in IAU Symp. 100, Internal Kinematics and Dynamics of Galaxies, ed. E. Athanassoula (Cambridge: Cambridge Univ. Press), 187
- Dolphin (2000) Dolphin, A. E. 2000, PASP, 112, 1383
- Dolphin (2002) Dolphin, A. E. 2002, MNRAS, 332, 91
- Dolphin (2012) Dolphin, A. E. 2012, ApJ, 751, 60
- Dubinski & Kuijken (1995) Dubinski, J., & Kuijken, K. 1995, ApJ, 442, 492
- Ferguson et al. (1998a) Ferguson, A. M. N., Gallagher, J. S., & Wyse, R. F. G. 1998a, AJ, 116, 673
- Ferguson et al. (1998b) Ferguson, A. M. N., Wyse, R. F. G., Gallagher, J. S., & Hunter, D. A. 1998b, ApJL, 506, L19
- García-Ruiz et al. (2002a) García-Ruiz, I., Kuijken, K., & Dubinski, J. 2002a, MNRAS, 337, 459
- García-Ruiz et al. (2002b) García-Ruiz, I., Sancisi, R., & Kuijken, K. 2002b, A&A, 394, 769
- Gil de Paz et al. (2007) Gil de Paz, A., Madore, B. F., Boissier, S., et al. 2007, ApJ, 661, 115
- Girardi et al. (2010) Girardi, L., Williams, B. F., Gilbert, K. M., et al. 2010, ApJ, 724, 1030
- Gómez et al. (2013) Gómez, F. A., Minchev, I., O’Shea, B. W., et al. 2013, MNRAS, 429, 159
- Groenewegen (2006) Groenewegen, M. A. T. 2006, A&A, 448, 181
- Hanish et al. (2006) Hanish, D. J., Meurer, G. R., Ferguson, H. C., et al. 2006, ApJ, 649, 150
- Heald et al. (2011) Heald, G., Józsa, G., Serra, P., et al. 2011, A&A, 526, A118
- Huang & Carlberg (1997) Huang, S., & Carlberg, R. G. 1997, ApJ, 480, 503
- Hunter & Toomre (1969) Hunter, C., & Toomre, A. 1969, ApJ, 155, 747
- Ibata & Razoumov (1998) Ibata, R. A., & Razoumov, A. O. 1998, A&A, 336, 130
- Jiang & Binney (1999) Jiang, I.-G., & Binney, J. 1999, MNRAS, 303, L7
- Kahn & Woltjer (1959) Kahn, F. D., & Woltjer, L. 1959, ApJ, 130, 705
- Kazantzidis et al. (2008) Kazantzidis, S., Bullock, J. S., Zentner, A. R., Kravtsov, A. V., & Moustakas, L. A. 2008, ApJ, 688, 254
- Kereš et al. (2005) Kereš, D., Katz, N., Weinberg, D. H., & Davé, R. 2005, MNRAS, 363, 2
- Kormendy & Barentine (2010) Kormendy, J., & Barentine, J. C. 2010, ApJL, 715, L176
- Kroupa (2001) Kroupa, P. 2001, MNRAS, 322, 231
- Leroy et al. (2011) Leroy, A. K., Bolatto, A., Gordon, K., et al. 2011, ApJ, 737, 12
- Macciò et al. (2006) Macciò, A. V., Moore, B., & Stadel, J. 2006, ApJL, 636, L25
- Marigo et al. (2008) Marigo, P., Girardi, L., Bressan, A., et al. 2008, A&A, 482, 883
- Martin et al. (2005) Martin, D. C., Fanson, J., Schiminovich, D., et al. 2005, ApJL, 619, L1
- Naeslund & Joersaeter (1997) Naeslund, M., & Joersaeter, S. 1997, A&A, 325, 915
- Nelson et al. (2013) Nelson, D., Vogelsberger, M., Genel, S., et al. 2013, MNRAS, 429, 3353
- Ostriker & Binney (1989) Ostriker, E. C., & Binney, J. J. 1989, MNRAS, 237, 785
- Pietrzynski & Udalski (2000) Pietrzynski, G., & Udalski, A. 2000, AcA, 50, 337
- Radburn-Smith et al. (2011) Radburn-Smith, D. J., de Jong, R. S., Seth, A. C., et al. 2011, ApJS, 195, 18
- Radburn-Smith et al. (2012) Radburn-Smith, D. J., Roškar, R., Debattista, V. P., et al. 2012, ApJ, 753, 138
- Reid et al. (1991) Reid, I. N., Brewer, C., Brucato, R. J., et al. 1991, PASP, 103, 661
- Robertson et al. (2006) Robertson, B., Bullock, J. S., Cox, T. J., et al. 2006, ApJ, 645, 986
- Roškar et al. (2010) Roškar, R., Debattista, V. P., Brooks, A. M., et al. 2010, MNRAS, 408, 783
- Rupen (1991) Rupen, M. P. 1991, AJ, 102, 48
- Sancisi (1976) Sancisi, R. 1976, A&A, 53, 159
- Sancisi (1983) Sancisi, R. 1983, in IAU Symp. 100, Internal Kinematics and Dynamics of Galaxies, ed. E. Athanassoula (Cambridge: Cambridge Univ. Press), 55
- Sancisi et al. (2008) Sancisi, R., Fraternali, F., Oosterloo, T., & van der Hulst, T. 2008, A&AR, 15, 189
- Schlegel et al. (1998) Schlegel, D. J., Finkbeiner, D. P., & Davis, M. 1998, ApJ, 500, 525
- Shang et al. (1998) Shang, Z., Zheng, Z., Brinks, E., et al. 1998, ApJL, 504, L23
- Shen & Sellwood (2006) Shen, J., & Sellwood, J. A. 2006, MNRAS, 370, 2
- Sirianni et al. (2005) Sirianni, M., Jee, M. J., Benítez, N., et al. 2005, PASP, 117, 1049
- Sparke & Casertano (1988) Sparke, L. S., & Casertano, S. 1988, MNRAS, 234, 873
- Spavone et al. (2010) Spavone, M., Iodice, E., Arnaboldi, M., et al. 2010, ApJ, 714, 1081
- Thilker et al. (2007) Thilker, D. A., Bianchi, L., Meurer, G., et al. 2007, ApJS, 173, 538
- Tinsley (1980) Tinsley, B. M. 1980, FCPh, 5, 287
- Toomre (1983) Toomre, A. 1983, in IAU Symp. 100, Internal Kinematics and Dynamics of Galaxies, ed. E. Athanassoula (Cambridge: Cambridge Univ. Press), 177
- Tsuchiya (2002) Tsuchiya, T. 2002, NewA, 7, 293
- Udalski et al. (1997) Udalski, A., Kubiak, M., & Szymanski, M. 1997, AcA, 47, 319
- Udalski et al. (2000) Udalski, A., Szymanski, M., Kubiak, M., et al. 2000, Acta Astron, 50, 307
- van der Hulst & Sancisi (2005) van der Hulst, J. M., & Sancisi, R. 2005, in ASP Conf. Ser. 331, Extra-Planar Gas, ed. R. Braun (San Francisco, CA: ASP), 139
- van der Kruit (1979) van der Kruit, P. C. 1979, A&AS, 38, 15
- van der Kruit (2007) van der Kruit, P. C. 2007, A&A, 466, 883
- van der Kruit & Freeman (2011) van der Kruit, P. C., & Freeman, K. C. 2011, ARA&A, 49, 301
- van der Kruit & Searle (1981) van der Kruit, P. C., & Searle, L. 1981, A&A, 95, 105
- Vitvitska et al. (2002) Vitvitska, M., Klypin, A. A., Kravtsov, A. V., et al. 2002, ApJ, 581, 799
- Walter et al. (2008) Walter, F., Brinks, E., de Blok, W. J. G., et al. 2008, AJ, 136, 2563
- Weinberg (1998) Weinberg, M. D. 1998, MNRAS, 299, 499
- Weinberg & Blitz (2006) Weinberg, M. D., & Blitz, L. 2006, ApJL, 641, L33
- Weisz et al. (2011) Weisz, D. R., Dalcanton, J. J., Williams, B. F., et al. 2011, ApJ, 739, 5
- Wu et al. (2002) Wu, H., Burstein, D., Deng, Z., et al. 2002, AJ, 123, 1364
- York et al. (2000) York, D. G., Adelman, J., Anderson, J. E., Jr., et al. 2000, AJ, 120, 1579
- Zschaechner et al. (2012) Zschaechner, L. K., Rand, R. J., Heald, G. H., Gentile, G., & Józsa, G. 2012, ApJ, 760, 37