Using a model for telluric absorption in full-spectrum fits–References
Using a model for telluric absorption in full-spectrum fits
Abstract
The typical approach for removing telluric absorption lines from a science spectrum is to divide it by the spectrum of a standard star of spectral type A or B observed close in time and airmass. We present a new method, where we use a model for the transmission of the Earth’s atmosphere in a full-spectrum fit, which determines the parameters for the stellar and Earth’s atmosphere simultaneously. This eliminates the need of a standard star completely.
keywords:
spectral library – tellurics – full-spectrum fit1 Introduction
The absorption lines caused by molecules in the Earth’s atmosphere are a problem every astronomer faces when doing ground-based spectroscopy. While these so-called telluric lines can be found at known positions, their strengths depends on the current weather conditions at the site of the observatory.
Since the telluric lines often cover parts of the spectra that are of interest, one usually tries to remove them. Most commonly this is done by observing early-type stars (spectral types mid-B or late-A) that show only few and weak metal lines. In order to remove the telluric lines from a science spectrum it is then divided by the spectrum of this standard star. Unfortunately, there are several problems with this method: (a) a suitable telluric standard star is required that has been observed both close in time to the science observation and at a similar airmass, which (b) also requires more telescope time. Furthermore, (c) A/B type stars show strong hydrogen absorption features that need to be taken into account when removing the tellurics. The latter item can be addressed by interpolating linearly over the hydrogen lines, but this only works well if one is not particularly interested in these regions of the spectrum. In order to avoid this, several attempts have been made to use high-resolution spectra of the Sun and Vega in combination with standard stars of spectral types F/G (Maiolino et al., 1996) and A0 V (Vacca et al., 2003) respectively.
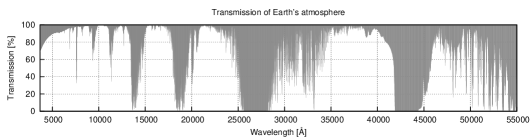
The need of a standard star can be avoided completely when using theoretical models for the atmospheric transmission, which for this work have been computed using LBLRTM111http://rtweb.aer.com/lblrtm_frame.html (Line-By-Line Radiative Transfer Model), which in turn is based on FASCODE (Clough et al., 2005, 1992). Since this has been used before for removing telluric lines by Seifahrt et al. (2010) and Rudolf et al. (subm.), we refer to their publications for further details. A synthetic transmission spectrum created by this method is shown in Fig. 1.
2 Fitting
While Seifahrt et al. (2010) and Rudolf et al. (subm.) fit the tellurics either with a fixed stellar spectrum or only in those regions of the spectrum that are free of intrinsic stellar absorption features, we combined it with our methods for full-spectrum fitting, which works similarly to, e.g., the ULySS package (Koleva et al., 2009).
The fundamental problem in a full-spectrum fit is finding a model spectrum that best describes an observation in pixel space. We describe the model as the weighted sum of single model spectra with coefficients , convolved with corresponding kernels :
| (1) |
where denotes the convolution in the logarithmic domain, which allows us to handle both line shifts (i.e. radial velocities) and broadenings in one step.
To allow for a telluric model to be included in the fit, we created small model grids with varying abundances for some of the most prominent molecules in the Earth’s atmosphere (, , , , , and ). Since LBLRTM always includes water in the atmospheres, we had to calculate the water-free models by dividing with the pure model, which of course produces some inaccuracies in water dominated regions of the spectra, but seems to be negligible. An interpolator then allows us to create absorption spectra for each molecule with arbitrary abundances. The final telluric spectrum is just the product of all those spectra, convolved with a given kernel for degrading them to the instrumental profile and applying a line shift:
| (2) |
The additional term adds more free parameters to the fit, i.e. one for each of the molecules plus line shift and broadening . Depending on the wavelength range, can be as small as one, e.g. when the spectrum is limited to the optical domain ( only). Using a fast interpolation scheme for the tellurics, the computation time increases only slightly compared to a fit without tellurics.
3 Examples & Conclusion
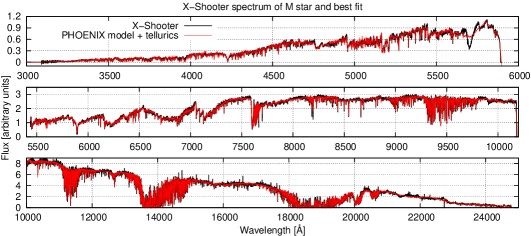
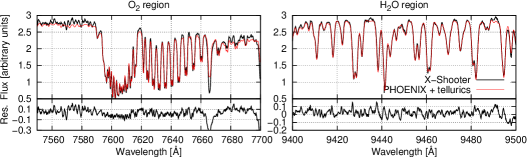
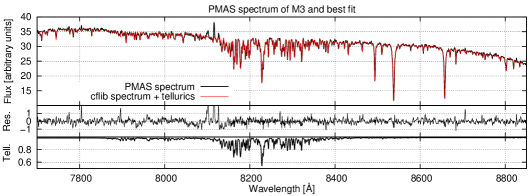
In Fig. 2, a full X-Shooter spectrum of an M star is shown together with the best fit of a PHOENIX spectrum (Göttingen Spectral Library by PHOENIX222http://phoenix.astro.physik.uni-goettingen.de/, see Husser et al., 2013) and a telluric model. Clearly, both match very well, especially in the regions dominated by telluric absorption features as shown in the detail plots in the lower two panels. Another example is shown in Fig. 3, where a PMAS spectrum of a star in M3 is shown together with a matching spectrum from cflib (Valdes et al., 2004) combined with a telluric model. Again, we achieved a very good agreement.
In this paper, we introduced a very simple method for integrating a synthetic model for the transmission of the Earth’s atmosphere into a full-spectrum fit. We showed that it performs well and allows us to eliminate the need of observing a telluric standard star completely.
References
- Clough et al. (2005) Clough, S. A., Shephard, M. W., Mlawer, E. J., et al. 2005, J. Quant. Spec. Radiat. Transf., 91, 233
- Clough et al. (1992) Clough, S. A., Iacono, M. J., & Moncet, J.-L. 1992, J. Geophys. Res., 97, 15761
- Husser et al. (2013) Husser, T.-O., Wende-von Berg, S., Dreizler, S., et al. 2013, A&A, 553, A6
- Koleva et al. (2009) Koleva, M., Prugniel, P., Bouchard, A., & Wu, Y. 2009, A&A, 501, 1269
- Maiolino et al. (1996) Maiolino, R., Rieke, G. H., & Rieke, M. J. 1996, AJ, 111, 537
- Rudolf et al. (subm.) Rudolf, N., Günther, H. M., Schneider, P. C., Schmitt, J. H. M. M., 2013, A&A, submitted
- Seifahrt et al. (2010) Seifahrt, A., Käufl, H. U., Zängl, G., et al. 2010, A&A, 524, A11
- Vacca et al. (2003) Vacca, W. D., Cushing, M. C., & Rayner, J. T. 2003, PASP, 115, 389
- Valdes et al. (2004) Valdes, F., Gupta, R., Rose, J. A., Singh, H. P., & Bell, D. J. 2004, ApJS, 152, 251