Stellar Spectral Signatures in High-Redshift Galaxies–LABEL:lastpage
Stellar Spectral Signatures in High-Redshift Galaxies
Abstract
Stellar emission and absorption lines are routinely observed in galaxies at redshifts up to 5 with spectrographs on 8 – 10-m class telescopes. While the overall spectra are well understood and have been successfully modeled using empirical and theoretical libraries, some challenges remain. Three issues are discussed: determining abundances using stellar and interstellar spectral lines, understanding the origin of the strong, stellar He II 1640 line, and gauging the influence of stellar Ly- on the combined stellar+nebular profile. All three issues can be tackled with recently created theoretical stellar libraries for hot stars which take into account the radiation-hydrodynamics of stellar winds.
keywords:
stars: early-type – stars: Wolf-Rayet – galaxies: high-redshift – galaxies: stellar content – ultraviolet: galaxies1 Introduction
High-quality rest-frame ultraviolet (UV) spectra of large numbers of galaxies at redshifts up to 5 are routinely obtained with current 8 – 10-m class telescopes (e.g., Jones et al. 2012). Gravitational lensing and the associated magnification factors allow pushing the detection limit and achievable signal-to-noise to the extreme limit (see Bayliss et al. 2013 and Stark et al. 2013 for detailed studies and surveys of lensed galaxies, respectively). The age of the universe at is about 1.6 Gyr; therefore the observed galaxies are young and currently star-forming. This makes the rest-frame UV where the bulk of the luminosity is emitted the wavelength region of choice. In the context of this conference, which focuses on stellar spectral libraries, I will address several issues related to the stellar aspects of the observed rest-frame UV spectra: (i) the potential of stellar lines to determine abundances as an alternative to emission-line techniques; (ii) evidence of variations of the initial mass function (IMF) with ; (iii) the properties of stellar Ly- as determined by wind effects.
2 Abundance determinations from UV spectra
Traditional abundance determinations in star-forming galaxies rely on emission-line techniques. At high , the observed wavelengths of many of the most widely used rest-frame optical nebular lines are shifted into the near-infrared (IR). Despite advances in sensitivity, obtaining high signal-to-noise spectra in the near- or mid-IR is still more challenging than in the optical. Moreover, atmospheric transparency is small between the J, H, K, and L windows so that often not all the required lines can be measured simultaneously. The UV spectra provide an alternative means of determining abundances.
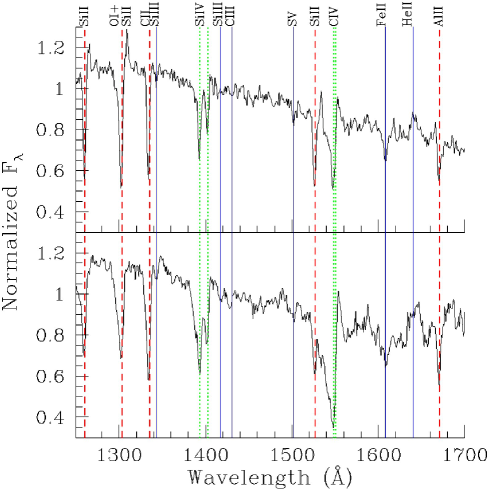
In Fig. 1 a comparison of the UV spectral region of high- and low- galaxies is shown. Note the close correspondence of the two spectra, suggesting that locally calibrated spectral libraries should do a good job in interpreting distant galaxies as well. Three classes of lines can be identified in this figure: (i) broad, shallow photospheric blends such as C III 1425, (ii) broad P Cygni-type stellar wind lines such as C IV 1550, and (iii) narrow interstellar absorptions such as C II 1335.
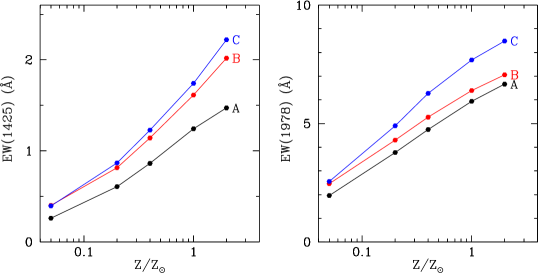
Rix et al. (2004) created a theoretical stellar library of OB stars for the Starburst99 code (Leitherer et al. 1999; Leitherer & Chen 2009) and predicted the strengths of several photospheric blends as a function of chemical composition. An example is in Fig. 2, which shows the results for the (mostly) C III and Fe III blends. The features are only mildly sensitive to IMF variations since both lines and continuum arise from the same stellar mass range. Using metallicity sensitive photospheric lines for abundance determinations is analogous to classical methods that are widely used for early-type galaxies. The Rix et al. models were expanded by Leitherer et al. (2010) who included the strong stellar-wind lines in the spectral library. Despite being optically thick, these lines are metallicity indicators since they depend on the mass-loss rates, which in turn depend on the metal abundance because the winds are driven by metal lines. Note that these lines are quite sensitive to the IMF as well. James et al. (2013) performed a comparison of the various metallicity indicators with the gravitationally lensed galaxy CASSOWARY20 at . The continuous spectral coverage from 1300 to 9000 Å (rest-frame) provided by the VLT X-shooter spectrograph permitted a comparison of both the UV and optical (nebular) techniques. Good agreement was found.
Heckman et al. (1998) and Leitherer et al. (2011) suggested yet another empirical metallicity indicator: interstellar absorption lines. The strengths of these lines (e.g., C II 1335 correlate with chemical composition despite being heavily saturated. The likely interpretation is a correlation between metallicity and starburst strength and eventually increased macroscopic interstellar turbulence due to energy input by winds and supernovae. Ultimately, abundances derived from UV spectra of high- galaxies should provide invaluable constraints on the cosmic chemical evolution of galaxies, which is a major quest in contemporary observational cosmology (Yuan et al. 2013).
3 The origin of the He II 1640 line
The behavior of the major stellar lines in the spectra of high- galaxies is well understood and can be reproduced with current spectral libraries. A notable exception is the He II 1640 line, which is weak in local star-forming galaxies but can become the strongest stellar feature in UV rest-frame spectra at high (Shapley et al. 2003; Erb et al. 2010). The line has a width of order 1000 km s-1, which excludes in interstellar origin. Stars capable of producing observable He II must meet one or more of the following: He overabundance, high surface temperature, and/or dense stellar winds. These conditions are most naturally met in Wolf-Rayet stars, which are related to very massive, evolved O stars (Crowther 2007). The stronger He II at high could indicate a larger fraction of very massive stars compared to the local universe, and therefore a flatter IMF. A flattening of the IMF with is not unexpected: for instance, cosmological simulations by Davé (2008) can account for the observed trend of the star-formation rate versus mass relation with by invoking an excess of massive stars at high redshift.
The currently implemented UV spectral library in Starburst99 (Leitherer et al. 2010) does not include high-resolution spectra of Wolf-Rayet stars. In order to investigate the nature of the bona fide Wolf-Rayet features observed at high , we expanded our library by including Wolf-Rayet spectra. We constructed a library of Wolf-Rayet spectra from the grid of Potsdam Wolf-Rayet models111http://www.astro.physik.uni-potsdam.de/~wrh/PoWR/powrgrid1.html. The spectra are calculated from model atmospheres which account for non-LTE, spherical expansion and metal-line blanketing (Gräfener et al. 2002; Hamann & Gräfener 2003; 2004). We selected 12 models each for the nitrogen and the carbon sequence, covering temperatures between 30,000 K and 160,000 K. Details will be published in a forthcoming paper (Leitherer et al., in preparation).
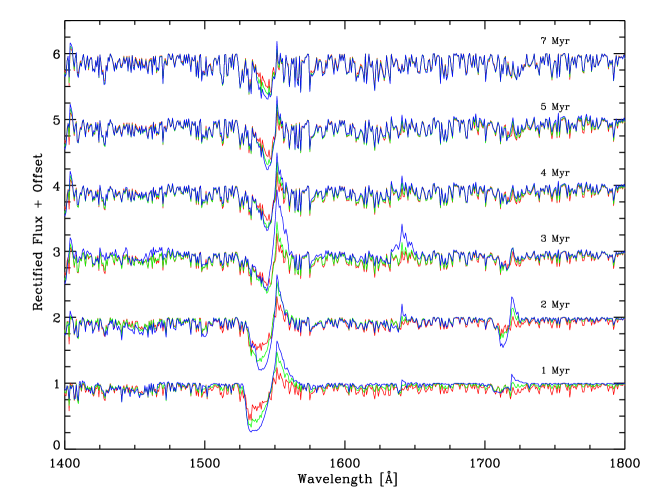
In Fig. 3 the spectra of an evolving single stellar population are shown at ages between 1 and 7 Myr. Around 3 Myr, strong He II 1640 appears. This line is produced by the Wolf-Rayet stars in the new spectral library. As expected, the line is very sensitive to IMF variations and can be used to probe an excess or deficit of very massive stars. As a cautionary note, the line strength is critically dependent on the Wolf-Rayet star parameters, which are predicted by stellar evolution models. The evolution models are quite uncertain in this respect and may in fact disagree with observations (Brinchmann et al. 2008; Eldridge & Stanway 2009).
4 Ly- in OB stars
Peña-Guerrero & Leitherer (2013) used CMFGEN (Hillier & Miller 1998) and TLUSTY (Lanz & Hubeny 2003; 2007) blanketed non-LTE atmospheres for compiling a grid of stellar Ly- equivalent widths in OB stars. The stellar Ly- line in star-forming galaxies is not of primary interest per se but it is for its diluting effect on the total nebular+stellar profile. Nebular Ly- emission is a prime star-formation tracer at high (Dijkstra & Wyithe 2012), yet the correlation between star-formation rate and Ly- luminosity is much more complex than expected purely for a recombination line. While dust plays a major role, the effect of underlying stellar absorption on the net profile is under debate (Charlot & Fall 1993; Valls-Gabaud 1993; Schaerer & Verhamme 2008).
Intrinsic Ly- is not observable even in the closest O stars due to dominating interstellar H I absorption. Consequently we must rely on model atmospheres. The success of the models in predicting other, observable lines gives confidence in the theoretical approach. Typical equivalent width values are close to zero for the hottest and most luminous stars, whose stellar winds produce P Cygni profiles with comparable emission and absorption components. B stars have Ly- in absorption with equivalent values of tens of Å.
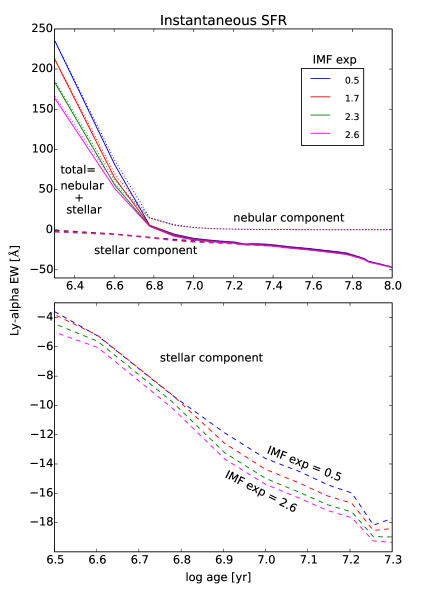
In Fig. 4, the equivalent values of Ly- for a single stellar population predicted by Starburst99 are plotted. Two distinct regimes can be identified: for ages younger than 10 Myr, nebular Ly- is large and stellar Ly- is small, and the stellar line in negligible. Conversely, after 10 Myr, the supply of ionizing photons quickly decreases so that the strong B-star Ly- absorption takes over. Incidentally, for typical starburst ages of 10 Myr, the stellar and nebular contributions are comparable.
5 The future
Most UV libraries of hot stars currently in existence are theoretical. While model atmospheres for hot stars are more trustworthy than their cool counterparts, observational comparisons are nevertheless crucial. Such tests have successfully been done out to the Magellanic Clouds (Massey et al. 2013). However, limiting the comparison to stars in the Magellanic Clouds imposes severe restrictions. Arguably the most crucial unknown is the influence of chemical composition, and truly metal-poor massive stars, whose lifetimes are only a few tens of Myr, do not exist in our Local Group of galaxies.
In order to enter a new parameter regime, stars in galaxies with oxygen abundances of a few percent the solar value must be studied. Such galaxies exist at a distance around 10 to 20 Mpc, the most famous being I Zw 18 at 18 Mpc. I Zw 18 is more distant than 30 Doradus, and 1 arcsec corresponds to 88.5 pc. A 20-m class telescope will have a spatial resolution of 0.1 pc at 1500 Å. A typical O star in I Zw 18 has a flux level of erg s-1 cm-2 Å-1 at 1500 Å, which is higher than the sky background. In terms of photometry, a B0 V star has , and a G2 V star has . Such observations are outside the capabilities of existing facilities but within the reach of the Advanced Technology Large Aperture Space Telescope (ATLAST). ATLAST is a NASA strategic mission concept study for the next generation of UVOIR space observatory222http://www.stsci.edu/institute/atlast. With a primary mirror diameter of close to 20 m it has a sensitivity limit that is up to better than that of the Hubble Space Telescope. ATLAST would be able to obtain truly transformative observations of hot, massive extragalactic stars.
Acknowledgements
Wolf-Rainer Hamann and Helge Todt (Potsdam) provided invaluable help with the download and generation of the Wolf-Rayet library.
References
- (1) Bayliss, M. B., et al. 2013, ApJ, in press (arXiv:1310.6695)
- (2) Brinchmann, J., Kunth, D., & Durret, F. 2008, A&A, 485, 657
- (3) Charlot, S., & Fall, M. 1993, ApJ, 415, 580
- (4) Crowther, P. A. 2007, ARAA, 45, 177
- (5) Davé, R. 2008, MNRAS, 385, 147
- (6) Dijkstra, M., & Wyithe, S. B. 2012, MNRAS, 419, 3181
- (7) Eldridge, J. J., & Stanway, E. R. 2009, MNRAS, 400, 1019
- (8) Erb, D. K., Pettini, M., Shapley, A. E., et al. 2010, ApJ, 719, 1168
- (9) Gräfener, G., Koesterke, L., & Hamann, W.-R. 2002, A&A, 387, 244
- (10) Hamann, W.-R., & Gräfener, G. 2003, A&A, 410, 993
- (11) Hamann, W.-R., & Gräfener, G. 2004, A&A, 427, 697
- (12) Hillier, D. J., & Miller, D. L. 1998, ApJ, 496, 407
- (13) James, B. L., et al. 2013, MNRAS, submitted
- (14) Jones, T., Stark, T. P., & Ellis, R. S. 2012, ApJ, 751, 51
- (15) Lanz, T., & Hubeny, I. 2003, ApJS, 147, 225
- (16) Lanz, T., & Hubeny, I. 2007, ApJS, 169, 83
- (17) Leitherer, C., & Chen, J. 2009, New Astron., 14, 356
- (18) Leitherer, C., Ortiz, Otálvaro, P. A., Bresolin, F., et al. 2010, ApJS, 189, 309
- (19) Leitherer, C., Schaerer, D., Goldader, J. D., et al. 1999, ApJS, 123, 3
- (20) Leitherer, C., Tremonti, C. A., Heckman, T. M., & Calzetti, D. 2011, AJ, 141, 37
- (21) Massey, P., Neugent, K. F., Hillier, D. J., & Puls, J. 2013, ApJ, 768, 44
- (22) Peña Guerrero, M. A., & Leitherer, C. 2013, AJ, in press (arXiv:1310.1155)
- (23) Rix, S. A., Pettini, M., Leitherer, C., Bresolin, F., Kudritzki, R. P., & Steidel, C. C. 2004, ApJ, 615, 98
- (24) Schaerer, D., & Verhamme, A. 2008, A&A, 480, 369
- (25) Schwartz, C. M., Martin, C. L., Chandar, R., et al. 2006, ApJ, 646, 858
- (26) Shapley, A. E., Steidel, C. C., Pettini, M., & Adelberger, K. L. 2003, ApJ, 588, 65
- (27) Stark, T. P., et al. 2013, MNRAS, in press (arXiv:1302.2663)
- (28) Valls-Gabaud, D. 1993, ApJ, 419, 7
- (29) Yuan, T.-T., Kewley, L. J., & Richard, J. 2013, ApJ, 763, 9