A substantial population of massive quiescent galaxies at from ZFOURGE1212affiliation: This paper contains data gathered with the 6.5 meter Magellan Telescopes located at Las Campanas observatory, Chile.
Abstract
We report the likely identification of a substantial population of massive galaxies at with suppressed star formation rates (SFRs), selected on rest-frame optical to near-IR colors from the FourStar Galaxy Evolution Survey. The observed spectral energy distributions show pronounced breaks, sampled by a set of near-IR medium-bandwidth filters, resulting in tightly constrained photometric redshifts. Fitting stellar population models suggests large Balmer/ breaks, relatively old stellar populations, large stellar masses and low SFRs, with a median specific SFR of /yr. Ultradeep Herschel/PACS , and Spitzer/MIPS data reveal no dust-obscured SFR activity for 15/19(79%) galaxies. Two far-IR detected galaxies are obscured QSOs. Stacking the far-IR undetected galaxies yields no detection, consistent with the SED fit, indicating independently that the average specific SFR is at least smaller than of typical star-forming galaxies at . Assuming all far-IR undetected galaxies are indeed quiescent, the volume density is to a limit of , which is and lower than at and . They comprise a remarkably high fraction(%) of massive galaxies, suggesting that suppression of star formation was efficient even at very high redshift. Given the average stellar age of Gyr and stellar mass of , the galaxies likely started forming stars before , with SFRs well in excess of /yr, far exceeding that of similarly abundant UV-bright galaxies at . This suggests that most of the star formation in the progenitors of quiescent galaxies was obscured by dust.
Subject headings:
galaxies: evolution — galaxies: formation — galaxies: high-redshift — infrared: galaxies — cosmology: observations1. Introduction
The identification of a population of compact quiescent galaxies at , characterized by suppressed star formation and very small sizes, has attracted a significant interest (e.g. Daddi et al. 2005; van Dokkum et al. 2008). It remains an open question when these galaxies first appeared. The declining number densities and fractions of quiescent galaxies with redshift at suggest they might be rare at (e.g. Muzzin et al. 2013). Nevertheless, the high ages of some quiescent galaxies at (Whitaker et al. 2013) suggest they could have already existed at much earlier times. If confirmed at , massive galaxies must have formed rapidly, early and with an effective mechanism of suppressing star formation.
Beyond candidate early-type or post-starburst galaxies have been reported, despite uncertainties whether their red colors could be due to dust-reddening (e.g. Chen & Marzke 2004; Wiklind et al. 2008; Mancini et al. 2009; Fontana et al. 2009; Guo et al. 2013; Stefanon et al. 2013; Muzzin et al. 2013). In this Letter, we use the FourStar Galaxy Evolution Survey111http://zfourge.tamu.edu (ZFOURGE; Labbé et al. in preparation) to look for the earliest examples of quiescent galaxies. The strength of ZFOURGE lies in the unique combination of depth and the medium-bandwidth filters (covering ) of the FourStar Infrared Camera (Persson et al. 2013) on the 6.5m Magellan Baade Telescope. These enable the derivation of accurate photometric redshifts and the detection of the age-sensitive Balmer/ break in faint, red galaxies at .
Throughout, we assume a cosmology with and . The photometric system is AB.
2. Data
ZFOURGE covers three pointings in the fields CDFS, COSMOS and UDS, to very deep limits ( AB total mag () in and mag in and ). We combine ZFOURGE with public data, including HUGS (PI:Fontana) HAWK-I and CANDELS (Grogin et al. 2011; Koekemoer et al. 2011) HST/WFC3 imaging, over a wavelength range of 0.3-8 m. Full photometric band selected catalogs will be presented in Straatman et al. (in preparation).
We use Spitzer/MIPS data from GOODS-South (PI: Dickinson), COSMOS (PI: Scoville) an d SPUDS (PI: Dunlop) and ultradeep Herschel/PACS and imaging from the GOODS-Herschel (Elbaz et al. 2011) and the CANDELS-Herschel program (PI:Dickinson), to independently place constraints on the on-going SFR. The ultradeep PACS imaging currently provides the best sensitivity for far-IR light from star formation at high redshift, trading off k-correction and source confusion due to increasing beam size (Elbaz et al. 2011), while data are more sensitive to the presence of hot dust associated with AGN.
Photometric redshifts and rest-frame colors were derived with EAZY (Brammer et al. 2008). Comparing ZFOURGE photometric redshifts to spectroscopic redshifts, Tomczak et al. (2013) found a scatter of . Stellar population properties were derived by fitting Bruzual & Charlot (2003) models with FAST (Kriek et al. 2009), assuming a Chabrier (2003) initial mass function, exponentially declining star formation histories with timescale , and solar metallicity.
90 ra dec M b age Ks_totc d d d ID (deg) (deg) U-V V-J (Gyr) (Gyr) A(V) (AB) ZF-CDFS-209 53.1132774 27.8698730 3.560.05 1.430.02 0.600.01 0.76 2.239 2.884 0.10 0.63 0.3 22.6 0.0010.004 0.1630.163 0.0470.123 ZF-CDFS-403 53.0784111 27.8598385 3.660a 1.420.05 0.800.00 1.15 31.623 27.542 0.25 0.79 0.8 22.4 0.1000.005* 1.2720.199* 1.6860.201* ZF-CDFS-617 53.1243553 27.8516121 3.700a 1.350.06 0.540.01 0.69 13.183 18.621 0.16 0.63 0.3 22.3 0.0870.003* 1.0620.152* 0.3620.157 ZF-CDFS-4719 53.1969414 27.7604313 3.590.14 1.540.07 0.770.02 0.45 0.851 1.905 0.16 1.00 0.3 23.4 0.0000.004 0.3390.175 0.2870.146 ZF-CDFS-4907 53.1812820 27.7564163 3.460.16 1.570.16 0.830.02 0.40 0.000 0.000 0.01 0.40 0.8 23.6 0.0010.004 0.3020.132 0.1540.107 ZF-CDFS-5657 53.0106506 27.7416019 3.560.07 1.610.07 0.830.01 0.76 3.311 4.467 0.25 1.26 0.3 23.0 0.0010.005 0.1930.259 0.0780.214 ZF-COSMOS-13129 150.1125641 2.3765368 3.810.17 1.960.05 1.410.11 1.78 0.000 0.000 0.01 1.58 0.6 23.6 0.1120.010* 0.8950.356 0.2150.343 ZF-COSMOS-13172 150.0615082 2.3786869 3.550.06 1.900.10 0.780.01 1.45 0.000 0.000 0.04 0.79 0.6 22.4 0.0040.007 0.0070.394 0.3230.420 ZF-COSMOS-13414 150.0667114 2.3823516 3.570.19 1.610.11 0.710.06 0.44 0.035 0.079 0.10 1.00 0.2 23.4 0.0090.008 0.3300.546 0.1940.452 ZF-UDS-885 34.3685074 5.2994704 3.990.41 1.800.29 1.070.03 0.60 0.001 0.001 0.03 0.40 1.3 24.0 0.0120.008 1.0090.537 0.0890.400 ZF-UDS-1236 34.3448868 5.2925615 3.580.08 1.470.05 0.510.02 0.60 0.550 0.912 0.06 0.50 0.4 22.6 0.0160.011 0.3830.449 0.5370.360 ZF-UDS-2622 34.2894516 5.2698011 3.770.10 1.510.07 0.790.02 0.87 16.218 18.621 0.16 0.63 0.9 23.0 0.0130.010 0.7610.372 0.1520.442 ZF-UDS-3112 34.2904282 5.2620673 3.530.06 1.710.06 0.720.02 0.43 1.862 4.467 0.25 1.26 0.0 23.2 0.0100.010 0.5470.377 0.2560.333 ZF-UDS-5418 34.2937546 5.2269468 3.530.07 1.550.08 0.710.01 0.44 3.020 6.761 0.16 0.79 0.5 23.3 0.0490.010* 0.5600.443 0.4940.386 ZF-UDS-6119 34.2805405 5.2171388 4.050.27 1.860.15 0.840.10 0.55 5.623 10.471 0.10 0.50 1.0 23.8 0.0130.009 0.2240.477 0.3310.316 ZF-UDS-9526 34.3381844 5.1661916 3.970.18 2.110.12 1.200.03 0.89 16.596 18.621 0.16 0.63 1.8 24.2 0.0160.009 0.0380.351 0.0000.294 ZF-UDS-10401 34.3601379 5.1530914 3.910.38 1.820.13 1.280.17 0.38 0.001 0.002 0.02 0.25 1.7 24.6 0.0070.010 0.5000.340 0.4900.383 ZF-UDS-10684 34.3650742 5.1488328 3.950.48 2.030.16 1.120.10 0.85 3.802 4.467 0.25 1.26 1.0 24.1 0.0070.012 0.1050.388 0.5030.544 ZF-UDS-11483 34.3996315 5.1363320 3.630.32 2.240.05 1.210.08 1.02 0.000 0.000 0.01 1.00 1.0 23.6 0.0040.011 0.1490.409 0.7150.325
3. Selection of quiescent galaxies at .
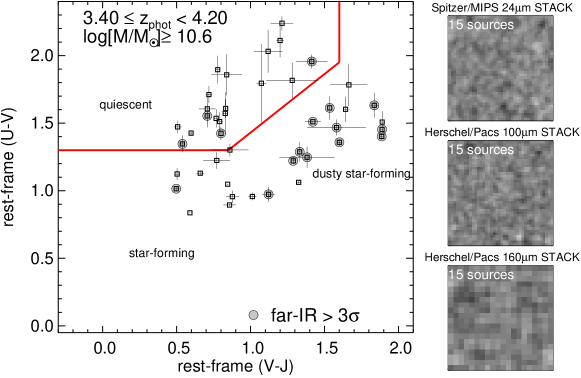
We use a two-color criterion (rest-frame versus ; Figure 1) to separate quiescent galaxies (red in , but blue in ) from star-forming galaxies, (blue or red in both and colors) (e.g., Labbé et al. 2005; Williams et al. 2009). This technique has been shown to isolate the red sequence of galaxies at (e.g., Whitaker et al. 2011) and was spectroscopically confirmed to identify quiescent galaxies at (e.g. Whitaker et al. 2013).
We focus on the redshift range , where the medium-bandwidth filters straddle the Balmer/ break. At the break enters the filter (), while at the band () still probes light redward of the break. We limit the sample to a signal-to-noise of 7 in and stellar masses of , where we are complete for passively evolving stellar populations formed at . This yields 44 galaxies with high quality photometry, of which 15 fall in the UVJ quiescent region and are undetected in the FIR, a significant fraction: % (15/44). A summary of their properties is presented in Table 1. Their photometric redshifts range from to with a mean of and mean uncertainty , leading to well constrained rest-frame colors. Two galaxies have spectroscopic redshifts, with a mean (Szokoly et al. 2004).
4. properties of quiescent galaxies at
4.1. Spectral energy distributions
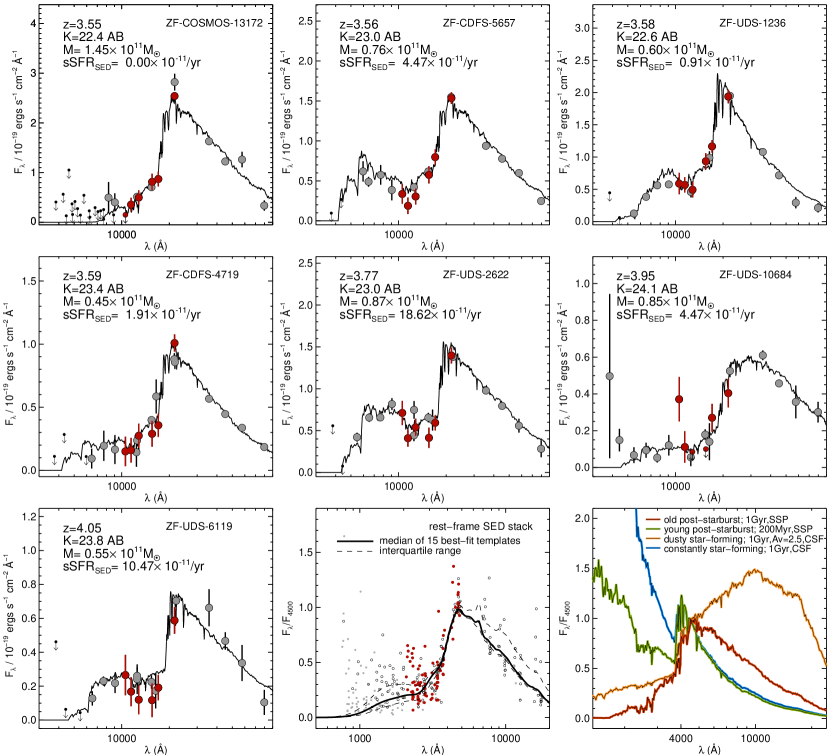
We show representative SEDs of seven galaxies in Figure 2. The median SED of all 15 (far-IR undetected) quiescent galaxies, constructed by de-redshifting their photometry and normalising them to the flux density at , is also shown.
The observed SEDs are exceedingly faint in the optical ( magnitude) and extremely red throughout the near-IR (median ). The SEDs are characterized by a sharp break, with and peaking in , and a blue spectral slope in the mid-IR Spitzer/IRAC bands (). The break is reminiscent of the strong break found in quiescent galaxies at lower redshift, where it is caused by combination of the Balmer and absorption features, indicative of a combination of relatively old stellar populations and suppressed star formation. Additionally, some galaxies exhibit a second break at bluer wavelengths, which is likely the Lyman break.
As it is difficult to separate the contribution of the Balmer break and the break from photometry alone, we quantify the size of the total combined break () by estimating the flux () ratio at and on the best-fit models of each galaxy individually, extending the definition of D4000n (Balogh et al. 1999) to cover the Balmer break as well. We find the median , which is in the range of post-starburst galaxies with suppressed star formation (e.g., a Myr model produces at 500Myr). In contrast, unobscured constant star-forming (CSF) models only reach at 1Gyr. Heavily obscured star-forming models (e.g. 1Gyr, CSF, ) can also reach quite red , but are ruled out as they predict very red , whereas the observed SED-slopes are bluer.
4.2. Stellar population fits
Models with exponentially declining SFRs fit the data well, with a median . The median best-fit age of the galaxies is Gyr, the median star formation timescale () Gyr, the average stellar mass , and the median specific SFR (sSFR) /yr.
To test if models with ongoing star formation provide acceptable fits to the sample, we force Myr, Gyr or CSF and refitted the data, finding a median , and . This shows that models with Myr provide almost equally good fits, but longer formation timescales (Gyr) provide poor fits to the data. For all individual galaxies Myr models produced better fits than did Gyr models. We note that high redshift solutions with low sSFRs are preferred in all cases. Other solutions, e.g. at low redshift or with ongoing obscured star formation are ruled out at more than % confidence for 18/19 galaxies.
We refitted the data using the models of Maraston (2005), and obtained a mean stellar mass of , with a typical offset of dex compared to the masses in Table 1, and a median sSFR of /yr. Hence the result is not strongly dependent on the adopted stellar population model.
Overall, the fits suggest most stars were formed at , followed by an epoch of suppressed star formation. As expected, the median stellar ages are lower than the typical age of 1.3 Gyr found at by Whitaker et al. (2013). We find some galaxies with very red and , pointing towards older stellar populations. However, their best-fit ages are the same as for the bluer galaxies, with larger redshift uncertainties or dust, suggesting that dust and photometric scatter are the main causes.
4.3. Independent constraints on SFR and AGN activity from Herschel
We derived Spitzer/MIPS , Herschel/PACS and flux intensities, measured in apertures of , and diameter with aperture corrections of 2.56, 2.45 and 2.60, respectively (assuming a point source profile). Light from neighbouring sources was subtraced following Labbé et al. (2010).
We find 1, 2 and 4 detections at , and , respectively. These 4/19 galaxies may have obscured star formation. The total detection rate (%) is lower than the 50% of detections reported earlier for quiescent galaxies (Stefanon et al. 2013). Two are also detected in Xray and are type2 QSOs (Szokoly et al. 2004; Xue et al. 2011), of which one is a radio source (Miller et al. 2013). A third Xray detection is found amongst the far-IR undetected galaxies, for a total of 3 likely AGN.
To place tighter constraints on the average far-IR luminosity of the 15 far-IR undetected galaxies, we stack their , and images (Figure 1), with uncertainties derived by bootstrap resampling. The formal measurements are mJy, mJy and mJy. Hence the sources are undetected. The strongest constraint on obscured SFR is obtained at . Using the IR templates of Wuyts et al. (2011), we find /yr. Given the mean mass of the sample (), this corresponds to a sSFR of . While these independently derived limits cannot rule out ongoing obscured star formation, they are consistent with the SED fits (/yr), and are smaller than the sSFR/yr of similarly massive galaxies at and typical UV-bright star-forming galaxies at (e.g. Stark et al. 2013; Viero et al. 2013).
4.4. Contamination by emission lines
We caution that the galaxies here could in fact be vigorously star-forming, if their band fluxes were boosted dramatically by emission lines ( and ), mimicking a Balmer Break (e.g. Shim et al. 2011; Stark et al. 2013). We tested this scenario by fitting CSF models to the SEDs without fitting the band, leading to fits with high obscuration (median ).
The CSF models fit the data poorly and vastly underpredict the median band: (note that standard models predict the band magnitude nearly perfectly: ). Assuming this excess is due to strong () emission lines, the predicted median SFR is /yr, which, because of the high obscuration, should result in detections in , but is not observed.
Furthermore, we can test the hypothesis that is boosted by and at , by looking at existing narrowband data, covering CDFSCOSMOS (Lee et al. 2012). Since the odds are only 20% that is affected by any of these lines, it effectively traces the continuum. Using a simple model, drawing uniformly random redshifts at , the predicted median color is , nearly independent of line ratios, in strong disagreement with the observed median . We also inspected data from the 3D-HST survey (Brammer et al. 2012), with low resolution spectral coverage at , as strong lines in would imply strong [OII] in the HST/WFC3 grism. We found only 2 detections for 13 galaxies with coverage to an emission line sensitivity of : for the QSO ZF-CDFS-617 and for the detected ZF-UDS-5418.
5. Implications
From hereon we adopt as operational definition of “quiescent”: galaxies that satisfy the UVJ criterium and are not detected in the far-IR (e.g. Bell et al. 2012). We note however, that the current data do not allow to determine conclusively whether the galaxies have completely stopped forming stars as the sample is too faint for spectrographs on large telescopes.
5.1. Number densities
From the 15 quiescent galaxies we estimate the volume and stellar mass density, finding and , respectively. Uncertainties are the quadratic sum of the Poission uncertainty and variations due to large scale structure (Moster et al. 2011). The volume density in the area in the ZFOURGEUDS field is higher than in the ZFOURGECOSMOS field, underscoring the need for probing mulitple pointings to faint limits.
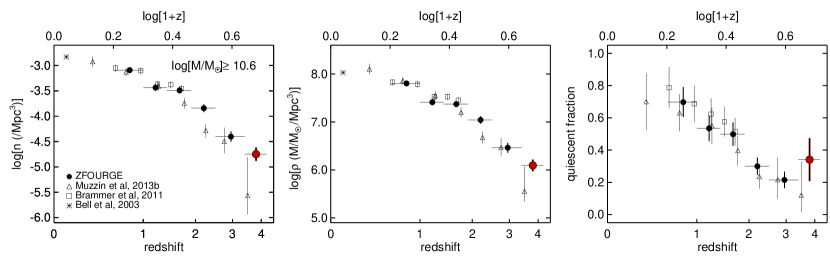
For comparison with other surveys, we integrated the COSMOS/UltraVISTA mass function at for quiescent galaxies of Muzzin et al. (2013), based on a similar UVJ classification, to . UltraVISTA produces a number density of and a mass density of . These are factors of and , lower (albeit at only significance). This is likely a completeness effect, as UltraVISTA is only complete to . Indeed, Muzzin et al. (2013) select galaxies with , while 50% of the galaxies here have .
The number and stellar mass densities of quiescent galaxies at are shown in Figure 3. These were obtained from the full ZFOURGE catalogs (Straatman et al., in prep), using the same selection criteria as described in section 3. The number density decreases rapidly towards ( lower than at and than at ), suggesting that a small fraction () of quiescent galaxies was already in place at . The last panel of Figure 3 shows the fraction of quiescent galaxies with . This strongly declines with redshift between . Therefore, we would expect a value close to zero at , but we find a surprisingly high fraction of %. This is similar to the value at (%), suggesting a flat quiescent fraction at .
5.2. Star-forming progenitors
Given average stellar ages of Gyr and masses of , the galaxies likely started forming their stars much earlier than , with SFRs well in excess of /yr. This raises the question what are the likely progenitors. In recent years, UV-luminous galaxies have been found in large numbers to (e.g. Bouwens et al. 2013; Ellis et al. 2013). These are actively star-forming, although even the most luminous galaxies found so far at have relatively modest UV-derived SFRs (/yr) (Smit et al. 2012).
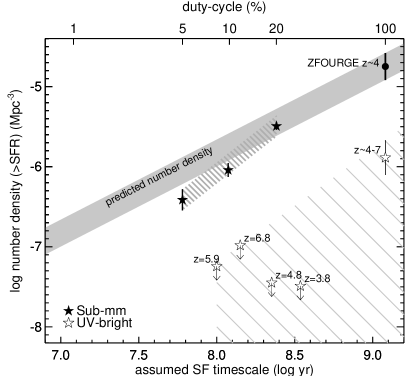
The expected number density at of the progenitors depends on the assumed star formation timescale (gray shaded area in Figure 4). If the progenitors were visible at all times (i.e. a formation timescale of 1 Gyr and number density of ), then we can use the SFR functions at (Smit et al. 2012) to select progenitors with sufficiently high SFRs on fixed cumulative number density (van Dokkum et al. 2010).
As shown in Figure 4, this number density falls dex short. If we assume shorter formation timescales (e.g. a few 100Myr), the progenitors require much higher SFRs and are predicted to be found in smaller numbers. Comparing to UV-luminosity functions from wide-field surveys, using the redshift window as the formation timescale, the number densities are dex too low, reflecting that sufficiently luminous UV-bright galaxies are extremely rare.
Alternatively, the main star formation episode is obscured by dust. There exists a population of high-redshift submm detected galaxies, including highly obscured gas-rich mergers (e.g. Younger et al. 2007), with large SFRs (/yr), that could be progenitors of quiescent galaxies. Based on the source counts of Karim et al. (2013), and tentatively assuming that 10% are at (e.g. Swinbank et al. 2012), we find that obscured starbursting galaxies are sufficiently numerous. This suggests that most of the star formation in the progenitors of quiescent galaxies could have been obscured by dust.
6. Summary
Using very deep imaging from ZFOURGE we find evidence for the existence of massive () galaxies with suppressed star formation at very early times (). The galaxies satisfy the UVJ criterium, which has been shown to efficiently select quiescent galaxies at (Whitaker et al. 2011, 2013; Williams et al. 2009). The observed SEDs show prominent breaks, well sampled by the FourStar near-IR medium-bands, leading to accurate photometric redshifts and illustrating a key strength of the survey. The SEDs are well fit by models with strong Balmer/ breaks, small , high ages (Gyr) and low sSFRs (/yr). Consistent with this, 79% of the galaxies are undetected in deep Spitzer/MIPS and Herschel/PACS imaging. Stacking the far-IR places an independent constraint on the average sSFR of , a factor smaller than the average sSFR of UV-bright star-forming galaxies at these redshifts (e.g. Stark et al. 2013) and consistent with these galaxies having strongly suppressed SFRs.
While rare (with number densities and lower than at and ), they make up a surprisingly high fraction of the massive galaxy population at (%), higher than expected based on the declining trend over , suggesting an effective mechanism of suppressing star formation and short formation timescales (Gyr). The implied SFRs needed to form galaxies with a mean stellar mass of in such a short time exceeds that of similarly abundant UV-bright galaxies at , suggesting that most of the star formation in their progenitors was obscured by dust.
We emphasize that without spectroscopic confirmation the number of quiescent galaxies at remains poorly constrained, but given their faint magnitudes, real progress will likely have to wait until the launch of JWST or construction of ELTs. Currently, ALMA observations can place stronger limits on the dust-obscured activity of these galaxies and help identify the progenitors at .
7. Acknowledgements
This research was supported in part by the George P. and Cynthia Woods Mitchell Institute for Fundamental Physics and Astronomy. We would especially like to thank the Mitchell family for their continuing support. We thank Danilo Marchesini and Adam Muzzin for help with the UltraVISTA number densities. We thank Marijn Franx, Mattia Fumagalli, Shannon Patel, Jesse van de Sande, David Sobral, Renske Smit, Paul van der Werf and Claudia Maraston for useful discussions. We acknowledge support by the following grants: NSF AST-1009707, ERC HIGHZ #227749 and NL-NWO Spinoza. Australian access to the Magellan Telescopes was supported through the NCRIS of the Australian Federal Government. This work is based on observations made with Herschel, an ESA Cornerstone Mission with significant participation by NASA, through an award issued by JPL/Caltech.
References
- Balogh et al. (1999) Balogh, M. L., Morris, S. L., Yee, H. K. C., Carlberg, R. G., & Ellingson, E. 1999, ApJ, 527, 54
- Bell et al. (2003) Bell, E. F., McIntosh, D. H., Katz, N., & Weinberg, M. D. 2003, ApJS, 149, 289
- Bell et al. (2012) Bell, E. F., et al. 2012, ApJ, 753, 167
- Blain et al. (2002) Blain, A. W., Smail, I., Ivison, R. J., Kneib, J.-P., & Frayer, D. T. 2002, Phys. Rep., 369, 111
- Bouwens et al. (2012) Bouwens, R. J., et al. 2012, ApJ, 754, 83
- Bouwens et al. (2013) —. 2013, ApJ, 765, L16
- Bowler et al. (2012) Bowler, R. A. A., et al. 2012, MNRAS, 426, 2772
- Brammer et al. (2008) Brammer, G. B., van Dokkum, P. G., & Coppi, P. 2008, ApJ, 686, 1503
- Brammer et al. (2011) Brammer, G. B., et al. 2011, ApJ, 739, 24
- Brammer et al. (2012) —. 2012, ApJS, 200, 13
- Bruzual & Charlot (2003) Bruzual, G., & Charlot, S. 2003, MNRAS, 344, 1000
- Chabrier (2003) Chabrier, G. 2003, PASP, 115, 763
- Chen & Marzke (2004) Chen, H.-W., & Marzke, R. O. 2004, ApJ, 615, 603
- Daddi et al. (2005) Daddi, E., et al. 2005, ApJ, 626, 680
- Elbaz et al. (2011) Elbaz, D., et al. 2011, A&A, 533, A119
- Ellis et al. (2013) Ellis, R. S., et al. 2013, ApJ, 763, L7
- Fontana et al. (2009) Fontana, A., et al. 2009, A&A, 501, 15
- Grogin et al. (2011) Grogin, N. A., et al. 2011, ApJS, 197, 35
- Guo et al. (2013) Guo, Y., et al. 2013, ApJS, 207, 24
- Karim et al. (2013) Karim, A., et al. 2013, MNRAS, 432, 2
- Kennicutt (1998) Kennicutt, Jr., R. C. 1998, ARA&A, 36, 189
- Koekemoer et al. (2011) Koekemoer, A. M., et al. 2011, ApJS, 197, 36
- Kriek et al. (2009) Kriek, M., van Dokkum, P. G., Labbé, I., Franx, M., Illingworth, G. D., Marchesini, D., & Quadri, R. F. 2009, ApJ, 700, 221
- Labbé et al. (2005) Labbé, I., et al. 2005, ApJ, 624, L81
- Labbé et al. (2010) —. 2010, ApJ, 716, L103
- Lee et al. (2012) Lee, J. C., et al. 2012, PASP, 124, 782
- Mancini et al. (2009) Mancini, C., Matute, I., Cimatti, A., Daddi, E., Dickinson, M., Rodighiero, G., Bolzonella, M., & Pozzetti, L. 2009, A&A, 500, 705
- Maraston (2005) Maraston, C. 2005, MNRAS, 362, 799
- Miller et al. (2013) Miller, N. A., et al. 2013, ApJS, 205, 13
- Moster et al. (2011) Moster, B. P., Somerville, R. S., Newman, J. A., & Rix, H.-W. 2011, ApJ, 731, 113
- Muzzin et al. (2013) Muzzin, A., et al. 2013, ApJ, 777, 18
- Persson et al. (2013) Persson, S. E., et al. 2013, PASP, 125, 654
- Shim et al. (2011) Shim, H., Chary, R.-R., Dickinson, M., Lin, L., Spinrad, H., Stern, D., & Yan, C.-H. 2011, ApJ, 738, 69
- Smit et al. (2012) Smit, R., Bouwens, R. J., Franx, M., Illingworth, G. D., Labbé, I., Oesch, P. A., & van Dokkum, P. G. 2012, ApJ, 756, 14
- Stark et al. (2013) Stark, D. P., Schenker, M. A., Ellis, R., Robertson, B., McLure, R., & Dunlop, J. 2013, ApJ, 763, 129
- Stefanon et al. (2013) Stefanon, M., Marchesini, D., Rudnick, G. H., Brammer, G. B., & Whitaker, K. E. 2013, ApJ, 768, 92
- Swinbank et al. (2012) Swinbank, A. M., et al. 2012, MNRAS, 427, 1066
- Szokoly et al. (2004) Szokoly, G. P., et al. 2004, ApJS, 155, 271
- Tomczak et al. (2013) Tomczak, A. R., et al. 2013, ArXiv e-prints
- van der Burg et al. (2010) van der Burg, R. F. J., Hildebrandt, H., & Erben, T. 2010, A&A, 523, A74
- van Dokkum et al. (2008) van Dokkum, P. G., et al. 2008, ApJ, 677, L5
- van Dokkum et al. (2010) —. 2010, ApJ, 709, 1018
- Viero et al. (2013) Viero, M. P., et al. 2013, ApJ, 779, 32
- Whitaker et al. (2011) Whitaker, K. E., et al. 2011, ApJ, 735, 86
- Whitaker et al. (2013) —. 2013, ApJ, 770, L39
- Wiklind et al. (2008) Wiklind, T., Dickinson, M., Ferguson, H. C., Giavalisco, M., Mobasher, B., Grogin, N. A., & Panagia, N. 2008, ApJ, 676, 781
- Williams et al. (2009) Williams, R. J., Quadri, R. F., Franx, M., van Dokkum, P., & Labbé, I. 2009, ApJ, 691, 1879
- Willott et al. (2013) Willott, C. J., et al. 2013, AJ, 145, 4
- Wuyts et al. (2011) Wuyts, S., et al. 2011, ApJ, 738, 106
- Xue et al. (2011) Xue, Y. Q., et al. 2011, ApJS, 195, 10
- Younger et al. (2007) Younger, J. D., et al. 2007, ApJ, 671, 1531