Urban Landscape is an Important Factor in Rising Inequality, Spatial Segregation, and Social Isolation
Abstract
Urbanization has been the dominant demographic trend in the entire world, during the last half century. Rural to urban migration, international migration, and the re-classification or expansion of existing city boundaries have been among the major reasons for increasing urban population. The essentially fast growth of cities in the last decades urgently calls for a profound insight into the common principles stirring the structure of urban developments all over the world.
We have discussed the graph representations of urban spatial structures and suggested a computationally simple technique that can be used in order to spot the relatively isolated locations and neighborhoods, to detect urban sprawl, and to illuminate the hidden community structures in complex urban textures. The approach may be implemented for the detailed expertise of any urban pattern and the associated transport networks that may include many transportation modes.
Faculty of Physics, Bielefeld University, Universitaetsstr. 25, 33615 Bielefeld, Germany
Keywords: Urban spatial networks, Rising Inequality, Spatial Segregation, Social Isolation
1 Introduction
A belief in the influence of the built environment on humans was common in architectural and urban thinking for centuries. Cities generate more interactions with more people than rural areas because they are central places of trade that benefit those who live there. People moved to cities because they intuitively perceived the advantages of urban life. City residence brought freedom from customary rural obligations to lord, community, or state and converted a compact space pattern into a pattern of relationships by constraining mutual proximity between people. Spatial organization of a place has an extremely important effect on the way people move through spaces and meet other people by chance, [1]. Compact neighborhoods can foster casual social interactions among neighbors, while creating barriers to interaction with people outside a neighborhood. Spatial configuration promotes peoples encounters as well as making it possible for them to avoid each other, shaping social patterns, [2].
The phenomenon of clustering of minorities, especially that of newly arrived immigrants, is well documented since the work of [3] (the reference appears in [4]). Clustering is considering to be beneficial for mutual support and for the sustenance of cultural and religious activities. At the same time, clustering and the subsequent physical segregation of minority groups would cause their economic marginalization. The study of London’s change over 100 years performed by [5] has indicated that the creation of poverty areas is a spatial process: by looking at the distribution of poverty at the street, it is possible to find a relationship between spatial segregation and poverty. The patterns of mortality in London studied over the past century by [6] show that the areas of persistence of poverty cannot be explained other than by an underlying spatial effect.
Urban planning is recognized to play a crucial position in the development of sustainable cities. The essentially fast growth of cities in the last decades urgently calls for a profound insight into the common principles stirring the structure of urban development all over the world.
Sociologists think that isolation worsens an area’s economic prospects by reducing opportunities for commerce, and engenders a sense of isolation in inhabitants, both of which can fuel poverty and crime. Urban planners and governments have often failed to take such isolation into account when shaping the city landscape, not least because isolation can sometimes be difficult to quantify in the complex fabric of a major city. The source of such a difficulty is profound: while humans live and act in Euclidean space which they percept visually as affine space and which is present in them as a mental form, a complex network of interconnected spaces of movements that constitutes a spatial urban pattern does not possess the structure of Euclidean space. In another circumstance we spoke of fishes: they know nothing either of what the sea, or a lake, or a river might really be and only know fluid as if it were air around them. While in a complex built environment, humans have no sensation of it, but need time to construct its ”affine representation” so they can understand and store it in their spatial memory. Therefore, human behaviors in complex environments result from a long learning process and the planning of movements within them. In [7], we suggested that random walks can help us to find such an ”affine representation” of the built environment, giving us a leap outside our Euclidean ”aquatic surface” and opening up and granting us the sensation of new space.
While travelling in the city, our primary interest is often in finding the best route from one place to another. Since the way-finding process is a purposive, directed, and motivated activity [8], the shortest route is not necessary the best one. If an origin and a destination are not directly connected by a continuous path, wayfinding may include search and exploration actions for which it may be crucial to recognize juxtaposed and distant landmarks, to determine turn angles and directions of movement, and eventually to embed the route in some large reference frame. It is well known that the conceptual representations of space in humans do not bear a one-to-one correspondence with actual physical space. The process of integration of the local affine models of individual places into the entire cognitive map of the urban area network is very complicated and falls largely within the domain of cognitive science and psychology, but nevertheless the specification of what may be recovered from spatial memory can be considered as a problem of mathematics – ”the limits of human perception coincide with mathematically plausible solutions”, [9]. Supposing the inherent mobility of humans and alikeness of their spatial perception aptitudes, one might argue that nearly all people experiencing the city would agree in their judgments on the total number of individual locations in that, in identification of the borders of these locations, and their interconnections. In other words, we assume that spatial experience in humans intervening in the city may be organized in the form of a universally acceptable network.
Well-known and frequently travelled path segments provide linear anchors for certain city districts and neighborhoods that helps to organize collections of spatial models for the individual locations into a configuration representing the mental image of the entire city. In our study, we assume that the frequently travelled routes are nothing else but the ”projective invariants” of the given layout of streets and squares in the city – the function of its geometrical configuration, which remains invariant whatever origin-destination route is considered. The arbitrary linear transformations of the geometrical configuration with respect to which a certain property remains invariant constitute the generalized affine transformations.
It is intuitively clear that if the spatial configuration of the city is represented by a regular graph, where each location represented by a vertex has the same number of neighbors, in absence of other local landmarks, all paths would be equally probably followed by travelers. No linear anchors are possible in such an urban pattern which could stimulate spatial apprehension. However, if the spatial graph of the city is far from being regular, then a configuration disparity of different places in the city would result in that some of them may be visited by travelers more often than others.
In the following sections of our work, we study the problem of isolation in cities with the use of random walks that provide us with an effective tool for the detailed structural analysis of connected undirected graphs exposing their symmetries, [7].
2 Spatial graphs of urban environments
In traditional urban researches, the dynamics of an urban pattern come from the landmasses, the physical aggregates of buildings delivering place for people and their activity. The relationships between certain components of the urban texture are often measured along streets and routes considered as edges of a planar graph, while the traffic end points and street junctions are treated as nodes. Such a primary graph representation of urban networks is grounded on relations between junctions through the segments of streets. The usual city map based on Euclidean geometry can be considered as an example of primary city graphs.
In space syntax theory (see [1, 10]), built environments are treated as systems of spaces of vision subjected to a configuration analysis. Being irrelevant to the physical distances, spatial graphs representing the urban environments are removed from the physical space. It has been demonstrated in multiple experiments that spatial perception shapes peoples understanding of how a place is organized and eventually determines the pattern of local movement, [10]. The aim of the space syntax study is to estimate the relative proximity between different locations and to associate these distances to the densities of human activity along the links connecting them, [11, 12, 13]. The surprising accuracy of predictions of human behavior in cities based on the purely topological analysis of different urban street layouts within the space syntax approach attracts meticulous attention [14].
The decomposition of urban spatial networks into the complete sets of intersecting open spaces can be based on a number of different principles. In [15], while identifying a street over a plurality of routes on a city map, the named-street approach has been used, in which two different arcs of the primary city network were assigned to the same identification number (ID) provided they share the same street name.
In the present chapter, we take a ”named-streets”-oriented point of view on the decomposition of urban spatial networks into the complete sets of intersecting open spaces following our previous works [16, 17]. Being interested in the statistics of random walks defined on spatial networks of urban patterns, we assign an individual street ID code to each continuous segment of a street. The spatial graph of urban environment is then constructed by mapping all edges (segments of streets) of the city map shared the same street ID into nodes and all intersections among each pair of edges of the primary graph into the edges of the secondary graph connecting the corresponding nodes.
Although graphs are usually shown diagrammatically, they can also be represented as matrices. The major advantage of matrix representation is that then the analysis of graph structure can be performed using well known operations on matrices. For each graph, there exists a unique adjacency matrix (up to permuting rows and columns) which is not the adjacency matrix of any other graph. If we assume that the spatial graph of the city is simple (i.e., it contains neither loops, nor multiple edges), the adjacency matrix is a -matrix with zeros on its diagonal:
| (1) |
If the graph is undirected, the adjacency matrix is symmetric, . If the graph contains twins nodes, the correspondent rows and columns of are identical.
3 Graphs as discrete time dynamical systems
A finite connected undirected graph can be seen as a discrete time dynamical system possessing a finite number of states (nodes) [18]. The behavior of such a dynamical system can be studied by means of a transfer operator which describes the time evolution of distributions in phase space. The transfer operator can be represented by a stochastic matrix determining a discrete time random walk on the graph in which a walker picks at each node between the various available edges with equal probability. An obvious benefit of the approach based on random walks to graph theory is that the relations between individual nodes and subgraphs acquire a precise quantitative probabilistic description that enables us to attack applied problems which could not even be started otherwise. Given a finite connected undirected graph let us consider a transformation mapping any subset of nodes into the set of their direct neighbors, We denote the result of consequent applications of to as . The iteration of the map leads to a study of possible paths in the graph beginning at However, we rather discuss the time evolution of smooth functions under iteration, than the individual trajectories Given a discrete density function defined on a undirected connected graph such that the dynamics of the map is described by the norm-preserving transformation
| (2) |
where is the Ruelle - Perron - Frobenius transfer operator corresponding to the transformation The uniqueness of the Ruelle - Perron - Frobenius operator for a given transformation is a consequence of the Radon - Nikodym theorem extending the concept of probability densities to probability measures defined over arbitrary sets, [19]. It was shown by [20] that the relation (2) is satisfied by a homogeneous Markov chain determining a random walk of the nearest neighbor type defined on the connected undirected graph by the transition matrix
| (3) |
where is the adjacency matrix of the graph, so that the probability of transition from to in steps equals The discrete time random walks on graphs have been studied in details in [21, 22] and by many other authors. For a random walk defined on a connected undirected graph, the Perron - Frobenius theorem asserts the unique strictly positive probability vector (the left eigenvector of the transition matrix belonging to the maximal eigenvalue ) such that For the nearest neighbor random walks defined on an undirected graph, the stationary distribution of random walks on an undirected graph equals
| (4) |
where is the number of immediate neighbors of the node , and is the total number of edges in the graph. The vector satisfies the condition of detailed balance, from which it follows that a random walk defined on an undirected graph is time reversible: it is also a random walk if considered backward, and it is not possible to determine, given the walker at a number of nodes in time after running the walk, which state came first and which state arrived later. The stationary distribution (4) of random walks defined on a connected undirected graph determines a unique measure on with respect to which the transition operator (3) becomes self-adjoint and is represented by a symmetric transition matrix,
| (5) |
where is the diagonal matrix of graph’s degrees.
Diagonalizing the symmetric matrix (5), we obtain where is an orthonormal matrix, and is a diagonal matrix with entries (here, we do not consider bipartite graphs, for which ). The rows of the orthonormal matrix forms an orthonormal basis in Hilbert space where is the -dimensional unit sphere. We consider the eigenvectors ordered in accordance to the eigenvalues they belong to. For eigenvalues of algebraic multiplicity , a number of linearly independent orthonormal ordered eigenvectors can be chosen to span the associated eigenspace. The first eigenvector belonging to the largest eigenvalue (which is simple) is the Perron-Frobenius eigenvector that determines the stationary distribution of random walks over the graph nodes, , . The squared Euclidean norm of the vector in the orthogonal complement of , , expresses the probability that a random walker is not in .
4 Affine probabilistic geometry of eigenvector embedding and probabilistic Euclidean distance on graphs
Discovering of important nodes and quantifying differences between them in a graph is not easy, since the graph does not possess a priori the structure of Euclidean space. We use the algebraic properties of the self-adjoint operators in order to define an Euclidean metric on any finite connected undirected graph. Geometric objects, such as points, lines, or planes, can be given a representation as elements in projective space based on homogeneous coordinates. Given an orthonormal basis in any vector in Euclidean space can be expanded into Provided are the eigenvectors of the symmetric matrix of the operator we can define new basis vectors, since we have always for any The new basis vectors span the projective space so that the vector can be expanded into
| (6) |
It is easy to see that the transformation (6) defines a stereographic projection on such that all vectors in collinear to the vector corresponding to the stationary distribution of random walks are projected onto a common image point. If the graph has some isolated nodes for which they play the role of the plane at infinity with respect to (6), away from which we can use the basis as an ordinary Cartesian system. The transition to the homogeneous coordinates transforms vectors of into vectors on the -dimensional hyper-surface , the orthogonal complement to the vector of stationary distribution .
The Green function (a pseudo-inverse) of the normalized Laplace operator describing the diffusion of random walkers over the undirected graph is given in the homogeneous coordinates by In order to obtain a Euclidean metric on the graph , one needs to introduce distances between points (nodes of the graph) and the angles between vectors pointing at them that can be done by determining the dot product between any two vectors by The dot product is a symmetric real valued scalar function that allows us to define the (squared) norm of a vector by The squared norm
| (7) |
of the canonical basis vector representing the node is nothing else, but the spectral representation of the first passage time to the node , the expected number of steps required to reach the node for the first time starting from a node randomly chosen among all nodes of the graph accordingly to the stationary distribution . The first passage time, , can be directly used in order to characterize the level of accessibility of the node , [23]. The Euclidean distance between two vectors, and , given by is nothing else, but the commute time, the expected number of steps required for a random walker starting at to visit and then to return back to , [23].
5 First-passage times to ghettos
The phenomenon of clustering of minorities, especially that of newly arrived immigrants, is well documented [24]. Clustering is considering to be beneficial for mutual support and for the sustenance of cultural and religious activities. At the same time, clustering and the subsequent physical segregation of minority groups would cause their economic marginalization. The spatial analysis of the immigrant quarters [25] and the study of London’s changes over 100 years [26] shows that they were significantly more segregated from the neighboring areas, in particular, the number of street turning away from the quarters to the city centers were found to be less than in the other inner-city areas being usually socially barricaded by railways, canals and industries. It has been suggested [27] that space structure and its impact on movement are critical to the link between the built environment and its social functioning. Spatial structures creating a local situation in which there is no relation between movements inside the spatial pattern and outside it and the lack of natural space occupancy become associated with the social misuse of the structurally abandoned spaces.
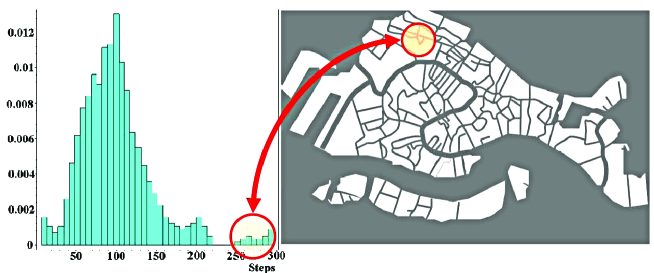
We have analyzed the first-passage times to individual canals in the spatial graph of the canal network in Venice. The distribution of numbers of canals over the range of the first–passage time values is represented by a histogram shown in Fig. 1.left. The height of each bar in the histogram is proportional to the number of canals in the canal network of Venice for which the first–passage times fall into the disjoint intervals (known as bins). Not surprisingly, the Grand Canal, the giant Giudecca Canal and the Venetian lagoon are the most connected. In contrast, the Venetian Ghetto (see Fig. 1.right) – jumped out as by far the most isolated, despite being apparently well connected to the rest of the city – on average, it took 300 random steps to reach, far more than the average of 100 steps for other places in Venice.
The Ghetto was created in March 1516 to separate Jews from the Christian majority of Venice. It persisted until 1797, when Napoleon conquered the city and demolished the Ghetto’s gates. Now it is abandoned.
6 Why is Manhattan so expensive?
The notion of isolation acquires the statistical interpretation by means of random walks. The first-passage times in the city vary strongly from location to location. Those places characterized by the shortest first-passage times are easy to reach while very many random steps would be required in order to get into a statistically isolated site.
Being a global characteristic of a node in the graph, the first-passage time assigns absolute scores to all nodes based on the probability of paths they provide for random walkers. The first-passage time can therefore be considered as a natural statistical centrality measure of the node within the graph, [7].
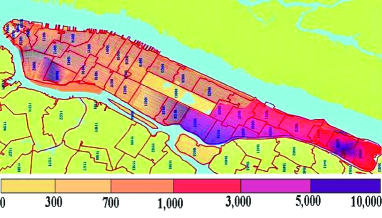
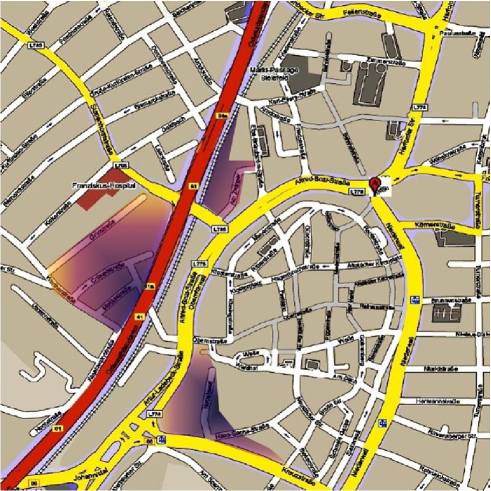
A visual pattern displayed on Fig. 2 represents the pattern of structural isolation (quantified by the first-passage times) in Manhattan (darker color corresponds to longer first-passage times). It is interesting to note that the spatial distribution of isolation in the urban pattern of Manhattan (Fig. 2) shows a qualitative agreement with the map of the tax assessment value of the land in Manhattan reported by B. Rankin (2006) in the framework of the RADICAL CARTOGRAPHY project being practically a negative image of that.
| 1). | 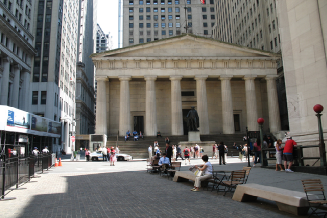 |
2). |  |
| 3). |  |
4). |  |
| 5). |  |
6). |  |
The first-passage times enable us to classify all places in the spatial graph of Manhattan into four groups accordingly to the first-passage times to them [7]. The first group of locations is characterized by the minimal first-passage times; they are probably reached for the first time from any other place of the urban pattern in just 10 to 100 random navigational steps (the heart of the city), see Fig. 3.1 and Fig. 3.2. These locations are identified as belonging to the downtown of Manhattan (at the south and southwest tips of the island) – the Financial District and Midtown Manhattan. It is interesting to note that these neighborhoods are roughly coterminous with the boundaries of the ancient New Amsterdam settlement founded in the late 17th century. Both districts comprise the offices and headquarters of many of the city’s major financial institutions such as the New York Stock Exchange and the American Stock Exchange (in the Financial District). Federal Hall National Memorial is also encompassed in this area that had been anchored by the World Trade Center until the September 11, 2001 terrorist attacks. We might conclude that the group of locations characterized by the best structural accessibility is the heart of the public process in the city.
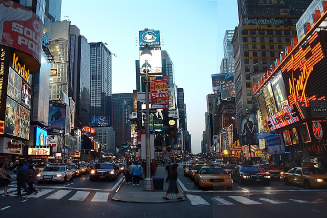
The neighborhoods from the second group (the city core) comprise the locations that can be reached for the first time in several hundreds to roughly a thousand random navigational steps from any other place of the urban pattern (Fig. 3.3 and Fig. 3.4). SoHo (to the south of Houston Street), Greenwich Village, Chelsea (Hell’s Kitchen), the Lower East Side, and the East Village are among them – they are commercial in nature and known for upscale shopping and the ”Bohemian” life-style of their dwellers contributing into New York’s art industry and nightlife.
The relatively isolated neighborhoods such as Bowery (Fig. 3.5), some segments in Hamilton Heights and Hudson Heights, Manhattanville (bordered on the south by Morningside Heights), TriBeCa (Triangle Below Canal) and some others can be associated to the third structural category as being reached for the first time from 1,000 to 3,000 random steps starting from a randomly chosen place in the spatial graph of Manhattan. Interestingly, that many locations belonging to the third structural group comprises the diverse and eclectic mix of different social and religious groups. Many famous houses of worship had been established there during the late 19th century – St. Mary’s Protestant Episcopal Church, Church of the Annunciation, St. Joseph’s Roman Catholic Church, and Old Broadway Synagogue in Manhattanville are among them. The neighborhood of Bowery in the southern portion of Manhattan had been most often associated with the poor and the homeless. From the early 20th century, Bowery became the center of the so called ”b’hoy” subculture of working-class young men frequenting the cruder nightlife. Petty crime and prostitution followed in their wake, and most respectable businesses, the middle-class, and entertainment had fled the area. Nowadays, the dramatic decline has lowered crime rates in the district to a level not seen since the early 1960s and continue to fall. Although zero-tolerance policy targeting petty criminals is being held up as a major reason for the crime combat success, no clear explanation for the crime rate fall has been found.
The last structural category comprises the most isolated segments in the city mainly allocated in the Spanish and East Harlems. They are characterized by the longest first-passage times from 5,000 to 10,000 random steps (Fig. 3.6). Structural isolation is fostered by the unfavorable confluence of many factors such as the close proximity to Central Park (an area of 340 hectares removed from the otherwise regular street grid), the boundness by the strait of Harlem River separating the Harlem and the Bronx, and the remoteness from the main bridges (the Triborough Bridge, the Willis Avenue Bridge, and the Queensboro Bridge) that connect the boroughs of Manhattan to the urban arrays in Long Island City and Astoria. Many social problems associated with poverty from crime to drug addiction have plagued the area for some time. The haphazard change of the racial composition of the neighborhood occurred at the beginning of the 20th century together with the lack of adequate urban infrastructure and services fomenting racial violence in deprived communities and made the neighborhood unsafe – Harlem became a slum. The neighborhood had suffered with unemployment, poverty, and crime for quite long time and even now, despite the sweeping economic prosperity and redevelopment of many sections in the district, the core of Harlem remains poor.
Recently, we have discussed in [23] that distributions of various social variables (such as the mean household income and prison expenditures in different zip code areas) may demonstrate the striking spatial patterns which can be analyzed by means of random walks. In the present work, we analyze the spatial distribution of the tax assessment rate (TAR) in Manhattan.
The assessment tax relies upon a special enhancement made up of the land or site value and differs from the market value estimating a relative wealth of the place within the city commonly referred to as the ’unearned’ increment of land use, [28]. The rate of appreciation in value of land is affected by a variety of conditions, for example it may depend upon other property in the same locality, will be due to a legitimate demand for a site, and for occupancy and height of a building upon it.
The current tax assessment system enacted in 1981 in the city of New York classifies all real estate parcels into four classes subjected to the different tax rates set by the legislature: (i) primarily residential condominiums; (ii) other residential property; (iii) real estate of utility corporations and special franchise properties; (iv) all other properties, such as stores, warehouses, hotels, etc. However, the scarcity of physical space in the compact urban pattern on the island of Manhattan will naturally set some increase of value on all desirably located land as being a restricted commodity. Furthermore, regulatory constraints on housing supply exerted on housing prices by the state and the city in the form of ’zoning taxes’ are responsible for converting the property tax system in a complicated mess of interlocking influences and for much of the high cost of housing in Manhattan, [29].
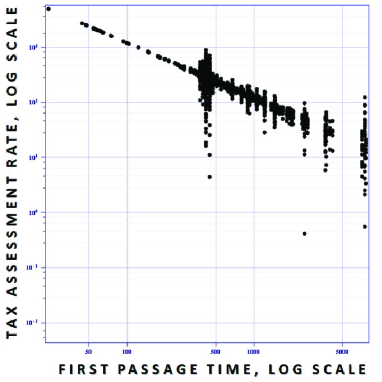
Being intrigued with the likeness of the tax assessment map and the map of isolation in Manhattan, we have mapped the TAR figures publicly available through the Office of the Surveyor at the Manhattan Business Center onto the data on first-passage times to the corresponding places. The resulting plot is shown in Fig. 4, in the logarithmic scale. The data presented in Fig. 4 positively relates the geographic accessibility of places in Manhattan with their ’unearned increments’ estimated by means of the increasing burden of taxation. The inverse linear pattern dominating the data is best fitted by the simple hyperbolic relation between the tax assessment rate (TAR) and the value of first–passage time (FPT), in which is a fitting constant.
7 Mosque and church in dialog
Churches are buildings used as religious places, in the Christian tradition. In addition to being a place of worship, the churches in Western Europe were utilized by the community in other ways – they could serve as a meeting place for guilds. Typically, their location were at a focus of a neighborhood, or a settlement.
Nowadays, because of the intensive movement of people between countries, the new national unities out of cultural and religious diversity have appeared. United States possessing rich tradition of immigrants have demonstrated the ability of an increasingly multicultural society to unite different religious, ethnic and linguistic groups into the fabric of the country, and many European countries follow that way, [30].
Religious beliefs and institutions have played and continue to play a crucial role in new immigrant communities. Religious congregations often provide ethnic, cultural and linguistic reinforcements, and often help newcomers to integrate by offering a connection to social groups that mediate between the individual and the new society, so that immigrants often become even more religious once in the new country of residence, [31].
It is not a surprise that the buildings belonging to religious congregations of newly arrived immigrants are usually located not at the centers of cities in the host country – the changes in function results in a change of location. In the previous section, we have discussed that religious organizations of immigrants in the urban pattern of Manhattan have been usually founded in the relatively isolated locations, apart from the city core, like those in Manhattanville. We have seen that the typical first-passage times to the ”religious” places of immigrant communities in Manhattan scale from 1,000 to 3,000 random steps. It is interesting to check this observation also for the religious congregation buildings of recent immigrants in Western Europe.
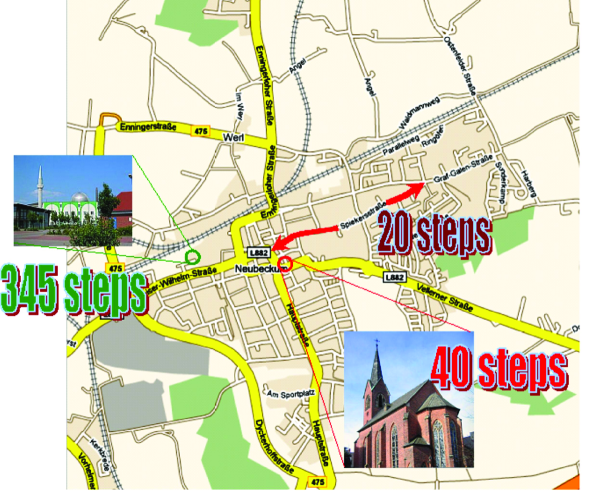
Despite the mosque and the church are located in close geographic proximity in the city of Neubeckum (Nordrhein-Westfalen, Germany), their locations are dramatically different with respect to the entire city structure. The analysis of the spatial graph of the city of Neubeckum by random walks shows that while the church is situated in a place belonging to the city core, and just 40 random steps are required in order to reach it for the first time from any arbitrary chosen place, a random walker needs 345 random steps to arrive at the mosque. The commute time, the expected number of steps a random walker needs to reach the mosque from the church and then to return back, equals 405 steps.
Spiekersstrasse, the street which is parallel to the railway, now is the best accessible place of motion in Neubeckum playing the role of its structural ”center of mass”; it can be achieved from any other location in the city in just 20 random steps. The relation between the extent of structural isolation and the specified reference levels can be measured in a logarithmic scale by using as unit of decibel (dB), [7]. When referring to estimates of isolation by means of first-passage times (FPT), a ratio between two levels inherent to the different locations A and B can be expressed in decibels by evaluating, where and are the first-passage times to A and B respectively. If we estimate relative isolation of other places of motion with respect to Spiekersstrasse by comparing their first-passage times in the logarithmic scale, then the location of the church is evaluated by dB of isolation, and dB, for the mosque.
Indeed, isolation was by no means the aim of the Muslim community. The mosque in Neubeckum has been erected on a vacant place, where land is relatively cheap. However, structural isolation under certain conditions would potentially have dramatic social consequences. Efforts to develop systematic dialogue and increased cooperation based on a reinforced culture of consultations are viewed as essential to deliver a sustainable community.
8 Which place is the ideal Bielefeld crime scene?
Bielefeld is a city in the north-east of North-Rhine Westphalia (Germany) famous as a home to a significant number of internationally operating companies.
”Which place is the ideal Bielefeld crime scene?” This question has been recently addressed by the Bielefeld–heute (”Bielefeld today”) weekly newspaper to those crime fiction authors who had chosen Bielefeld as a stage for the criminal stories of their novels. Although the above question falls largely within the domain of criminal psychology, it can also be considered as a problem of mathematics – since the limits of human perception coincide with mathematically plausible solutions.
We have analyzed how easy it is to get to various places on the labyrinth in the network of 200 streets located at the city centre of Bielefeld aiming to capture a neighborhood’s inaccessibility which could expose hidden islands of future deprivation and social misuse in that. For our calculations, we imagined pedestrians wandering randomly along the streets and worked out the average number of random turns at junctions they would take to reach any particular place in Bielefeld from various starting points. Not surprisingly, the August-Bebel Str., Dorotheenstraße and the Herforder Str. were the most accessible in the city. In contrast, we found that the certain districts located along the rail road (see the map shown in Fig. 6) jumped out as by far the most isolated, despite being apparently well connected to the rest of the city.
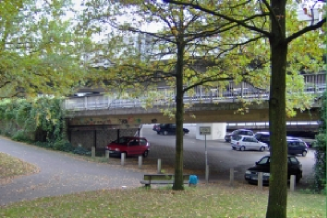
On average, it took from 1,389 to 1,471 random treads to reach such the god-forsaken corners as the parking places on Am Zwinger (Fig. 7.1), the neighbourhood centered by the Crüwellstraße (Fig. 7.2), the waste places close to the Natural History Museum and the city Art Gallery (Fig. 7.3) - far more than the average of 450 steps for other places in Bielefeld.
| 1). | 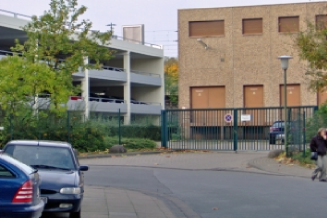 |
2). |  |
| 3). | 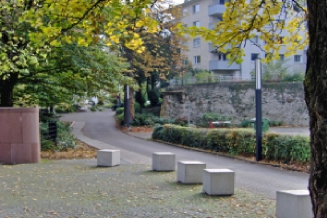 |
The inhospitable isolation of these places can be estimated numerically, however people rather percept it intuitively. Although the actual criminal rate in Bielefeld appears to be relatively low, many pulp fiction authors found the city a suitable place for their criminal stories that indeed recalls us the sustained satirical Internet-Myth of the Bielefeld Verschwörung (Bielefeld Conspiracy). In spite of all efforts to subsidize development and publicity for Bielefeld by the city council, it still has a solid reputation for obscurity.
Our analysis shows that the city of Bielefeld consists of three structurally different components loosely tied together by just a few principal routes. Being founded in 1214 by Hermann IV, the Count of Ravensberg, the compact city guarded a pass crossing the Teutoburger Forest. In 1847, the new Cologne-Minden railway had passed through Bielefeld establishing the new urban development apart from the historical core of the major city - the Bahnhofsviertel governed mostly by the linear structure of the rail road. Finally, during the industrial revolution, the modern city quarters had been constructed by the end of the 19th century. These city districts built in accordance with different development principles and in different historical epochs are strikingly dissimilar in structure. Walkers in our model were mostly confined in each city domain experiencing difficulty while alternating that. Not surprisingly, most Germans have a vague image of the city in their heads. The threefold structure of Bielefeld would make the city center extremely vulnerable to proliferation of growth problems.
9 Conclusion and Discussion
We assumed that spatial experience in humans intervening in the city may be organized in the form of a universally acceptable network. We also assumed that the frequently travelled routes are nothing else but the ”projective invariants” of the given layout of streets and squares in the city – the function of its geometrical configuration, which remains invariant whatever origin-destination route is considered.
Basing on these two assumptions, we have developed a method that allows to capture a neighborhood’s inaccessibility. Any finite undirected graph can be interpreted as a discrete time dynamical system with a finite number of states. The temporal evolution of such a dynamical system is described by a ”dynamical law” that maps vertices of the graph into other vertices and can be interpreted as the transition operator of random walks. The level of accessibility of nodes and subgraphs of undirected graphs can be estimated precisely in connection with random walks introduced on them. We have applied this method to the structural analysis of different cities.
The main motivation of our work was to get an insight into the structure of human settlements that would improve the overall strategy of investments and planning and avoid the declining of cities as well as the many environmental problems. Multiple increases in urban population that had occurred in Europe at the beginning of the 20th century have been among the decisive factors that changed the world. Urban agglomerations had suffered from the co-morbid problems such as widespread poverty, high unemployment, and rapid changes in the racial composition of neighborhoods. Riots and social revolutions have occurred in urban places in many European countries in part in response to deteriorated conditions of urban decay and fostered political regimes affecting immigrants and certain population groups de facto alleviating the burden of the haphazard urbanization by increasing its deadly price: tens of millions of people had emigrated from Europe, but many more of them had died of starvation and epidemic diseases, or became victims of wars and political repressions.
Urbanization has been the dominant demographic trend in the entire world, during the last half century. Although the intense process of urbanization is a proof of economic dynamism, clogged roads, dirty air, and deteriorating neighborhoods are fuelling a backlash against urbanization that nevertheless cannot be stopped. The urban design decisions made today on the base of the US car-centered model, in cities of the developing world where car use is still low, will have an enormous impact on climate changes in the decades ahead. Unsustainable pressure on resources causes the increasing loss of fertile lands through degradation and the dwindling amount of fresh water and food would trigger conflicts and result in mass migrations. Migrations induce a dislocation and disconnection between the population and their ability to undertake traditional land use, [32]. Major metropolitan areas and the intensively growing urban agglomerations attract large numbers of immigrants with limited skills. Many of them will end up a burden on the state, and perhaps become involved in criminal activity. The poor are urbanizing faster than the population as a whole, [33]. Global poverty is in flight becoming a primarily urban phenomenon in the developing world: about 70% of 2 bln new urban settlers in the next 30 years will live in slums, adding to 1 bln already there. The essential attention should be given to the cities in the developing world where the accumulated urban growth will be duplicated in the next 25 years. The fastest urbanization of poverty occurred in Latin America, where the majority of the poor now live in urban areas.
Faults in urban planning, poverty, redlining, immigration restrictions and clustering of minorities dispersed over the spatially isolated pockets of streets trigger urban decay, a process by which a city falls into a state of disrepair. The speed and scale of urban growth require urgent global actions to help cities prepare for growth and to avoid them of being the future epicenters of poverty and human suffering.
People of modern Europe prefer to live in single-family houses and commute by automobile to work. In 10 years (1990-2000), low-density expansions of urban areas known as ’urban sprawl’ consumed more than 8,000 in Europe, the entire territory of the state of Luxembourg. Residents of sprawling neighborhoods tend to emit more pollution per person and suffer more traffic fatalities. Faults in planning of urban sprawl neighborhoods would force the structural focus of the city out from its historical center and trigger the process of degradation in that.
Together with severe environmental problems generated by the unlimited expansion of the city, the process of urban degradation creates dramatic economic and social implications, with negative effects on the urban economy. It is well known that degraded urban areas are less likely to attract investments, new enterprises and services, but become attractive for socially underprivileged groups because of a tendency of reduction house prices in the urban core. Smart growth policies that concentrate the future urban development in the center of the city to avoid urban sprawl should be applied.
Our last but not least remark is that sprawling suburbs in USA saw by far the greatest growth in their poor population and by 2008 had become home to the largest share of the nation’s poor. Between 2000 and 2008, sprawls in the US largest metro areas saw their poor population grow by 25 percent - almost five times faster than primary cities and well ahead of the growth seen in smaller metro areas and non-metropolitan communities. These trends are likely to continue in the wake of the latest downturn, given its toll on the faster pace of growth in suburban unemployment.
A combination of interrelated factors, including urban planning decisions, poverty, the development of freeways and railway lines, suburbanization, redlining, immigration restrictions would trigger urban decay, a process by which a city falls into a state of disrepair. We often think that we have much enough time on our hands, but do we? The need could not be more urgent and the time could not be more opportune, to act now to sustain our common future.
10 Acknowledgement
The authors gratefully acknowledge the financial support by the project MatheMACS (”Mathematics of Multilevel Anticipatory Complex Systems”), grant agreement no. 318723, funded by the EC Seventh Framework Programme FP7-ICT-2011-8.
References
- [1] B. Hillier, J. Hanson, The Social Logic of Space (1993, reprint, paperback edition ed.). Cambridge: Cambridge University Press (1984).
- [2] P. Ortega-Andeane, E. Jiménez-Rosas, S. Mercado-Doménech, and C. Estrada-Rodrýguez, ”Space syntax as a determinant of spatial orientation perception.” Int. J. of Psychology, 40 (1), 11-18 (2005).
- [3] L. Wirth, The Ghetto (edition 1988) Studies in Ethnicity, transaction Publishers, New Brunswick (USA), London (UK) (1928).
- [4] L. Vaughan, ”The relationship between physical segregation and social marginalization in the urban environment.” World Architecture, 185, pp. 88-96 (2005).
- [5] L. Vaughan, D. Chatford, and O. Sahbaz, Space and Exclusion: The Relationship between physical segregation. economic marginalization and poverty in the city, Paper presented to Fifth Intern. Space Syntax Symposium, Delft, Holland (2005).
- [6] S. Orford, D. Dorling, R. Mitchell, M. Shaw & G. Davey-Smith, ”Life and death of the people of London: a historical GIS of Charles Booth’s inquiry.” Health and Place 8 (1), 25-35 (2002).
- [7] Ph. Blanchard, D. Volchenkov, Mathematical Analysis of Urban Spatial Networks, Springer Series Understanding Complex Systems, Berlin / Heidelberg. ISBN 978-3-540-87828-5, 181 pages (2009).
- [8] R.G. Golledge, Wayfinding Behavior: Cognitive Mapping and Other Spatial Processes, John Hopkins University Press, ISBN: 0-8018-5993-X (1999).
- [9] F.E. Pollick, ”The perception of motion and structure in structure-from-motion: comparison of affine and Euclidean formulations”. Vision Research 37 (4), 447-466 (1997).
- [10] B. Hillier, Space is the Machine: A Configurational Theory of Architecture. Cambridge University Press. ISBN 0-521-64528-X (1999).
- [11] W.G. Hansen, ”How accessibility shapes land use.” J. of the Am. Inst. Planners 25, 73 (1959).
- [12] A.G. Wilson, Entropy in Urban and Regional Modeling, Pion Press, London (1970).
- [13] M. Batty, A New Theory of Space Syntax, UCL Centre For Advanced Spatial Analysis Publications, CASA Working Paper 75 (2004).
- [14] A. Penn, ” Space Syntax and Spatial Cognition. Or, why the axial line?” In: J.Peponis, J.Wineman, S.Bafna (eds). Proc. of the Space Syntax International Symposium, Georgia Institute of Technology, Atlanta (2001).
- [15] B. Jiang, C. Claramunt, Topological analysis of urban street networks. Environment and Planning B: Planning and Design 31, 151, Pion Ltd. (2004).
- [16] D. Volchenkov, Ph. Blanchard, ”Random Walks Along the Streets and Channels in Compact Cities : Spectral analysis, Dynamical Modularity, Information, and Statistical Mechanics”, Phys. Rev. E 75, 026104 (2007).
- [17] D. Volchenkov, Ph. Blanchard, Scaling and Universality in City Space Syntax: between Zipf and Matthew. Physica A 387(10), 2353 ( 2008), doi:10.1016/j.physa.2007.11.049.
- [18] E. Prisner, Graph Dynamics, Boca Raton (FL): CRC Press (1995).
- [19] G.E. Shilov, B.L. Gurevich, Integral, Measure, and Derivative: A Unified Approach, Richard A. Silverman (trans. from Russian), Dover Publications (1978).
- [20] M.C. Mackey, Time’s Arrow: The Origins of Thermodynamic Behavior, Springer (1991).
- [21] L. Lovász, ”Random Walks On Graphs: A Survey.” Bolyai Society Mathematical Studies 2: Combinatorics, Paul Erdös is Eighty, 1-46 Keszthely (Hungary) (1993).
- [22] L. Lovász, P. Winkler, Mixing of Random Walks and Other Diffusions on a Graph. Surveys in combinatorics, Stirling, pp. 119-154 London Math. Soc. Lecture Note Series 218, Cambridge Univ. Press (1995).
- [23] Ph. Blanchard, D. Volchenkov, Introduction to Random Walks on Graphs and Databases, Springer Series in Synergetics 10, Berlin / Heidelberg ISBN 978-3-642-19591-4, http://dx.doi.org/10.1007/978-3-642-19592-1 (2011).
- [24] L. Wirth, The Ghetto (edition 1988) Studies in Ethnicity; Transaction Publishers, New Brunswick (USA), London (UK) (1928).
- [25] L. Vaughan, ”The relationship between physical segregation and social marginalisation in the urban environment.” World Architecture, 185, 88 (2005).
- [26] L. Vaughan, D. Chatford & O. Sahbaz Space and Exclusion: The Relationship between physical segregation. economic marginalization and povetry in the city, Paper presented to Fifth Intern. Space Syntax Symposium, Delft, Holland (2005).
- [27] B. Hillier, The common language of space: a way of looking at the social, economic and environmental functioning of cities on a common basis, Bartlett School of Graduate Studies, London (2004).
- [28] R.P. Bolton, Building For Profit. Reginald Pelham Bolton (1922).
- [29] E.L. Glaeser, J. Gyourko, Why is Manhattan So Expensive? Manhattan Institute for Policy Research, Civic Report 39 (2003).
- [30] A. Portes, R.G. Rumbaut. Immigrant America: A Portrait. (3-rd edition), University of California Press, (2006).
- [31] H. Kimon, Religion and New Immigrants: A Grantmaking Strategy at The Pew Charitable Trusts. Religion Program, the Pew Charitable Trusts (2001).
- [32] M. Fisher, ”Urban ecology”. Permaculture Design course handout notes available at www.self-willed-land.org.uk (2008).
- [33] M. Ravallion, ”Urban Poverty.” Finance and Development 44 (3) (2007).