Dispersive line shape in the vicinity of the quantum Hall state:
Coexistence of Knight shifted and unshifted RDNMR responses
Abstract
The frequency splitting between the dip and the peak of the resistively detected nuclear magnetic resonance (RDNMR) dispersive line shape (DLS) has been measured in the quantum Hall effect regime as a function of filling factor, carrier density and nuclear isotope. The splitting increases as the filling factor tends to and is proportional to the hyperfine coupling, similar to the usual Knight shift versus -dependence. The peak frequency shifts linearly with magnetic field throughout the studied filling factor range and matches the unshifted substrate signal, detected by classical NMR. Thus, the evolution of the splitting is entirely due to the changing Knight shift of the dip feature. The nuclear spin relaxation time, , is extremely long (hours) at precisely the peak frequency. These results are consistent with the local formation of a phase due to the existence of spin singlet complexes.
pacs:
73.43.Fj, 76.60.-kResistively detected nuclear magnetic resonance (RDNMR) is well-established technique to probe the interaction between nuclear and electronic spin systems via the contact hyperfine interaction. For the investigation of two-dimensional electron gases (2DEGs), RDNMR has significantly increased sensitivity with respect to classical NMR, as it only probes nuclei which have significant overlap with the electronic wave function. Historically, RDNMR was developed to demonstrate the role played by nuclear spins in the formation of a huge longitudinal resistance spike at filling factor Kronmüller et al. (1999) and has since proved to be a formidable tool to investigate quantum Hall physics. Desrat et al. (2002); Stern et al. (2004); Masubuchi et al. (2006); Kodera et al. (2006); Tracy et al. (2007); Guo et al. (2010); Zhang et al. (2007); Dean et al. (2009); Kawamura et al. (2009); Bowers et al. (2010); Yang et al. (2011); Tiemann et al. (2012); Stern et al. (2012)
In particular, attention has been focussed on the QH state following the observation of an unexpected dispersive line shape (DLS). Desrat et al. (2002) A strong coupling of nuclear spins to low-energy (gapless) excitations of the many body quantum Hall ground state in the vicinity of was invoked to explain the anomalous resonance shape. Notably, to explain the unusually short nuclear spin relaxation times observed, it was suggested that a coupling occurs with the Goldstone modes of a skyrme crystal. However, in later investigations the DLS was detected at under unfavorable conditions for the formation of skyrmions. Bowers et al. (2010) It is now evident that skyrmions alone cannot account for the DLS and indeed a coherent description of the origin of the dispersive line shape is still lacking. Thermal effects have been put forward by Tracy et al. to explain the coincidence between the DLS shape inversion and the sign change. Tracy et al. (2006) Separate mechanisms for the dip and peak components have been proposed, since they show different behaviors versus filling factor Kodera et al. (2006) and respond differently to dc-current. Dean et al. (2009) Recently, the frequency splitting between the dip and the peak of the DLS, at a constant filling factor, was shown to increase linearly versus the magnetic field in the T range. Bowers et al. (2010)
Here we report on the systematic investigation of dispersive line shapes around as a function of filling factor, electron density, and nuclear isotope for three different samples at mK temperatures. The frequency splitting between the dip and peak resonances in the magnetoresistance is shown to increase as and is proportional to the carrier concentration and the hyperfine interaction. More precisely, we demonstrate the peak frequency shifts linearly with magnetic field and coincides with the response of nuclei which are not coupled to a polarized electronic system, obtained by classical NMR. In contrast, the dip feature shows significant deviation from linearity reflecting the variation of the polarization of the electronic system (Knight shift). Extremely long nuclear spin relaxation times ( hr) are also measured at the peak frequency consistent with the local formation of a (unpolarized) phase due to the existence of spin singlet complexes.
RDNMR has been performed on three GaAs/AlGaAs heterojunctions patterned into Hall bars. The carrier densities and mobilities are , and cm-2 and , and cm2V-1s-1 for samples (NRC 1707), (NRC V0050) and (NU 2077) respectively.not (a) Each device was placed in the mixing chamber of a dilution fridge with a base temperature of mK. The radio-frequency (RF) field was applied by means of a copper coil wound around the sample and connected to an RF-synthesizer by a rigid coaxial cable. The typical RF power used was around dBm, which gives a significant RDNMR signal while avoiding excessive heating (the electron temperature is estimated to be mK). All resistive measurements were performed using a lock-in amplifier with an ac driving current of nA at Hz.
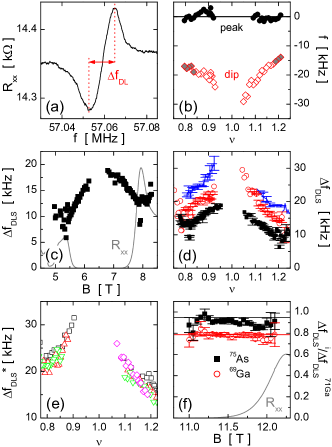
Figure 1(a) shows a typical RDNMR dispersive line measured for 75As at T () with an RF sweep rate Hz/s. The DLS, which is characterized by a resistance dip followed by a peak at higher radio frequency, is observed on both sides of for all three samples. Successive RDNMR spectra have been recorded at several magnetic fields under the same temperature and RF sweep rate conditions. The nuclear resonant frequency is given by , where is the nuclear gyromagnetic ratio and the effective electronic field seen by the nucleus due to the contact hyperfine interaction. A close inspection reveals that the peak response shifts linearly with magnetic field suggesting that it is not influenced by the polarization of the electronic system. Assuming that the influence of is negligible for the peak response, the Larmor frequency can be subtracted from the RDNMR data, by fitting a linear dependence to the peak resonance frequency versus . not (b) The frequency positions of the DLS peak and dip from which the Larmor frequency has been subtracted are plotted in Fig. 1(b) as a function of the filling factor for sample . We observe that the peak frequency remains constant throughout the filling factor range. In contrast, the dip frequency is shifted to lower frequencies as tends to one from either above or below. We should stress that the detection of the RDNMR deep into the quantized regime (QHE regime of dissipationless magnetoresistance, see Fig. 1(c)) was made possible by applying increasing dc currents (up to A), as described by Dean et al.. Dean et al. (2009) The closed diamonds in Fig. 1(b) represent data obtained without dc current far from .
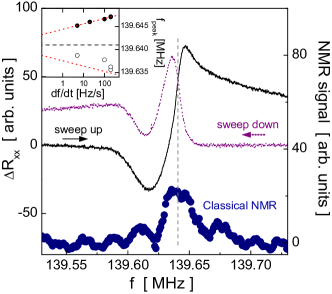
The very different dependence of the peak and dip frequencies upon the filling factor suggests they originate from different NMR responses. Dean et al. (2009) In order to confirm this point, classical NMR has been performed on sample . Figure 2 shows the Fourier transform of the free induction decay signal of 71Ga nuclei obtained by classical NMR and RDNMR performed at exactly the same magnetic field. The peak of the NMR signal indicates the resonant frequency of the majority nuclei in the sample, i.e. those in the undoped barriers and substrate, which are not coupled to conduction electrons. In contrast, the RDNMR signal is only sensitive to the nuclei which are in contact with the wave function of the 2DEG. These nuclei will feel the spin polarization of the 2DEG and their NMR frequency should be Knight shifted accordingly. The peak position of the RDNMR line for the RF upsweep occurs at a higher frequency than for the RF downsweep, but this discrepancy reduces as the RF sweep rate becomes slower. The inset of Fig. 2, which plots the DLS peak position for up and down sweeps as a function of the RF sweep rate, suggests the peak positions will converge to the reference NMR frequency for an experimentally unrealistic sweep rate of 10 mHz/s. Thus, the peak response originates from nuclei which are in contact with the 2DEG, but nevertheless see zero electronic polarization () over a wide range of filling factors.
The frequency splitting of the dispersive line, , i.e. the absolute difference between the dip and peak frequencies; plotted in Fig. 1(a); was found to be perfectly reproducible for a given constant RF sweep rate. Figure 1(c) shows that increases when the filling factor tends to from either above or below. In Fig. 1(d), is plotted vs for all three samples. They all exhibit a similar behavior, which is reminiscent of the Knight shift plots obtained previously by optically pumped NMR and standard NMR with multiple-quantum-well samples. Barrett et al. (1995); Melinte et al. (2001) The Knight shift is proportional to the electron spin polarization and the hyperfine coupling which can be written . In two dimensions, it has to be corrected by the factor , where is the 2DEG width. In Fig. 1(d), the absolute value of is larger for higher density 2DEGs, which is in qualitative agreement with the above picture. A quantitative comparison cannot be performed as the extent of the 2DEG electronic wave functions are not precisely known.
For sample we have also measured the frequency splitting as a function of the 2DEG density , which was modified by successive in situ illuminations with an infrared LED, using the persistent photo-conductivity effect. Fig. 1(e) shows the frequency splitting multiplied by the density ratio for densities , , and cm-2 (squares, up and down triangles, and diamonds resp.). The superimposition of all the data sets confirms that as for a Knight shift, the DLS frequency splitting is proportional to the electron density. Finally, the ratio of the frequency splitting of the 75As and 69Ga isotopes in respect of for 71Ga are plotted in Fig. 1(f), for the high magnetic field flank of (sample ). We see that for each nuclear species the ratio is almost constant over the measured field range, i.e. () for 75As(69Ga), in agreement within with the expected values ( and resp.).not (c) To summarize, Figs. 1(d-f) demonstrate unambiguously that the DLS frequency splitting depends on the filling factor , the electron density and the hyperfine interaction , in exactly the same way as the Knight shift. Note that the measured frequency splittings range within kHz, which agree well the expected hyperfine splittings in 2DEGs, scaled by the factor.
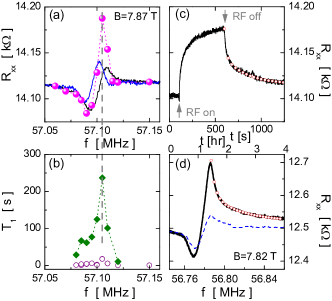
The fact that the frequency position of the DLS peak remains constant versus filling factor around and matches the classical NMR reference frequency demonstrates unequivocally that it reflects the response of nuclei which although in contact with the 2DEG feel no nett polarization of the electronic system. To further probe this state, we have measured the transient resistance when the RF is switched on and off, throughout the DLS resonance (see Ref.Desrat et al. (2002) for details of this technique). The resistance transient during an RF on/off sequence is plotted in Fig. 3(c). The frequency used here is MHz, which corresponds to the resonant frequency of the DLS peak for T (Fig. 3(a)). When the RF is switched on, the resistance first increases rapidly and then drifts slowly without ever reaching a steady state on an experimentally viable timescale (several hours). This behavior is distinctive of frequencies close to the peak feature. For other frequencies and under the same experimental conditions, the resistance always saturates. Similar observations were reported by Kodera et al., who found long relaxation time scales for the DLS peak. Kodera et al. (2006)
The resistance relaxation, after the RF is switched off, is well fitted by a double exponential (symbols in Fig. 3(c)). Both slow and fast nuclear spin relaxation times extracted from these fits are plotted in Fig. 3(b). It is evident that the slow shows a sharp maximum at MHz which is exactly the DLS peak position indicated on the figure by the vertical dashed line. The involvement of an extremely slow process is further confirmed by the dispersive line recorded at a very low RF-sweep rate ( Hz/s) plotted in Fig. 3(d). The total scan duration is 4 hours (top axis). Assuming that the return to equilibrium is mainly limited by , the double exponential resistance relaxation, above the peak frequency, leads to a characteristic time of the order of hr. In addition, it is interesting to note that the DLS with an RF-sweep rate of Hz/s (dashed line) has a frequency splitting almost equal to the DLS recorded with a times slower sweep rate. This justifies a posteriori the choice of an intermediate sweep rate of Hz/s for the measurement of the frequency splittings presented in Fig. 1.
Thus, the dispersive line shape should be understood as the NMR responses of nuclei interacting with two electron subsystems of the 2DEG. The dip corresponds to the Knight shifted resonance of nuclei coupled to partially spin polarized electrons. The observed shift is peaked at filling factor for which the polarization of the 2DEG is a maximum. The fast nuclear spin relaxation times observed imply that the electron system has low energy spin excitations which favors nuclear spin relaxation via the flip-flop process in which energy has to be conserved. The Korringa law predicts that is proportional to the density of spin up and spin down states at the Fermi energy which precludes the presence of a significant spin gap in the electronic system. Within a single electron picture, on both sides of filling factor , the Fermi energy lies in a partially occupied spin Landau level and an electronic spin excitation requires an energy which is orders of magnitude larger than the nuclear spin flip energy. However, the physics in the vicinity of filling factor is known to be extremely rich with the possibility to form spin reversed ground states i.e. spin textures such as skyrmions which are thought to have considerably smaller gaps for electronic spin flip excitations Desrat et al. (2002). The single electron picture also predicts that the 2DEG should be completely polarized for filling factors below . In reality many body physics dominates and it is experimentally well established that the electronic polarization collapses rapidly on either side of . Plochocka et al. (2009)
On the other hand, the peak feature of the DLS is the unequivocal signature of a zero Knight shifted NMR of nuclei coupled to an unpolarized 2DEG. For the range of filling factors investigated this is simply not possible for the case of electrons in uniformly occupied Landau levels. Thus, the 2DEG has to form domains with polarized and unpolarized regions. In addition, these domains have to be localized on the time scale of the NMR measurements to prevent the nuclei simply feeling the average spin polarization of the 2DEG. While it would not be surprising that the 2DEG could spontaneously break symmetry to form a novel ground state with the presence of domains, there is actually a much simpler explanation. Recent inelastic light scattering experiments have demonstrated the preponderant role played by complexes in quantum Hall states and the existence of a depolarized electron subsystem at in particular Zhuravlev et al. (2008). These complexes are formed by two electrons of opposite spins bound to a positively charged donor impurity located in the barrier. The electrons remain in the lowest Landau level of the 2DEG and this spin singlet state can be thought of as a local region in which the filling factor is . The electrons are weakly bound and extend over many nuclei with a Bohr radius . Huant et al. (1990) This should be compared with the magnetic length at T. Other electrons in the 2DEG are repelled from both by the Pauli principle and the Coulomb repulsion. At the Fermi energy lies in the cyclotron gap so that Korringa predicts a very long since nuclear spin relaxation can only proceed via slow processes such as nuclear spin diffusion. We note that very recent experimental RDNMR results near filling factor have revealed a reduced Knight shift, as well as long relaxation times and were interpreted as the formation of an electron solid phase. Rhone et al. (2013)
To conclude, the splitting of the peak and dip features of the dispersive line shape RDNMR signal in the vicinity of can be used to determine the Knight shift and thus the spin polarization of the 2DEG. Classical NMR confirms that the peak feature, which originates from nuclei in contact with an unpolarized phase of the 2DEG, provides a convenient relative zero Knight shift reference signal.
References
- Kronmüller et al. (1999) S. Kronmüller, W. Dietsche, K. v. Klitzing, G. Denninger, W. Wegscheider, and M. Bichler, Phys. Rev. Lett. 82, 4070 (1999).
- Desrat et al. (2002) W. Desrat, D. K. Maude, M. Potemski, J. C. Portal, Z. R. Wasilewski, and G. Hill, Phys. Rev. Lett. 88, 256807 (2002).
- Stern et al. (2004) O. Stern, N. Freytag, A. Fay, W. Dietsche, J. H. Smet, K. von Klitzing, D. Schuh, and W. Wegscheider, Phys. Rev. B 70, 075318 (2004).
- Masubuchi et al. (2006) S. Masubuchi, K. Hamaya, and T. Machida, Appl. Phys. Lett. 89, 062108 (2006).
- Kodera et al. (2006) K. Kodera, H. Takado, A. Endo, S. Katsumoto, and Y. Iye, Phys. Status Solidi C 3, 4380 (2006).
- Tracy et al. (2007) L. A. Tracy, J. P. Eisenstein, L. N. Pfeiffer, and K. W. West, Phys. Rev. Lett. 98, 086801 (2007).
- Guo et al. (2010) G. P. Guo, X. J. Hao, T. Tu, Y. J. Zhao, Z. R. Lin, G. Cao, H. O. Li, C. Zhou, G. C. Guo, and H. W. Jiang, Phys. Rev. B 81, 041306 (2010).
- Zhang et al. (2007) X. C. Zhang, G. D. Scott, and H. W. Jiang, Phys. Rev. Lett. 98, 246802 (2007).
- Dean et al. (2009) C. R. Dean, B. A. Piot, G. Gervais, L. N. Pfeiffer, and K. W. West, Phys. Rev. B 80, 153301 (2009).
- Kawamura et al. (2009) M. Kawamura, M. Ono, Y. Hashimoto, S. Katsumoto, K. Hamaya, and T. Machida, Phys. Rev. B 79, 193304 (2009).
- Bowers et al. (2010) C. R. Bowers, G. M. Gusev, J. Jaroszynski, J. L. Reno, and J. A. Simmons, Phys. Rev. B 81, 073301 (2010).
- Yang et al. (2011) K. F. Yang, H. W. Liu, K. Nagase, T. D. Mishima, M. B. Santos, and Y. Hirayama, Appl. Phys. Lett. 98, 142109 (2011).
- Tiemann et al. (2012) L. Tiemann, G. Gamez, N. Kumada, and K. Muraki, Science 335, 828 (2012).
- Stern et al. (2012) M. Stern, B. A. Piot, Y. Vardi, V. Umansky, P. Plochocka, D. K. Maude, and I. Bar-Joseph, Phys. Rev. Lett. 108, 066810 (2012).
- Tracy et al. (2006) L. A. Tracy, J. P. Eisenstein, L. N. Pfeiffer, and K. W. West, Phys. Rev. B 73, 121306 (2006).
- not (a) Samples and were originally grown at Institute for Microstructural Sciences, National Research Council, Ottawa K1A 0R6, Canada.
- not (b) The external magnetic field was additionally calibrated using an 27Al reference placed below the sample.
- Barrett et al. (1995) S. E. Barrett, G. Dabbagh, L. N. Pfeiffer, K. W. West, and R. Tycko, Phys. Rev. Lett. 74, 5112 (1995).
- Melinte et al. (2001) S. Melinte, N. Freytag, M. Horvatić, C. Berthier, L. P. Lévy, V. Bayot, and M. Shayegan, Phys. Rev. B 64, 085327 (2001).
- not (c) The gyromagnetic ratios, measured from the slope of the experimental plots, equal to , and MHz/T for 75As, 69Ga and 71Ga respectively. The values are taken from Ref.Paget et al. (1977).
- Plochocka et al. (2009) P. Plochocka, J. M. Schneider, D. K. Maude, M. Potemski, M. Rappaport, V. Umansky, I. Bar-Joseph, J. G. Groshaus, Y. Gallais, and A. Pinczuk, Phys. Rev. Lett. 102, 126806 (2009).
- Zhuravlev et al. (2008) A. S. Zhuravlev, A. B. Van’kov, L. V. Kulik, I. V. Kukushkin, V. E. Kirpichev, J. H. Smet, K. v. Klitzing, V. Umansky, and W. Wegscheider, Phys. Rev. B 77, 155404 (2008).
- Huant et al. (1990) S. Huant, S. P. Najda, and B. Etienne, Phys. Rev. Lett. 65, 1486 (1990).
- Rhone et al. (2013) T. D. Rhone, L. Tiemann, and K. Muraki, in Proceedings of EP2DS-20 (to be edited) (Wrocław, Poland, 2013).
- Paget et al. (1977) D. Paget, G. Lampel, B. Sapoval, and V. I. Safarov, Phys. Rev. B 15, 5780 (1977).