C-E. Rydberg
Metal-free galaxy candidates discovered in CLASH
Abstract
The first metals in the universe are expected to form in population III stars – primordial stars consisting entirely of hydrogen and helium. However, these stars have so far remained elusive. Simulations indicate that galaxies consisting exclusively, or almost exclusively, of population III stars may form at , and such galaxies may provide one of the best probes of the properties of the population III star formation mode. By fitting Yggdrasil model spectra to multiband photometry data, we have identified four population III galaxy candidates in the Cluster Lensing and Supernova survey with Hubble (CLASH). We rule out alternative mundane galaxies and low redshift interlopers through similar fits to catalogs of spectra from more mundane objects. If confirmed through spectroscopy, this would constitute the first detection of the “missing link” between the early pristine universe and the metal-enriched universe.
keywords:
Galaxy: abundances – Galaxies: photometry – Cosmology: observations – Infrared: galaxies1 Introduction
Simulations (e.g. Bromm & Larson, 2004) of the very first population III stars indicate that they formed in pristine mini-halos ( M⊙) at . The stars are predicted to form as binary stars or small clusters (e.g Stacy et al., 2010; Prieto et al., 2011; Clark et al., 2011; Greif et al., 2011; Stacy et al., 2012; Bromm, 2013; Hirano et al., 2013) with mass of a few times 10 M⊙. However, this first generation of population III stars are not likely to be detected even with the James Webb Space Telescope (Rydberg et al., 2013).
Chemically pristine dark matter halos may survive until much lower redshifts (Stiavelli & Trenti, 2010; Fumagalli et al., 2011) leading to population III galaxy formation at . Since there are no clear-cut detections of population III galaxies yet (but see e.g. Inoue et al. (2011); Zackrisson et al. (2011a); Kashikawa et al. (2012) for tantalizing candidates), their properties and possible observational signatures are highly uncertain. A lack of metal-lines are predicted (Schaerer, 2003; Raiter et al., 2010; Inoue, 2011; Zackrisson et al., 2011b), especially the strong [OIII] (5007 ) line. Models also predict a strong HeII (1640 ) line and a steep UV slope (e.g. Inoue et al., 2011; Zackrisson et al., 2011b). The intrinsic Ly line is also predicted to be very strong (e.g. Zackrisson et al., 2011a). The Ly line is resonant and prone to scattering in the IGM and absorption of dust in the ISM (Hayes et al., 2010). However, it is plausible to assume that population III galaxies contain no dust since they lack metals to form dust. If a sufficient fraction Ly-photons also escape the IGM scattering (if, for example, a sufficiently large volume around the galaxy is ionized so the photons become sufficiently redshifted before encountering neutral hydrogen in the IGM), a strong Ly-line could constitute a signature of population III galaxies (Zackrisson et al., 2011a). At , the Gunn-Peterson trough (Gunn & Peterson, 1965) absorbs radiation with wavelength below Ly. This follows from Ly-scatter in the neutral IGM. Using this effect, the redshift of objects can be determined by examining in what filters (and thereby at what wavelength) an object is detected. This is the so-called Lyman-break technique.
Simulations indicate population III galaxies to be low-mass objects (Stiavelli & Trenti, 2010) and thereby faint. However, the magnification associated with gravitational lensing improves the prospects of detection significantly (Zackrisson et al., 2012). The Cluster Lensing and Supernova survey with Hubble (CLASH) observes gravitational lenses in the form of galaxy clusters and is therefore ideal for this purpose. This survey maps their dark-matter distribution but also tries to find gravitationally lensed high-redshift galaxies (Postman et al., 2012). We have fitted population III galaxy models as well as comparison empirical/synthetic models to CLASH observations to discover population III galaxies. Here we present the discovery of four candidates in different clusters. The focus on the proceedings will be on the candidate found in RXJ 1347.
2 Method
The CLASH data consists of broadband photometry for 25 galaxy clusters in 16-17 filters, covering a wavelength range of 2,000 – 17,000 Å. The results are supplied as FITS images as well as catalogs of objects identified with Sextractor (Bertin & Arnouts, 1996). We have used 21 of these official catalogs, containing a total of 44,784 objects.
To model the population III galaxies we use Yggdrasil (Zackrisson et al., 2011b), a spectral synthesis model which combines stellar population spectral energy distributions (SEDs) with the SED of the surrounding nebula to construct the total SED of the first galaxies. It uses several parameters (age, time of starburst forming the galaxy etc). We also use the combined escape fraction of Ly through both the ISM and IGM () as a parameter.
We use two model grids containing mundane objects as comparison models. Gissel (Bruzual & Charlot, 2003) is a commonly used grid of synthetic models. The second is the CWW, Kinney grid (Arnouts et al., 1999). It is based on empirical spectra, but extrapolated into the infrared by models.
To fit the observations to the models we first use the Le Phare (Ilbert et al., 2006) code. The code is fast and provides us with a simple -fit of the observations to the models. The is used to provide a rough scan of the observations to find a smaller set of potential candidates. We then use cross-validation (Singh, 1981) on this smaller set. Cross-validation is a maximum-likelihood method producing a likelihood value for each fit. To perform cross-validation on an observation one filter is removed at a time. A -fit is then calculated on the values in the remaining filters. The fit of the model then predicts a value for the missing filter. By comparing this value to the observed value in the filter a prediction error can be estimated. By repeating this for all filters, using a normal-distribution, a maximum likelihood value can be constructed for the observation. This cross-validation procedure together with closer examination of the FITS images is then used to filter the set of potential candidates.
3 Results
We used the procedure described in Section 2 to filter the 44,784 objects from the official catalogs. As a result of this we arrived at four candidates, one each in the clusters RXJ 1347, Abell 2261, MACS 1931, and MACS 0647. Table 1 displays data for the four candidates. As can be seen in the table they have redshift estimates between 6.3 and 8.8. The lower limits of magnification is between 1.3 and 5.7 while the estimate for the Abell 2261 candidate is 8.1. The lower estimates are found by using estimates from Bradley et al. (2013) on galaxies that are further from the critical line than the candidates, thus they are expected to have a lower magnification. The candidate in Abell 2261 is actually one of the objects published in Bradley et al. (2013) providing us with an estimate. The estimates of the Ly escape fractions vary between 40 to 80 % but are very uncertain.
| Cluster | |||
|---|---|---|---|
| RXJ 1347 | |||
| Abell 2261 | |||
| MACS 1931 | |||
| MACS 0647 |
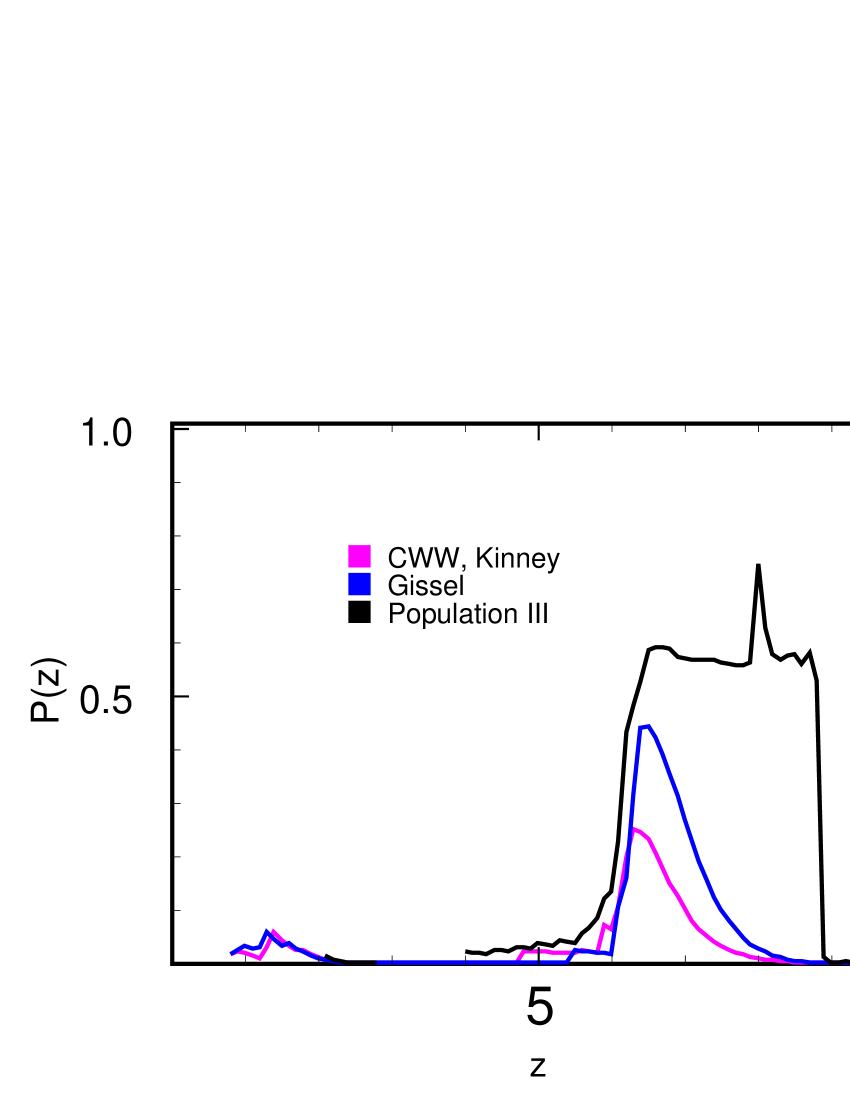
All of the four candidates have cross-validation fits that are significantly better than the comparison models for mundane galaxies. Concentrating on the candidate in RXJ 1347 the fit as a function of redshift is displayed in Figure 1. There is a quite broad range with good fit for between and with a sharp peak at . The comparison models generally have much worse fits even though there are a peak around where at least a Gissel model fits rather well.
The Figure 2 shows thumbnail images of the candidate in RXJ 1347. The eight filters in CLASH covering the longest wavelengths are used, ranging from 6,500 (F775W) to 17,000 (F160W). The Lyman-break is clearly visible between F850LP and F105W since the object is observed in F105W but not in F850LP. In the filters F110W (which contains the most significant detection with S/N=8.3) to F160W the galaxy appears slightly distorted, seemingly stretched from upper right to lower left. This could imply gravitational lensing with high magnification.


4 Conclusion
By fitting the observations from CLASH to models of population III galaxies and mundane comparison galaxies we have extracted four population III galaxy candidates. Three of the candidates are the first population III galaxy candidates discovered. The candidate in RXJ 1347 also show signs of being gravitationally lensed by being slightly distorted. However, the parameter dependence of the population III grid needs to be explored more thoroughly. The escape fraction of Ly photons, where a very uncertain estimate is provided in this proceeding, needs more examination. More precise magnification estimates should also be derived. This together with a careful examination of the cross-validation results should provide us with estimates of the mass of the candidates. And finally, the same procedure should be used on the four clusters in CLASH we have not examined yet.
Acknowledgements.
CER acknowledge funding from the Swedish National Space Board and the Royal Swedish Academy of Sciences.References
- Arnouts et al. (1999) Arnouts, S., Cristiani, S., Moscardini, L., et al. 1999, MNRAS, 310, 540
- Bertin & Arnouts (1996) Bertin, E. & Arnouts, S. 1996, A&AS, 117, 393
- Bradley et al. (2013) Bradley, L. D., Zitrin, A., Coe, D., et al. 2013, (arXiv:1308.1692)
- Bromm (2013) Bromm, V. 2013, Reports on Progress in Physics, 76, 112901
- Bromm & Larson (2004) Bromm, V. & Larson, R. B. 2004, ARA&A, 42, 79
- Bruzual & Charlot (2003) Bruzual, G. & Charlot, S. 2003, MNRAS, 344, 1000
- Clark et al. (2011) Clark, P. C., Glover, S. C. O., Klessen, R. S., & Bromm, V. 2011, ApJ, 727, 110
- Fumagalli et al. (2011) Fumagalli, M., O’Meara, J. M., & Prochaska, J. X. 2011, Science, 334, 1245
- Greif et al. (2011) Greif, T. H., Springel, V., White, S. D. M., et al. 2011, ApJ, 737, 75
- Gunn & Peterson (1965) Gunn, J. E. & Peterson, B. A. 1965, ApJ, 142, 1633
- Hayes et al. (2010) Hayes, M., Östlin, G., Schaerer, D., et al. 2010, Nature, 464, 562
- Hirano et al. (2013) Hirano, S., Hosokawa, T., Yoshida, N., et al. 2013, (arXiv:1308.4456)
- Ilbert et al. (2006) Ilbert, O., Arnouts, S., McCracken, H. J., et al. 2006, A&A, 457, 841
- Inoue (2011) Inoue, A. K. 2011, MNRAS, 415, 2920
- Inoue et al. (2011) Inoue, A. K., Kousai, K., Iwata, I., et al. 2011, MNRAS, 411, 2336
- Kashikawa et al. (2012) Kashikawa, N., Nagao, T., Toshikawa, J., et al. 2012, ApJ, 761, 85
- Postman et al. (2012) Postman, M., Coe, D., Benítez, N., et al. 2012, ApJS, 199, 25
- Prieto et al. (2011) Prieto, J., Padoan, P., Jimenez, R., & Infante, L. 2011, ApJL, 731, L38
- Raiter et al. (2010) Raiter, A., Schaerer, D., & Fosbury, R. A. E. 2010, A&A, 523, A64
- Rydberg et al. (2013) Rydberg, C.-E., Zackrisson, E., Lundqvist, P., & Scott, P. 2013, MNRAS, 429, 3658
- Schaerer (2003) Schaerer, D. 2003, A&A, 397, 527
- Singh (1981) Singh, K. 1981, Ann. Statist., 9, 1187
- Stacy et al. (2010) Stacy, A., Greif, T. H., & Bromm, V. 2010, MNRAS, 403, 45
- Stacy et al. (2012) —. 2012, MNRAS, 422, 290
- Stiavelli & Trenti (2010) Stiavelli, M. & Trenti, M. 2010, ApJL, 716, L190
- Zackrisson et al. (2011a) Zackrisson, E., Inoue, A. K., Rydberg, C.-E., & Duval, F. 2011a, MNRAS, 418, L104
- Zackrisson et al. (2011b) Zackrisson, E., Rydberg, C.-E., Schaerer, D., Östlin, G., & Tuli, M. 2011b, ApJ, 740, 13
- Zackrisson et al. (2012) Zackrisson, E., Zitrin, A., Trenti, M., et al. 2012, MNRAS, 427, 2212