The WISE Catalog of Galactic H II Regions
Abstract
Using data from the all-sky Wide-Field Infrared Survey Explorer (WISE) satellite, we made a catalog of over 8000 Galactic H II regions and H II region candidates by searching for their characteristic mid-infrared (MIR) morphology. WISE has sufficient sensitivity to detect the MIR emission from H II regions located anywhere in the Galactic disk. We believe this is the most complete catalog yet of regions forming massive stars in the Milky Way. Of the cataloged sources, have measured radio recombination line (RRL) or H emission, and are thus known to be H II regions. This sample improves on previous efforts by resolving H II region complexes into multiple sources and by removing duplicate entries. There are candidate H II regions in the catalog that are spatially coincident with radio continuum emission. Our group’s previous RRL studies show that of such targets are H II regions. We find that of these candidates are also positionally associated with known H II region complexes, so the probability of their being bona fide H II regions is even higher. At the sensitivity limits of existing surveys, catalog sources show no radio continuum emission. Using data from the literature, we find distances for catalog sources, and molecular velocities for H II region candidates.
1 INTRODUCTION
H II regions are the zones of ionized gas surrounding young massive stars. The stars capable of producing the ultra-violet photons necessary to ionize their surrounding medium have spectral types of B0 or earlier. Such stars only live Myr and thus H II regions are zero-age objects compared to the age of the Milky Way: they trace star formation at the present epoch. H II regions are the brightest objects in the Galaxy at infrared (IR) and radio wavelengths and can be detected across the entire Galactic disk. Unlike other tracers of Galactic star formation, the identification of an H II region unambiguously locates massive star formation. They are the archetypical tracers of spiral arms and have been instrumental in creating a better understanding of the structure of our Galaxy. Their chemical abundances represent Galactic abundances today, and reveal the effects of billions of years of Galactic chemical evolution. They are the main contributors to the ionized photons in a galaxy, the emission from which is used to determine extragalactic and Galactic star formation rates. In short, Galactic H II regions are extremely important objects for learning about a number of problems in astrophysics, including star formation, Galactic structure, and Galactic evolution.
Despite their importance, the census of Galactic H II regions is severely incomplete, as evidenced by the recent Green Bank Telescope H II Region Discovery Survey (GBT HRDS; Bania et al., 2010; Anderson et al., 2011). The GBT HRDS measured the radio recombination line (RRL) and radio continuum emission from 448 previously unknown Galactic H II regions. Over the survey zone, the GBT HRDS doubled the census of known H II regions with measured RRL emission. The average on-source integration time in the GBT HRDS was only minutes; Anderson et al. (2011) found hundreds more candidate H II regions that would have required longer integrations. This hints at a larger population of Galactic H II regions about which nothing is known.
As the GBT HRDS demonstrated, Galactic H II regions can be easily and reliably identified from mid-infrared (MIR) data. If the resolution of the MIR data is sufficient, all H II regions have essentially the same mid-infrared (MIR) morphology: their emission surrounds their emission and the latter is coincident with the ionized gas traced by radio continuum emission (see Anderson et al., 2011). This characteristic morphology allows one to identify H II region candidates in MIR images. Radio continuum and RRL observations can then confirm that these targets are H II regions. The identification of young H II regions in IR data, where the emission is from heated dust, has motivated much of the H II region research over the past 25 years (e.g. Wood & Churchwell, 1989; Kurtz et al., 1994).
In the GBT HRDS, Anderson et al. (2011) used data from the Spitzer legacy 24 µm MIPSGAL survey (Carey et al., 2009) to identify targets. The Spitzer legacy surveys were generally limited to within of the Galactic mid-plane, and . Most regions of massive star formation are within this Galactic zone, but a complete sample of Galactic regions forming massive stars requires coverage outside the zone surveyed by Spitzer.
Data from the all-sky Wide-Field Infrared Survey Explorer (WISE) can also be used to identify H II regions. WISE covers the entire sky in four photometric bands: 3.4 µm, 4.6 µm, 12 µm, and 22 µm at angular resolutions of 6.1″, 6.4″, 6.5″, and 12″, respectively. H II regions appear visually similar in the WISE 12 µm and 22 µm bands compared with the Spitzer IRAC (Fazio et al., 2004) 8.0 µm and MIPS (Rieke et al., 2004) 24 µm bands, respectively (see Anderson et al., 2012b). For H II regions, the 8.0 µm and 12 µm emission are both largely due to PAH molecules, which fluoresce in ultra-violet radiation fields. The IRAC 8.0 µm band contains strong PAH emission at 7.7 µm and 8.6 µm, whereas the WISE 12 µm band contains PAH emission at 11.2 µm and 12.7 µm (see Tielens, 2008, for a review). The MIPS 24 µm band actually has a very similar bandpass compared with the WISE band. For H II regions this band traces stochastically heated small dust grains (Watson et al., 2008, 2009; Deharveng et al., 2010; Anderson et al., 2012c). The WISE 22 µm band resolution and sensitivity ( and 6 mJy) are comparable to those of MIPSGAL ( and 1.3 mJy).
2 CREATING THE WISE CATALOG OF GALACTIC H II REGIONS
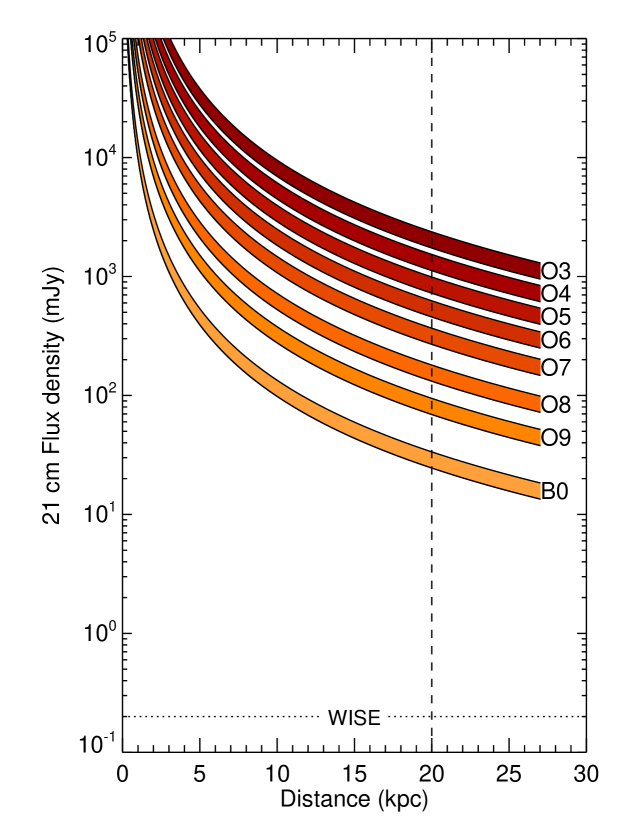
WISE can in principle detect the MIR emission from all Galactic H II regions. Anderson (2010) measured the integrated MIPSGAL flux and 21 cm VLA Galactic Plane Survey (VGPS; Stil et al., 2006) continuum emission from a large sample of 301 first quadrant Galactic H II regions. Using these data, Figure 1 shows that the emission at 21 cm wavelength is times less than that at 24 µm. Anderson et al. (2012b) found that the WISE 22 µm flux of H II regions is the same as the MIPSGAL 24 µm flux. The sensitivity of WISE, 6 mJy at 22 µm, is therefore able to detect H II regions with integrated 21 cm fluxes of mJy. We show in Figure 2 the expected flux for H II regions ionized by single stars of various spectral types. For the calculation of the ionizing flux we used Sternberg et al. (2003) and for the conversion from ionizing flux to 21 cm luminosity we used the relation given in Rubin (1968). The expected 21 cm flux for an H II region at the sensitivity limit of WISE, using the 30:1 ratio found for the ratio of the MIPSGAL to VGPS fluxes, is well below that required to detect the MIR emission from all Galactic H II regions.
This holds true even when extinction is factored into the calculations. Flaherty et al. (2007) find that for Spitzer the extinction at 24 µm is about half that at 2.16 µm ( band). Because the 22 µm WISE filter is similar to the 24 µm Spitzer filter, the 22 µm WISE band will share essentially the same value. The extinction in the band is nominally about a tenth that of visual (Rieke & Lebofsky, 1985). Therefore, and even 50 magnitudes of visual extinction would only result in 2.5 magnitudes of 22 µm extinction. Two and a half magnitudes of extinction corresponds to an intensity decrease of a factor of 10. Even after applying this factor, the WISE sensitivity in Figure 2 is well-below the flux from an H II region ionized by a single B0 star anywhere in the Galaxy. Furthermore, due to the warp of the Galactic disk, the most distant H II regions are generally found above and below the Galactic mid-plane, where the line-of-sight extinction is lower. In sum, the MIR line-of-sight extinction is sufficiently low so that we can detect extremely distant H II regions with WISE.
We use visual and automatic searches of WISE data to identify H II regions from their MIR emission morphology. We visually search WISE 12 µm and 22 µm images spanning the entire Galactic plane within 8 degrees of the nominal mid-plane, . We create WISE 12 µm and 22 µm mosaics using the Montage software111http://montage.ipac.caltech.edu/. The WISE public image tiles are . We combine these tiles into mosaics in longitude, and in latitude, centered on the Galactic plane. Adjacent mosaics overlap in longitude by . Our WISE mosaics collectively cover over the entire range of Galactic longitudes. For both photometric bands, we use a pixel size of . The WISE tiles are individually background corrected so the image tile fluxes are not on an absolute scale. We find that, when making background corrections, the Montage software often introduces large angular-scale () variations in the background level. The quality of the mosaics is nevertheless sufficient for the identification of sites of massive star formation.
To our knowledge, there are only five massive star formation complexes known outside the latitude range of our WISE mosaics (): Mon R2, the California Nebula, Orion, BFS 11, and G159.618.5 in the Perseus molecular cloud. For these regions we create and search WISE mosaics as before and all five are detected by WISE. The California Nebula (Sharpless 220) is a long filamentary structure seen at 12 µm. We include it in the catalog, although its appearance is different from that of most sources. The region G159.618.5 is easily detected with WISE, although it has very weak radio continuum emission in the GB6 survey Gregory et al. (1996). Andersson et al. (2000) also detected weak radio continuum emission from this nebula.
There is no single radio continuum survey covering the entire sky that can be used for this work. Instead, we use a variety of radio continuum surveys, listed in Table 1. Because of the different spatial scales probed by these surveys, it is useful to examine all available radio data, even if these data cover the same Galactic zone. This is especially true in the first Galactic quadrant where there are numerous high-quality surveys. For example, we find that the VGPS is the most sensitive survey extant for extended diffuse emission and is useful for identifying large diffuse H II regions, but MAGPIS 20 cm data (Helfand et al., 2006) boasts a higher angular resolution and point source sensitivity than the VGPS and is useful for identifying ultra-compact (UC) H II regions. We encounter a similar situation in the southern hemisphere with the SGPS and SUMSS data sets. The simultaneous use of both high- and low-resolution radio data produces a more complete catalog.
We examine by eye WISE and radio continuum images spanning the entire Galactic plane, . As in past work (Anderson et al., 2011) we search for radio continuum emission spatially coincident with objects having characteristic MIR morphologies. Each field was searched at least three times by one of us (LDA), in addition to searches by other group members. One of us (LDA) determined if an object identified by one or more group members would be included in the WISE catalog. This method of searching each field multiple times ensures a more complete catalog of H II regions and H II region candidates. For each identified source we store in the catalog the position and approximate radius of a circular aperture that encloses the associated MIR emission. For complicated regions of the Galaxy, we verify that the WISE sources are distinct using the Spitzer GLIMPSE (Benjamin et al., 2003; Churchwell et al., 2009) and MIPSGAL (Carey et al., 2009) legacy data, when possible.
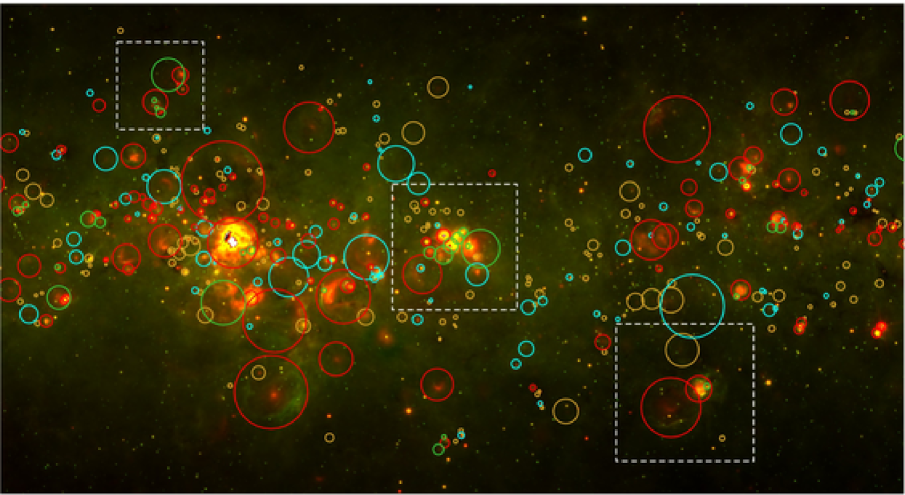
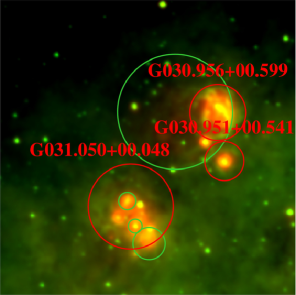
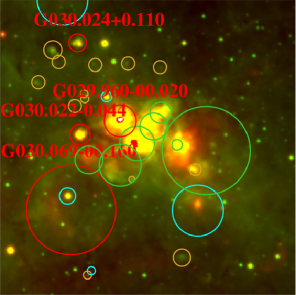
Figure 3 shows our procedure for a portion of the Galaxy centered at = (30°, 0°). The circle sizes in this figure approximate the extent of the MIR emission associated with each source. It is this size that is cited in the catalog. In the inset panels, we label regions observed in RRL emission. In the left inset, G031.050+00.480, G030.956+00.599, and G030.951+00.541 were observed in RRL emission; the other three H II regions in the field are “grouped” H II region candidates that are positionally associated with the three known regions. The procedure of associating H II regions and candidates with one another to create groups is described in Section 3.2. The middle panel shows the well-known G29 H II region complex. Because of the high density of sources in this part of the Galaxy, however, we do not associate the H II region candidate (cyan) towards the southwest of the inset with G29. The right inset shows two H II regions observed in RRLs: a bright compact region (G028.98300.603), and a more diffuse region (G029.09400.713). There is a compact grouped H II region candidate positionally associated with G028.98300.603. To the north is an example of an extended radio quiet candidate, and to the south is an example of a small radio quiet source.
In addition, we perform an automated search for H II region candidates by matching NVSS 20 cm continuum data (Condon et al., 1998) and MAGPIS 20 cm continuum data (Helfand et al., 2006) with WISE point sources. To reduce the number of spurious matches, we only include point sources that have WISE colors (Anderson et al., 2012b, their Table 1) and , where and are the 12 µm and 22 µm WISE fluxes, respectively. This effort only yielded another 20 H II region candidates. This suggests that the visual search alone is sufficient to identify most H II regions and H II region candidates in the Galaxy. Unfortunately, these WISE color criteria cannot reliably distinguish between H II regions and planetary nebulae (PNe). The automated search therefore identified hundreds of PNe candidates, identifiable by their extended latitude distribution and lack of MIR nebulosity. The NVSS does not cover the southern sky but given the marginal results in the northern sky automated search, we did not attempt to repeat the automated search in the south.
Ex post facto we correlate all H II region candidates lacking radio continuum emission in the surveys of Table 1 with the radio continuum observations of Urquhart et al. (2007a, 2009) at 6 cm, Sanchez-Monge et al. (2013) at 3.6 and 1.4 cm, and the “CORNISH” 6 cm VLA survey (Hoare et al., 2012; Purcell et al., 2013). For Urquhart et al. (2007a, 2009) and Sanchez-Monge et al. (2013), we search within radii of and find 45, 10, and 28 matches, respectively. For CORNISH, we visually examine data for sources identified by the CORNISH team as H II regions222http://cornish.leeds.ac.uk/public/index.php. We find 12 matches with WISE sources that were previously identified as having no radio emission or that were in confused areas of the Galaxy. Additionally, we add nine objects identified by CORNISH that we missed in our visual search (all nine are detected in MAGPIS). These nine objects are point sources in the WISE data, which is why they were not initially identified.
PNe and galaxies also have spatially coincident MIR and radio continuum emission so they can contaminate our sample of H II region candidates. PNe typically have very small angular sizes. Their MIR colors are not distinct from those of H II regions (see Anderson et al., 2012b, and references therein). In the second and third Galactic quadrants, external star forming galaxies can look visually similar to Galactic H II regions. In the first and forth quadrants, diffuse background emission in the Galactic plane makes the detection of external galaxies very difficult. We performed a search using the SIMBAD database333http://simbad.u-strasbg.fr/simbad/. on all visually and automatically identified H II regions and candidates whose emission is unresolved in the WISE data, and on all candidates in the second and third Galactic quadrants. These searches were done manually on each such object, and the results were individually verified. This process removed hundreds of H II region candidates that have been identified as PNe or galaxies, especially at high and low Galactic latitudes.
The lack of many external galaxies detected in the first and fourth Galactic quadrants indicates that we may be less complete in the inner Galaxy, due to the increased shot noise from diffuse emission. Kobulnicky et al. (2013) for example find that for background levels of 200 MJy/sr in GLIMPSE 8.0 µm data ( of all GLIMPSE pixel values are higher than this), the data are only complete for point sources between 13th and 14th magnitude (0.4 mJy to 0.15 mJy). We can be sure that WISE has a similar effect. Because the WISE sensitivity limit is nearly 100 times less than that required to detect the faintest H II region in the Galaxy (Figure 2), shot noise probably does not significantly impact our results.
Our catalog may not include all large diffuse H II regions and young hyper-compact H II regions, although we do not believe either has significantly affected the catalog completeness. Large H II regions have low surface brightness. Figure 2, which shows the integrated 22 µm intensity, does not account for resolved low-surface brightness regions. The physical size of an H II region is related to its age, ionizing flux, and nebular density (e.g. Spitzer, 1968). The largest diffuse H II regions must be both near to the Sun and also evolved. Such regions are generally known from H surveys. Confusion in the Galactic plane, however, may limit our ability to detect them. Young hyper-compact H II regions are optically thick at the radio wavelengths used here. All the hypercompact H II region candidates of Sewilo et al. (2004a) are already included in our catalog. Thus, even hypercompact H II regions meet our selection criteria.
3 THE WISE CATALOG OF GALACTIC H II REGIONS
The WISE catalog of Galactic H II regions contains 8399 entries for two types of object: known H II regions and candidate H II regions. There are 1523 sources in the catalog that are known to be H II regions because they have measured RRL or H emission (hereafter the “known” sample). There are 1986 candidate H II regions in the catalog that are spatially coincident with radio continuum emission, but do not yet have any RRL or H observations (hereafter the “candidate” sample). Our group’s previous RRL studies show that of such targets are H II regions. We find that 650 of these candidates are also positionally associated with known H II region complexes, so the probability of their being bona fide H II regions is even higher (hereafter the “group” sample). At the sensitivity limits of existing surveys, 4124 catalog sources show no radio continuum emission (hereafter the “radio quiet” sample). There are an additional 115 objects that lack high quality radio continuum data.
We give the WISE catalog of Galactic H II regions in Table The WISE Catalog of Galactic H II Regions. The first seven columns list parameters derived from our searches: the source name, the classification (“K” for known, , “G” for group, “C” for candidate, “Q” for radio quiet, and “?” for sources without radio data), the Galactic longitude, the Galactic latitude, the approximate circular radius in arcseconds required to encircle the WISE MIR emission, the H II region name, if known, and the H II region group membership name (see Section 3.2). The next seven columns give the parameters of the RRL or H observations: the Galactic longitude and latitude of the observations, the LSR velocity and its error, the FWHM line width and its error, and the reference. If there are multiple line components measured for a source, the multiple values for the LSR velocity and FWHM line width are separated with a semicolon.
The group membership column of Table The WISE Catalog of Galactic H II Regions contains values not only for group H II region candidates, but also for known H II regions in the group, and any radio quiet sources that are also positionally associated with the group. All members of a given group therefore share the same value in this column.
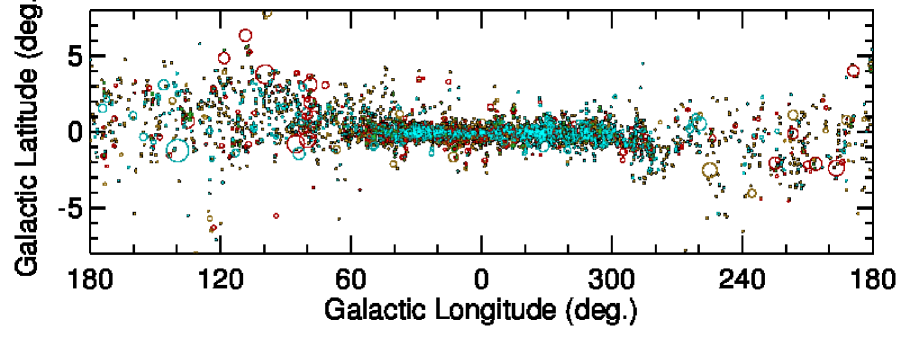
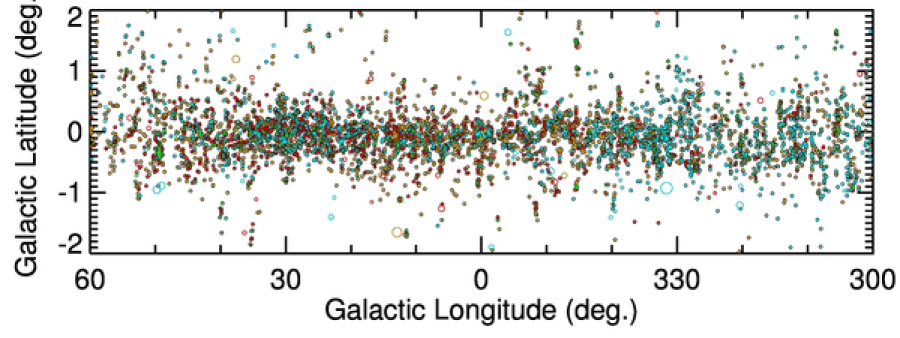
We show the Galactic locations of the catalog contents in Figure 4, which demonstrates the high density of sources, especially in the inner Galaxy. It is also clear from Figure 4 that sources are more confined to the Galactic plane in the inner compared to the outer Galaxy, and that sources in the outer Galaxy are generally larger in angle.
3.1 Known H II Regions
There are 1523 known H II regions in the catalog. All known H II regions have measured RRL or H spectroscopic emission. To identify known H II regions, we correlate the WISE-identified sources with the catalogs of Downes et al. (1980), Wink et al. (1982), Caswell & Haynes (1987), Lockman (1989), Fich et al. (1990), Lockman et al. (1996), Araya et al. (2002), Watson et al. (2003), Sewilo et al. (2004b), Anderson et al. (2011), and Bania et al. (2012). All except for the work of Fich et al. (1990), which measured H, are RRL surveys. If a source has been observed by multiple authors, we use the line parameters from the most recent author, since more recent observations are generally more reliable due to advances in instrumentation and telescope design. The exception to the above rule is that we include the H observations of Fich et al. (1990) if there are no other observations available. For 198 positions observed in RRL or H emission, the telescope beam contains multiple, separate H II regions. In such cases for all H II regions within the telescope beam we list the same RRL or H observational parameters.
This WISE-identified catalog improves upon the effort of Paladini et al. (2003) in that it includes more recent observations, removes sources duplicated by multiple authors, updates the positions using high-resolution MIR data, and removes contaminants now known not to be H II regions. Although they have detected RRL or H emission, we exclude 133 targets previously identified as H II regions (Table 3 Sources not Included in the Catalog). About half of these are not distinct H II regions, but rather are positions observed within large H II regions. We only use the line parameters from one observed position per WISE source: the location closest to the nominal source centroid. The characteristic IR morphology is absent for 35 previously observed positions. The detection of thermal RRL emission in the direction of these sources is likely due to diffuse Galactic plasma, which is prevalent in the inner Galaxy (e.g., Anderson et al., 2011, for discussion of emission near ). Finally, we exclude objects that more recent observations have shown to be supernova remnants, PNe, or stars (see Table 3 Sources not Included in the Catalog).
3.2 Groups
Star formation is a clustered phenomenon and many well-known H II regions are composed of multiple, individual H II regions, e.g., Sgr B2, W51, and G29. Numerous less well-studied star forming regions, however, also contain multiple, distinct H II regions. For example, Sharpless 104 has a small compact H II region on its eastern border (see Deharveng et al., 2003), but this compact region has not been measured in RRL or H emission and therefore does not meet our criteria for inclusion in the known sample. In general, only the brightest object in an H II region complex has been observed in RRL or H emission.
We group positionally associated H II region candidates with sources from the known sample. In general, for group membership we require that an H II region candidate be located on, or interior to, the photodisociation region (PDR) of a known H II region (as seen at 12 µm), or that a known H II region be located on the PDR of an H II region candidate. We relax this criterion slightly in the outer Galaxy and away from the Galactic plane, where there are few H II regions along a given line of sight. For and we require only that that H II region group members are connected by diffuse 12 µm emission. We also relax the PDR criterion for large, bright H II region complexes, e.g., G29 (Figure 3). In such complexes we assume that all nearby, bright H II regions that are part of a single large radio continuum source are part of the same H II region group. We largely refrain from assigning group membership in complicated zones of the inner Galaxy where there may be multiple H II regions along a given line of sight. We find that 650 sources that would otherwise be classified as H II region candidates are part of groups. The largest group is that associated with W49, which has 22 members. Finally, there are 403 radio quiet candidates that we associate with groups; nevertheless, these sources are in the radio quiet rather than the group catalog. We show example groups in Figure 3.
We caution that group membership is based solely on the positional correlation between known and candidate H II regions. This is a necessarily subjective process. Our hypothesis is that all group members are physically related, but we cannot be sure without spectroscopic observations. We attempt to assess the reliability of these group associations in Section 4.2, but we defer a more detailed study to a future publication.
3.3 H II Region Candidates
There are 1986 H II region candidates that have the characteristic H II region MIR morphology spatially coincident with detected radio continuum emission but lack RRL or H observations. These are ideal targets for followup spectroscopic observations, which would determine if the candidates are true H II regions. In the GBT HRDS, Anderson et al. (2011) detected the RRL and radio continuum emission from 95% of similarly-identified candidates. The detection of RRL and radio continuum emission in most cases proves that the source is a true H II region, although PNe also have RRL emission (Garay et al., 1989; Balser et al., 1997). We have begun a program to extend the HRDS using WISE candidates and we again find that approximately 95% of such candidates are detected in RRL emission. We therefore suggest that essentially all such H II region candidates are bona fide H II regions.
3.4 Radio Quiet H II Region Candidates
There are 4124 radio quiet sources that lack detected radio continuum emission. This sample contains objects that have the MIR appearance of H II regions. Membership in this sample is set by the sensitivity limits of existing radio continuum surveys. For example, data from the extremely sensitive MAGPIS 20 cm continuum survey allowed us to identify 162 H II region candidates that would otherwise be classified as radio quiet based on the poorer sensitivity of all other continuum surveys.
The exact nature of the radio quiet sources is not clear. A WISE catalog entry may be classified as radio quiet if it contains only intermediate mass stars, is an H II region (or young stellar object) in an early stage of its evolution, or is an H II region in a late stage of its evolution. Intermediate mass stars may lack the ultra-violet photons necessary to create an H II region that can be detected in the radio continuum surveys we used. Very young H II regions are optically thick at lower radio frequencies, which may limit our ability to detect their radio continuum emission. Evolved H II regions have low surface brightness radio continuum emission that may similarly fall below the sensitivity limits of the radio continuum surveys used. The radio quiet candidate sample therefore in all likelihood contains many different types of object.
We find that the majority of the radio quiet sources are small in angular size and are correlated with cold dust. This suggests that most radio quiet sources are in the earliest phases of H II region evolution. Over 60% of the radio quiet sources have circular radii , and over 80% have circular radii (these numbers are and for both the known and H II region candidates samples; see Section 5.2). In Section 4.1 we show correlations between the WISE catalog sources and various IR, sub-millimeter, and millimeter and catalogs, including the cold dust traced by the ATLASGAL (Schuller et al., 2009) and BOLOCAM Galactic Plane Survey (BGPS; Aguirre et al., 2011) surveys. Over two-thirds of all radio quiet sources that have angular radii are associated with ATLASGAL (Schuller et al., 2009) or BOLOCAM Galactic Plane Survey (BGPS; Aguirre et al., 2011) sources (Section 4.1).
A smaller subset of the radio quiet sources is composed of true H II regions with weak radio continuum emission. For example, the bubble in Perseus, G159.618.5, is ionized by HD 278942, an O9.5-B0 V star (Andersson et al., 2000). The distance to Perseus is only pc (see Hirota et al., 2008a, who place the distance closer to 200 pc). While the Perseus bubble is easily detected with WISE, if it were much more distant its radio continuum emission would not be detected. Many true H II regions more distant than Perseus would be classified as radio quiet.
3.5 Sources Lacking Radio Data
We find 115 sources for which high-quality radio continuum data are not available. Portions of the searched Galactic zone are not covered by the radio continuum surveys in Table 1, primarily within , . The classification of these objects will require new radio continuum observations.
4 CORRELATION WITH PREVIOUS WORK
To better characterize our WISE objects and to provide velocities for those not yet observed in RRL or H emission, we spatially correlate our WISE sources with catalogs of dust continuum (at IR, sub-mm, and mm-wavelengths) and molecular line emission. We only attempt to correlate WISE sources that have angular radii . Since nearly all dust continuum and molecular line catalogs consist of unresolved objects, we find that restricting the size of the WISE objects is necessary to avoid spurious matches between large H II regions and compact objects. The limit was chosen because it resulted in an acceptably low number of spurious matches between large WISE sources and nearby compact objects, based on a visual inspection of the results. The exception to the above size criterion is the correlations with the larger H II regions from Anderson et al. (2009), where we search all WISE sources for a match. While each dust continuum and molecular line survey has a different spatial resolution, we found that uniformly using a search radius of produces the best correlations between the molecular line and the ionized gas velocities. The angular size restriction of therefore allows for a maximum positional offset of 25% for the largest sources studied here. We caution that these positional correlations likely result in some false-positives. To mediate this effect, we only use molecular line velocities within 10 of the RRL or H velocity (if known).
The statistics of these positional correlations are summarized in Table 4 WISE Correlations with Dust Continuum and Molecular Line Surveys and the properties of WISE objects that are spatially correlated with molecular line emission are given in Table 5 Molecular Line Velocities for WISE Sources. Table 4 WISE Correlations with Dust Continuum and Molecular Line Surveys lists the survey name, the approximate longitude range of the survey, the number of known, group, candidate, and radio quiet sources matched, the total number of sources matched (including those lacking radio continuum data), the percentage of WISE sources matched over the dust continuum or molecular line survey area, the percentage of survey sources matched with the WISE H II region catalog, the wavelength of the survey (for continuum), the molecule observed (for spectral lines), and the survey reference. The LSR velocities of molecular line emission that is spatially correlated with WISE objects are given in Table 5 Molecular Line Velocities for WISE Sources. Listed are the WISE source name from Table 2, the source name from the molecular line observations, the Galactic longitude and latitude of these data, the LSR velocity, the molecule observed, and the reference.
4.1 Dust Continuum Emission
About half of the WISE sources that have angular radii are positionally associated with a previously identified dust continuum source from the Red MSX Source (RMS), ATLASGAL, BGPS, or Milky Way Project (MWP) surveys. For the RMS survey, we only search near sources identified as young stellar objects (YSOs) or H II regions. These identifications were based largely on the source MIR morphologies and on the detection of molecular gas. That only half of all angularly small WISE sources have been identified previously suggests that the WISE catalog is sampling a different population of objects compared to previous work.
About half of all RMS YSOs have a positional match with a WISE catalog source, whereas about three quarters of all RMS H II regions have a WISE H II region catalog source. Because the angular size of RMS H II regions and WISE catalog H II regions is potentially quite large, we expect a number of true correlations to be excluded by the 1′search criterion. A visual examination of WISE data indicates that they are positionally correlated nearly 100% of the time.
About half of all WISE sources are positionally correlated with an object from the ATLASGAL and BGPS surveys, over the respective areas of these surveys. These are the highest percentages of all the dust continuum surveys. The percentage of ATLASGAL and BGPS sources matched with a WISE catalog object, however, is only , for both surveys. This shows that these catalogs mostly contain objects not positionally correlated with WISE H II regions and candidates.
The MWP (Simpson et al., 2012) harnessed the power of thousands of on-line volunteers to identify MIR “bubbles” in Spitzer images. Here, we search for the more general MIR characteristics of H II regions, which often cannot be characterized as a bubble (Anderson et al., 2011). The MWP catalogs the properties of ellipsoids that approximate the inner and outer radii of each bubble. There are in fact two MWP bubble catalogs that contain “large” and “small” bubbles, respectively. For a positive WISE-MWP correlation, we requre that: (a) the difference between the WISE and MWP positions be less than half of the MWP outer semi-major axis; and (b) the WISE angular size be within a factor of two of the MWP outer semi-major axis. As expected, the correlation is quite high: approximately half of all MWP bubbles are correlated in position with a WISE object.
4.2 Molecular Line Observations
We correlate the positions of the WISE H II region catalog objects with large molecular line surveys to provide velocities and distances for sources lacking such information. For sources that are detected in multiple transitions, we use the molecular information from the dense gas tracers (CS, NH3, and HCO+) instead of that from CO. Ideally, the velocities of all tracers would agree but CO often has multiple components along the line of sight, which can make velocity assignments challenging. For the dense gas tracers that were observed by multiple authors, we use the data from the most recent observations. If the WISE source is a known H II region with a single ionized gas velocity, we only use the molecular gas velocity if it is within 10 of the ionized gas velocity.
We find molecular velocities for 2262 sources; this is 30% of all objects with radii . Of these, 1667 of these do not have RRL or H velocities. The mean absolute difference between the molecular and ionized gas velocities is , and the mean difference is . Within the errors, the velocity differences are identical for all the molecular species studied here. These values are similar to those found by Anderson et al. (2009) in their study of associated with H II regions: they found a mean absolute difference of and a mean difference of .
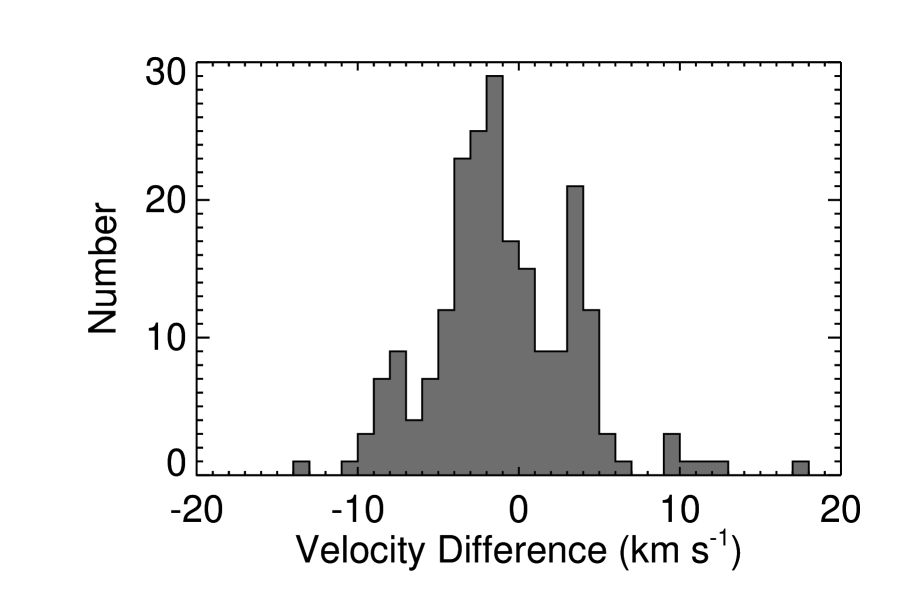
We defined source group associations based solely on positional juxtapositions. When we now add molecular velocity information, we find that the vast majority of group members share similar LSR velocities. This gives further support to the hypothesis that group members are all bona fide H II regions in the same star forming complex. We show the LSR velocity difference between the molecular and group ionized gas emission, , in Figure 5. The group ionized gas velocities are those of the group member that was measured in RRL or H emission. The means of the absolute velocity difference and the velocity difference are and , respectively. Although these velocity differences are higher than what we find for the entire WISE sample, this is not significant within the errors. These statistics, as well as Figure 5, do not include 8 sources with absolute velocity differences greater than 20 . These objects comprise only 4% of the total number of grouped objects that have molecular line velocities. We keep these 8 sources in the group sample.
4.3 WISE Catalog Source Distances
We provide distances for 1459 WISE catalog sources. There are three main ways that distances have been determined for H II regions: through their association with a maser that has a measured parallax, spectrophotometrically, and kinematically. The most accurate distances for star forming regions are from trigonometric parallaxes of masers, but there are relatively few such parallaxes known. To make such a measurement, a star forming region must have a bright associated maser, and many massive star formations do not meet this criterion. Spectrophotometric distances require one to accurately identify the main ionizing source of an H II region, and to determine its spectral type. Because spectral types can be more readily determined for bright stars that have a low line-of-sight extinction, in general spectrophotometric distances are only known for nearby H II regions. Kinematic distances are in principle available for all H II regions with measured velocities, across the entire Galactic disk. Anderson et al. (2012a) found that kinematic distance errors are for most of the Galactic disk. They estimated these uncertainties from the combined effects of different rotation curves, streaming motions, and uncertainties in the Solar circular rotation parameters (see also Gómez, 2006). Kinematic distances do, however, have large systematic uncertainties in parts of the Galaxy, especially where Galactic rotation carries objects tangent to our line of sight.
Here, we only use maser parallax and kinematic distances. While spectrophotometric distances can be more accurate than kinematic distances, in practice they often have large uncertainties (see Russeil et al., 2007). We use parallax distances when possible (62 WISE sources), and kinematic distances otherwise. We compute all distances using the Brand (1986) rotation curve model, with the Sun 8.5 kpc from the Galactic center and a Solar circular rotation speed of 220 .
Sources in the inner Galaxy suffer from the kinematic distance ambiguity (KDA), which complicates the computation of kinematic distances. In the Inner Galaxy, for each line of sight there are two possible distances, known as “near” and “far,” that produce identical LSR velocities. The tangent point distance is halfway between the near and far distances. Sources at the tangent point distance do not have a KDA. Sources beyond the Solar orbit in the outer Galaxy also do not have a KDA.
A kinematic distance ambiguity resolution, KDAR, requires auxiliary data to determine if the near or far distance is correct for a given source. Usually the auxiliary data are H I or H2CO. There are three main methods for resolving the KDA: H I Emission Absorption (H I E/A), H2CO absorption, and H I self-absorption (H I SA). In the H I E/A method, foreground H I absorbs the broadband H II region continuum radiation. Neutral H I gas between the H II region and the observer absorbs the thermal continuum if the brightness temperature of the H I is less than that of the H II region at 21 cm. Because the continuum emission is not limited to a particular frequency (velocity), all foreground H I has the potential to absorb the H II region continuum. H II regions at the near distance will show H I absorption up to the source velocity, while those at the far distance will show H I absorption up to the tangent point velocity. In the H2CO absorption method, cold foreground molecular clouds containing H2CO may absorb the broadband H II region continuum radiation. This method is analogous to H I E/A, with H2CO replacing H I as the absorbing species. In the H I SA method, cold foreground H I at the near kinematic distance absorbs line emission from warmer background H I at the far kinematic distance. The cold foreground H I is often associated with molecular gas. The utility of this method for H II region studies relies on the association between the H II region and molecular gas (see Anderson & Bania, 2009). If the cold H I (together with the molecular gas and the associated H II region) is at the near distance, there will be H I absorption at the velocity of its emission; this absorption will be absent if it is at the far distance.
These methods have their strengths and weaknesses. The H I E/A method is generally more reliable than the other methods, because there is an H I cloud on average every 0.7 kpc along the line of sight (Bania & Lockman, 1984), compared to 2.9 kpc for (Watson et al., 2003). Near distances found using H2CO absorption are less reliable than those of the H I E/A method because a lack of absorption may simply be caused by a lack of H2CO clouds. If absorption is detected between the source velocity and the tangent point velocity, however, these KDARs are more reliable than those of H I E/A because background fluctiations in H I data can more easily create false absorption signals. The H I SA method is considerably less reliable than the H I E/A method for H II regions (Anderson & Bania, 2009).
Based on these considerations, we first use far distance H2CO KDARs when possible, then the H I E/A KDARs, and, finally, the H I SA KDARs if no other KDAR is known. Interferometric H I E/A experiments are more reliable than those using single-dish radio data due to decreased sensitivity to background emission fluctuations. We therefore use the interferometric KDARs of Urquhart et al. (2011) whenever possible. In all other cases we use the most recent KDAR determination for a source. Anderson & Bania (2009) discuss sources with conflicting KDA determinations, which comprise a small percentage of the total population. All sources having LSR velocities within 10 of the tangent point velocity are given the tangent point distance. All inner Galaxy Sharpless H II regions are given the near distance if no other distance is available. Finally, we assign all sources from that have LSR velocities between 15 and 15 to the Cygnus complex, using the maser parallax distance of DR 21 (Rygl et al., 2012).
Under the assumption that the WISE catalog objects are associated with the objects targeted in the molecular line surveys of Section 4.2, we provide distances to 641 WISE H II region candidates and radio quiet sources. We use H I SA and infrared dark cloud association KDARs from Dunham et al. (2011) (of BGPS objects) and the H I SA KDARs from Urquhart et al. (2012) (of RMS objects). These studies use the same positions from the BGPS and RMS surveys, respectively, so no additional positional matching with WISE sources is required. As with the molecular gas associations, we assume that the KDARs for objects within of the WISE sources also apply to the WISE sources themselves.
We give the distances to our WISE catalog sources in Table 6 Distances, which lists the WISE source name from Tables The WISE Catalog of Galactic H II Regions and 5 Molecular Line Velocities for WISE Sources, the near kinematic distance, the far kinematic distance, the tangent point distance, the Galactocentric radius (), the tangent point velocity (VT), the KDAR (“N” for near, “F” for far, “T” for tangent point, and “OG” for outer Galaxy), the heliocentric distance (), the uncertainty in heliocentric distance (), the Galactic azimuth in clockwise degrees from the line connecting the Galactic center to the Sun, the height above the plane (, where is the Galactic latitude), the method used to derive the distance, and the reference. For maser parallax distances, we recompute the Galactocentric radius based on the derived distance.
4.3.1 Distance Uncertainties
Here, the uncertainty estimates are based upon the Anderson et al. (2012a) analysis, expanded to include the entire Galaxy. Each uncertainty estimate is therefore computed from the combined uncertainties from the choice of Galactic rotation curve, streaming motions of 7 , and a change to the Solar circular rotation speed, , for a range of LSR velocities and Galactic longitudes. While Anderson et al. (2012a) computed the effect of a change to (Reid et al., 2009b), we here use 240 (Brunthaler et al., 2011). The analysis is otherwise unchanged except for how we estimate the distance uncertainty for tangent point sources. For these we estimate the uncertainty by adding in quadrature the source near distance uncertainties and the difference between the near and the far distances: . This formulation takes into account the uncertainties in any kinematic distance due to both the source location, the term, and also the choice of the near, far, or tangent point distances, the term.
We give an estimate for the uncertainty in each distance, , in Table 6 Distances. We do not list distances for sources that have fractional uncertainties, , exceeding 50%. Additionally, we do not provide distances for sources within of the Galactic center and of the anti-center because kinematic distances are very uncertain in these regions of the Galaxy. In the second and third Galactic quadrants, the distance uncertainties average , whereas they average in the first and fourth quadrants.
5 DISCUSSION
5.1 Galaxy-wide Star Formation
The WISE Catalog of Galactic H II Regions is the most complete catalog yet of regions forming massive stars in the Milky Way. It provides a large sample of objects that will enable future studies of the structure, dynamics, and chemical evolution of the Galaxy. Here, we use the catalog to assess the Galaxy-wide distribution on the sky of nebulae forming massive stars. In Table The WISE Catalog of Galactic H II Regions we show the distribution of the catalog sources for various Galactic zones. For each sample population in the catalog, we list the percentage of that population that resides in each Galactic quadrant, as well as in a range of angular distances from the Galactic center and the Galactic plane. We also give the same information for the entire catalog and for the molecular gas distribution. We characterize the molecular gas distribution using the Dame et al. (2001) survey of emission. We normalize the CO percentages by the integrated line intensity summed over the sky zone of the the WISE H II region catalog (see Section 2).
5.1.1 The Galactic Longitude Distribution
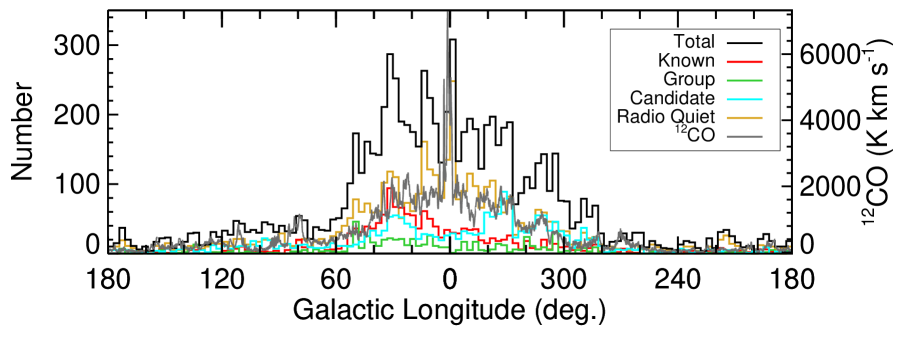
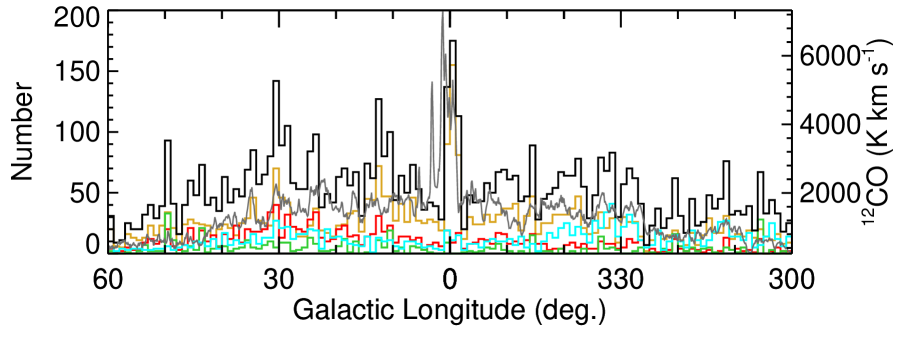
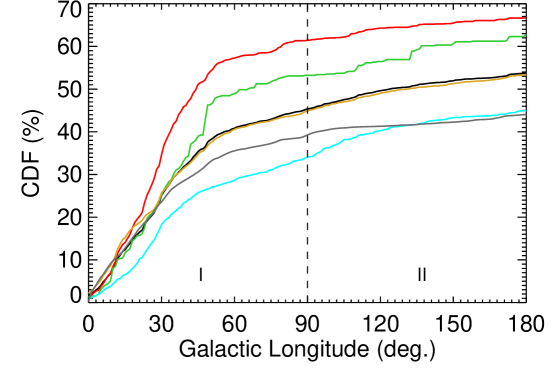
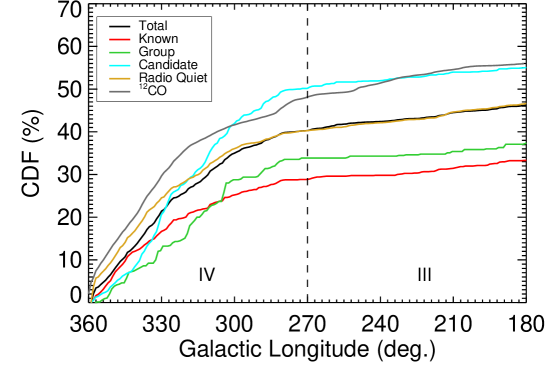
We show the distribution in Galactic longitude for each sample population in Figure 6, together with the integrated intensity from Dame et al. (2001) summed over latitudes within of the Galactic plane. The density of sources increases dramatically in the inner Galaxy, as expected. This is also seen in the Galactic longitude cumulative distribution functions (CDFs) that we plot in Figure 7. Approximately 85% of all sources are in the first and fourth Galactic quadrants, and 76% are within of the Galactic center. These percentages are essentially the same for (88% and 77%, respectively). Only 15% of catalog sources are located in the second and third Galactic quadrants (9% and 6%, respectively). Again, we find similar percentages for (8% and 5%, respectively). Only about 9% of all known H II regions are in these two quadrants.
There is, however, a north-south asymmetry in the WISE catalog of Galactic H II regions, most apparent in Figure 6. About 45% of all sources are located in the first Galactic quadrant, and 40% are in the fourth. The cause of this asymmetry may be due in part to the higher-quality radio continuum data in the north. When performing the visual search, compact objects with no nebulosity would be excluded from the catalog if they also lack radio continuum emission, because they are indistinguishable from stars. Because of the lower quality radio continuum data in the south, the northern hemisphere may have more compact catalog objects. The opposite trend is seen for both the H II regions identified in the RMS survey (41% in the north and 50% in the south), and also the Bronfman et al. (1996) IRAS sources that have colors indicative of high mass star formation (36% in the north and 43% in the south). Why the H II region distribution is different is unknown. It does, however, agree with the distribution.
There are even larger asymmetries in the known and candidate samples. Table The WISE Catalog of Galactic H II Regions shows that 61% of all known H II regions are in the first quadrant, versus 29% in the fourth. About 50% of all H II region candidates are in the fourth Galactic quadrant, versus 34% in the first. This is also apparent in Figure 7, as the rise in the known sample distribution is steep in the first quadrant, and that of the candidate sample is steep in the fourth quadrant. Compared to the first quadrant, the fourth quadrant has received little attention from RRL studies.
5.1.2 The Galactic Center
Star formation is deficient in the Galactic center relative to the amount of molecular material available (Longmore et al., 2013, see also Beuther et al. (2012); Simpson et al. (2012)). While the percentages of the total integrated emission and WISE sources detected within of the Galactic center are similar, toward the Galactic center there is more emission relative to the number of WISE sources. Within of the Galactic center, we would expect roughly twice the number of WISE sources found, based on the intensity (see Figure 6). Furthermore, the WISE sources that lie in the Galactic center are mostly radio quiet; they may not be true H II regions.
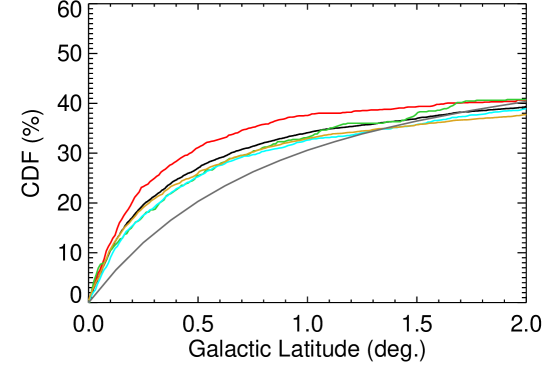
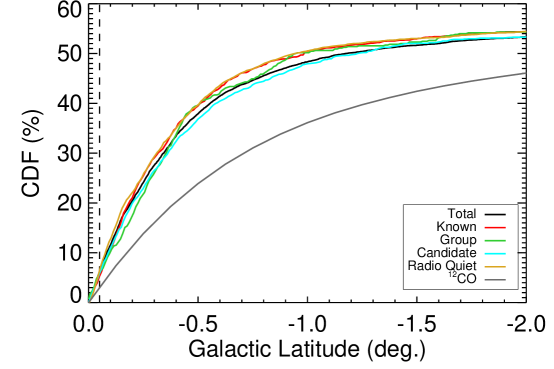
5.1.3 The Galactic Latitude Distribution
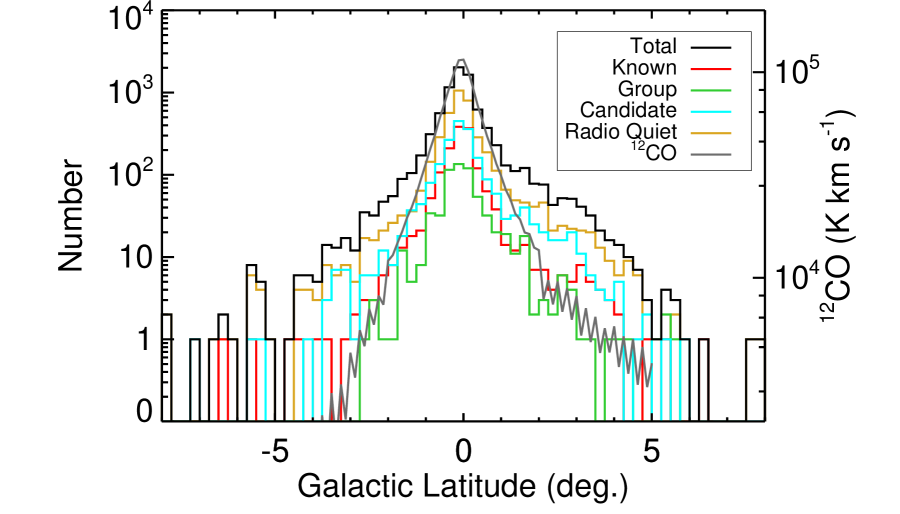
We show the distribution in Galactic latitude for each sample population in the catalog in Figure 8, together with the integrated intensity. As expected, the source distribution is strongly peaked at the nominal Galactic plane, . This is also seen in the Galactic latitude cumulative distribution functions (CDFs) that we plot in Figure 9. All samples have essentially the same distribution although the distribution is considerably broader (Table The WISE Catalog of Galactic H II Regions). There is a significant number of sources at high and low Galactic latitudes, with lying outside of .
All samples have an asymmetry such that there are more sources at negative latitudes. Over 56% of all sources are at negative latitudes and 44% are at positive latitudes. The median of the distribution is at , a value that holds for all samples and also for (see Figure 9). The cause of this offset is generally ascribed to the Sun lying above the true Galactic mid-plane. There is an especially high density of known H II regions between and , relative to the other samples. This is likely a result of the fact that most known H II regions are in the first Galactic quadrant, which on the whole has a positive latitude offset.
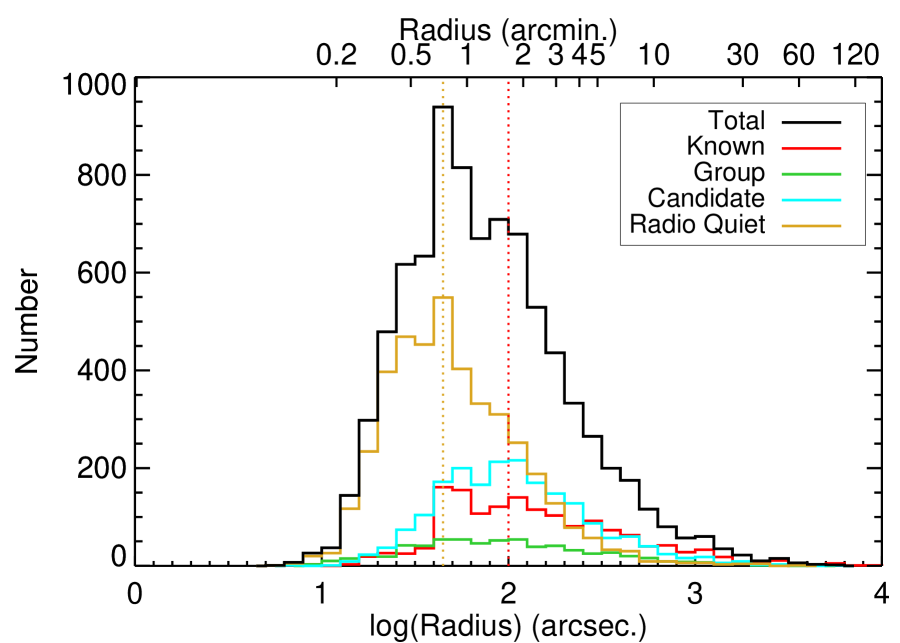
5.2 Angular Sizes
The angular radii of the WISE H II regions range from to . As described previously, these sizes are visually determined, and approximately contain the MIR emission of each source. As seen in Figure 10, the known and candidate samples share the same distribution, both with an average angular radius of (average computed from the log of the radius), and a median value approximately the same. The radio quiet sources have an average angular radius of , and a median value of . This hints at a fundamental difference between the two samples. In Section 3.4 we argue that this size difference is a result of the young average age of the radio quiet sources. For comparison, the “large” MWP bubbles have an average angular radius of and a median of . The small MWP bubbles average , with a median also of . Therefore, the angular size distribution of the radio-quiet sample is most similar to that of the “small” MWP bubbles. The angular size distributions of the other samples are considerably larger than that of the “large” MWP bubbles.
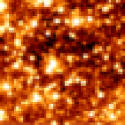
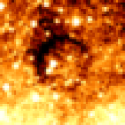
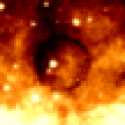
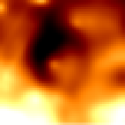
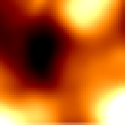
5.3 An Evolved Stellar Shell Seen in Absorption?
We detect a bubble that displays infrared absorption, at (Figure 11). This object is not in the WISE Catalog of Galactic H II regions; we mention it here because it is the only such bubble we identified in the over 5000 square degrees examined. Morphologically, it is similar to the MIPSGAL bubbles of Mizuno et al. (2010) in that it is is almost perfectly circular. This morphology is in contrast to the less-regular geometry of most H II regions. Many of the MIPSGAL bubbles have a central object but there is nothing detected at MIR wavelengths in the center of this bubble. There is also no detected radio continuum emission, no detection of the object in absorption at wavelengths less than 4.5 µm, and no detection in Herschel Hi-Gal data at 70 (Molinari et al., 2010). Mizuno et al. (2010) argue that most such objects with circular geometry (detected in emission) are ejecta from evolved stars and PNe. If this is the case for this object, it may allow for the spectroscopic study of the ejecta in absorption.
6 SUMMARY
We searched WISE mid-infrared (MIR) images and created a catalog of Galactic H II regions and H II region candidates. It improves on previous Galactic H II region catalogs by removing duplicate sources and contaminants such as planetary nebulae and supernova remnants. The catalog extends over all Galactic longitudes within . We have also included five well-known nearby H II regions that lie outside this latitude range. The catalog thus contains all known Galactic H II regions (1523 sources). Here we define an H II region as “known” if it has been observed in radio recombination line or H spectroscopic emission, otherwise it is an H II region candidate.
By correlating this catalog with previous work, we provide distances to 1459 sources. Over 25% of all WISE catalog sources can be associated with molecular emission (2262 sources), most of which do no have ionized gas velocities (1667 sources). There are 1986 H II region candidates in the catalog that have radio continuum and MIR emission. These are ideal objects for followup spectroscopic observations that can confirm their classification. Our group’s previous RRL studies show that of such targets are true H II regions. There are also 4124 radio quiet sources that have the characteristic MIR emission of H II regions, but do not show radio continuum emission at the sensitivity limits of existing surveys. The majority of these are likely in the earliest phases of H II region evolution, but a significat population are probably real H II regions with weak, extended radio continuum emission too faint for detection.
The Galactic distribution of the WISE catalog sources is similar to that of other tracers of star formation, such as . The one exception is in the Galactic center where there is a deficiency of sources compared to the amount of molecular material. There is a slight north-south asymmetry such that of all sources are located in the first Galactic quadrant and are in the fourth. We find that of all known Galactic H II regions are in the first quadrant, due to the larger number of spectroscopic surveys in this part of the Galaxy. The latitude distribution of WISE catalog sources is more confined to the Galactic plane compared to that of CO.
Appendix A THE WISE CATALOG OF GALACTIC H II REGIONS WEB SITE
We constructed a web site to give others access to the catalog data444http://astro.phys.wvu.edu/wise. This site has data from Tables 2 to 6, and provides a visual interface for easily viewing the catalog contents. Users can filter the data in myriad ways and export the output as a machine-readable file. We will continue to extend this site as we learn more about the WISE catalog sources.
References
- Aguirre et al. (2011) Aguirre, J. E., et al. 2011, ApJS, 192, 4
- Anderson (2010) Anderson, L. D. 2010, PhD thesis, Boston University
- Anderson & Bania (2009) Anderson, L. D., & Bania, T. M. 2009, ApJ, 690, 706
- Anderson et al. (2011) Anderson, L. D., Bania, T. M., Balser, D. S., & Rood, R. T. 2011, ApJS, 194, 32
- Anderson et al. (2012a) —. 2012a, ApJ, 754, 62
- Anderson et al. (2009) Anderson, L. D., Bania, T. M., Jackson, J. M., Clemens, D. P., Heyer, M., Simon, R., Shah, R. Y., & Rathborne, J. M. 2009, ApJS, 181, 255
- Anderson et al. (2012b) Anderson, L. D., Zavagno, A., Barlow, M. J., García-Lario, P., & Noriega-Crespo, A. 2012b, A&A, 537, A1
- Anderson et al. (2012c) Anderson, L. D., et al. 2012c, A&A, 542, A10
- Andersson et al. (2000) Andersson, B.-G., Wannier, P. G., Moriarty-Schieven, G. H., & Bakker, E. J. 2000, AJ, 119, 1325
- Ando et al. (2011) Ando, K., et al. 2011, PASJ, 63, 45
- Araya et al. (2002) Araya, E., Hofner, P., Churchwell, E., & Kurtz, S. 2002, ApJS, 138, 63
- Arvidsson et al. (2009) Arvidsson, K., Kerton, C. R., & Foster, T. 2009, ApJ, 700, 1000
- Balser et al. (1997) Balser, D. S., Bania, T. M., Rood, R. T., & Wilson, T. L. 1997, ApJ, 483, 320
- Bania et al. (2012) Bania, T. M., Anderson, L. D., & Balser, D. S. 2012, ApJ, 759, 96
- Bania et al. (2010) Bania, T. M., Anderson, L. D., Balser, D. S., & Rood, R. T. 2010, ApJ, 718, L106
- Bania & Lockman (1984) Bania, T. M., & Lockman, F. J. 1984, ApJS, 54, 513
- Bartkiewicz et al. (2008) Bartkiewicz, A., Brunthaler, A., Szymczak, M., van Langevelde, H. J., & Reid, M. J. 2008, A&A, 490, 787
- Becker et al. (1994) Becker, R. H., White, R. L., Helfand, D. J., & Zoonematkermani, S. 1994, ApJS, 91, 347
- Benjamin et al. (2003) Benjamin, R. A., et al. 2003, PASP, 115, 953
- Beuther et al. (2012) Beuther, H., et al. 2012, ApJ, 747, 43
- Bock et al. (1999) Bock, D., Large, M. I., & Sadler, E. M. 1999, AJ, 117, 1578
- Brand (1986) Brand, J. 1986, PhD thesis, Leiden Univ., Netherlands.
- Brogan et al. (2006) Brogan, C. L., Gelfand, J. D., Gaensler, B. M., Kassim, N. E., & Lazio, T. J. W. 2006, ApJ, 639, L25
- Bronfman et al. (1996) Bronfman, L., Nyman, L.-A., & May, J. 1996, A&AS, 115, 81
- Brunthaler et al. (2009) Brunthaler, A., Reid, M. J., Menten, K. M., Zheng, X. W., Moscadelli, L., & Xu, Y. 2009, ApJ, 693, 424
- Brunthaler et al. (2011) Brunthaler, A., et al. 2011, Astronomische Nachrichten, 332, 461
- Carey et al. (2009) Carey, S. J., et al. 2009, PASP, 121, 76
- Caswell & Haynes (1987) Caswell, J. L., & Haynes, R. F. 1987, A&A, 171, 261
- Churchwell et al. (2009) Churchwell, E., et al. 2009, PASP, 121, 213
- Clark et al. (2003) Clark, J. S., Egan, M. P., Crowther, P. A., Mizuno, D. R., Larionov, V. M., & Arkharov, A. 2003, A&A, 412, 185
- Condon et al. (1998) Condon, J. J., Cotton, W. D., Greisen, E. W., Yin, Q. F., Perley, R. A., Taylor, G. B., & Broderick, J. J. 1998, AJ, 115, 1693
- Contreras et al. (2013) Contreras, Y., et al. 2013, A&A, 549, A45
- Dame et al. (2001) Dame, T. M., Hartmann, D., & Thaddeus, P. 2001, ApJ, 547, 792
- Deharveng et al. (2003) Deharveng, L., Lefloch, B., Zavagno, A., Caplan, J., Whitworth, A. P., Nadeau, D., & Martín, S. 2003, A&A, 408, L25
- Deharveng et al. (2010) Deharveng, L., et al. 2010, A&A, 523, A6+
- Downes et al. (1980) Downes, D., Wilson, T. L., Bieging, J., & Wink, J. 1980, A&AS, 40, 379
- Dunham et al. (2011) Dunham, M. K., Rosolowsky, E., Evans, II, N. J., Cyganowski, C., & Urquhart, J. S. 2011, ApJ, 741, 110
- Fazio et al. (2004) Fazio, G. G., et al. 2004, ApJS, 154, 10
- Fich et al. (1990) Fich, M., Dahl, G. P., & Treffers, R. R. 1990, AJ, 99, 622
- Flaherty et al. (2007) Flaherty, K. M., Pipher, J. L., Megeath, S. T., Winston, E. M., Gutermuth, R. A., Muzerolle, J., Allen, L. E., & Fazio, G. G. 2007, ApJ, 663, 1069
- Foster et al. (2011) Foster, J. B., et al. 2011, ApJS, 197, 25
- Gaensler et al. (1999) Gaensler, B. M., Gotthelf, E. V., & Vasisht, G. 1999, ApJ, 526, L37
- Garay et al. (1989) Garay, G., Gathier, R., & Rodriguez, L. F. 1989, A&A, 215, 101
- Gómez (2006) Gómez, G. C. 2006, AJ, 132, 2376
- Gregory et al. (1996) Gregory, P. C., Scott, W. K., Douglas, K., & Condon, J. J. 1996, ApJS, 103, 427
- Hachisuka et al. (2009) Hachisuka, K., Brunthaler, A., Menten, K. M., Reid, M. J., Hagiwara, Y., & Mochizuki, N. 2009, ApJ, 696, 1981
- Helfand et al. (2006) Helfand, D. J., Becker, R. H., White, R. L., Fallon, A., & Tuttle, S. 2006, AJ, 131, 2525
- Hirota et al. (2008a) Hirota, T., et al. 2008a, PASJ, 60, 37
- Hirota et al. (2008b) —. 2008b, PASJ, 60, 37
- Hirota et al. (2008c) —. 2008c, PASJ, 60, 961
- Hoare et al. (2012) Hoare, M. G., et al. 2012, PASP, 124, 939
- Honma et al. (2007) Honma, M., et al. 2007, PASJ, 59, 889
- Immer et al. (2013) Immer, K., Reid, M. J., Menten, K. M., Brunthaler, A., & Dame, T. M. 2013, A&A, 553, A117
- Jackson et al. (2006) Jackson, J. M., et al. 2006, ApJS, 163, 145
- Jones & Dickey (2012) Jones, C., & Dickey, J. M. 2012, ApJ, 753, 62
- Kobulnicky et al. (2013) Kobulnicky, H. A., Babler, B. L., Alexander, M. J., Meade, M. R., Whitney, B. A., & Churchwell, E. B. 2013, ApJS, 207, 9
- Kurayama et al. (2011) Kurayama, T., Nakagawa, A., Sawada-Satoh, S., Sato, K., Honma, M., Sunada, K., Hirota, T., & Imai, H. 2011, PASJ, 63, 513
- Kurtz et al. (1994) Kurtz, S., Churchwell, E., & Wood, D. O. S. 1994, ApJS, 91, 659
- Lockman (1989) Lockman, F. J. 1989, ApJS, 71, 469
- Lockman et al. (1996) Lockman, F. J., Pisano, D. J., & Howard, G. J. 1996, ApJ, 472, 173
- Longmore et al. (2013) Longmore, S. N., et al. 2013, MNRAS, 429, 987
- McClure-Griffiths et al. (2005) McClure-Griffiths, N. M., Dickey, J. M., Gaensler, B. M., Green, A. J., Haverkorn, M., & Strasser, S. 2005, ApJS, 158, 178
- Menten et al. (2007) Menten, K. M., Reid, M. J., Forbrich, J., & Brunthaler, A. 2007, A&A, 474, 515
- Mizuno et al. (2010) Mizuno, D. R., et al. 2010, AJ, 139, 1542
- Moellenbrock et al. (2009) Moellenbrock, G. A., Claussen, M. J., & Goss, W. M. 2009, ApJ, 694, 192
- Molinari et al. (2010) Molinari, S., et al. 2010, A&A, 518, L100+
- Moscadelli et al. (2009) Moscadelli, L., Reid, M. J., Menten, K. M., Brunthaler, A., Zheng, X. W., & Xu, Y. 2009, ApJ, 693, 406
- Niinuma et al. (2011) Niinuma, K., et al. 2011, PASJ, 63, 9
- Oh et al. (2010) Oh, C. S., Kobayashi, H., Honma, M., Hirota, T., Sato, K., & Ueno, Y. 2010, PASJ, 62, 101
- Paladini et al. (2003) Paladini, R., Burigana, C., Davies, R. D., Maino, D., Bersanelli, M., Cappellini, B., Platania, P., & Smoot, G. 2003, A&A, 397, 213
- Purcell et al. (2012) Purcell, C. R., et al. 2012, MNRAS, 426, 1972
- Purcell et al. (2013) —. 2013, ApJS, 205, 1
- Reid et al. (2009a) Reid, M. J., Menten, K. M., Brunthaler, A., Zheng, X. W., Moscadelli, L., & Xu, Y. 2009a, ApJ, 693, 397
- Reid et al. (2009b) Reid, M. J., et al. 2009b, ApJ, 700, 137
- Rieke & Lebofsky (1985) Rieke, G. H., & Lebofsky, M. J. 1985, ApJ, 288, 618
- Rieke et al. (2004) Rieke, G. H., et al. 2004, ApJS, 154, 25
- Roman-Duval et al. (2009) Roman-Duval, J., Jackson, J. M., Heyer, M., Johnson, A., Rathborne, J., Shah, R., & Simon, R. 2009, ArXiv e-prints
- Rosolowsky et al. (2010) Rosolowsky, E., et al. 2010, ApJS, 188, 123
- Rubin (1968) Rubin, R. H. 1968, ApJ, 154, 391
- Russeil et al. (2007) Russeil, D., Adami, C., & Georgelin, Y. M. 2007, A&A, 470, 161
- Rygl et al. (2010) Rygl, K. L. J., Brunthaler, A., Reid, M. J., Menten, K. M., van Langevelde, H. J., & Xu, Y. 2010, A&A, 511, A2
- Rygl et al. (2012) Rygl, K. L. J., et al. 2012, A&A, 539, A79
- Sanchez-Monge et al. (2013) Sanchez-Monge, A., et al. 2013, ArXiv e-prints
- Sanna et al. (2012) Sanna, A., Reid, M. J., Dame, T. M., Menten, K. M., Brunthaler, A., Moscadelli, L., Zheng, X. W., & Xu, Y. 2012, ApJ, 745, 82
- Sanna et al. (2009) Sanna, A., Reid, M. J., Moscadelli, L., Dame, T. M., Menten, K. M., Brunthaler, A., Zheng, X. W., & Xu, Y. 2009, ApJ, 706, 464
- Sato et al. (2010a) Sato, M., Hirota, T., Reid, M. J., Honma, M., Kobayashi, H., Iwadate, K., Miyaji, T., & Shibata, K. M. 2010a, PASJ, 62, 287
- Sato et al. (2010b) Sato, M., Reid, M. J., Brunthaler, A., & Menten, K. M. 2010b, ApJ, 720, 1055
- Sato et al. (2008) Sato, M., et al. 2008, PASJ, 60, 975
- Schlingman et al. (2011) Schlingman, W. M., et al. 2011, ApJS, 195, 14
- Schuller et al. (2009) Schuller, F., et al. 2009, A&A, 504, 415
- Sewilo et al. (2004a) Sewilo, M., Churchwell, E., Kurtz, S., Goss, W. M., & Hofner, P. 2004a, ApJ, 605, 285
- Sewilo et al. (2004b) Sewilo, M., Watson, C., Araya, E., Churchwell, E., Hofner, P., & Kurtz, S. 2004b, ApJS, 154, 553
- Shiozaki et al. (2011) Shiozaki, S., Imai, H., Tafoya, D., Omodaka, T., Hirota, T., Honma, M., Matsui, M., & Ueno, Y. 2011, PASJ, 63, 1219
- Simpson et al. (2012) Simpson, R. J., et al. 2012, ArXiv e-prints
- Spitzer (1968) Spitzer, L. 1968, Diffuse matter in space (New York: Interscience Publication, 1968)
- Sternberg et al. (2003) Sternberg, A., Hoffmann, T. L., & Pauldrach, A. W. A. 2003, ApJ, 599, 1333
- Stil et al. (2006) Stil, J. M., et al. 2006, AJ, 132, 1158
- Taylor et al. (2003) Taylor, A. R., et al. 2003, AJ, 125, 3145
- Tielens (2008) Tielens, A. G. G. M. 2008, ARA&A, 46, 289
- Urquhart et al. (2007a) Urquhart, J. S., Busfield, A. L., Hoare, M. G., Lumsden, S. L., Clarke, A. J., Moore, T. J. T., Mottram, J. C., & Oudmaijer, R. D. 2007a, A&A, 461, 11
- Urquhart et al. (2008a) Urquhart, J. S., Hoare, M. G., Lumsden, S. L., Oudmaijer, R. D., & Moore, T. J. T. 2008a, in Astronomical Society of the Pacific Conference Series, Vol. 387, Massive Star Formation: Observations Confront Theory, ed. H. Beuther, H. Linz, & T. Henning, 381–+
- Urquhart et al. (2007b) Urquhart, J. S., et al. 2007b, A&A, 474, 891
- Urquhart et al. (2008b) —. 2008b, A&A, 487, 253
- Urquhart et al. (2009) —. 2009, A&A, 501, 539
- Urquhart et al. (2011) —. 2011, MNRAS, 418, 1689
- Urquhart et al. (2012) —. 2012, MNRAS, 420, 1656
- Watson et al. (2003) Watson, C., Araya, E., Sewilo, M., Churchwell, E., Hofner, P., & Kurtz, S. 2003, ApJ, 587, 714
- Watson et al. (2009) Watson, C., Corn, T., Churchwell, E. B., Babler, B. L., Povich, M. S., Meade, M. R., & Whitney, B. A. 2009, ApJ, 694, 546
- Watson et al. (2008) Watson, C., et al. 2008, ApJ, 681, 1341
- Wienen et al. (2012) Wienen, M., Wyrowski, F., Schuller, F., Menten, K. M., Walmsley, C. M., Bronfman, L., & Motte, F. 2012, A&A, 544, A146
- Wilson et al. (1970) Wilson, T. L., Mezger, P. G., Gardner, F. F., & Milne, D. K. 1970, A&A, 6, 364
- Wink et al. (1982) Wink, J. E., Altenhoff, W. J., & Mezger, P. G. 1982, A&A, 108, 227
- Wood & Churchwell (1989) Wood, D. O. S., & Churchwell, E. 1989, ApJS, 69, 831
- Wouterloot & Brand (1989) Wouterloot, J. G. A., & Brand, J. 1989, A&AS, 80, 149
- Wu et al. (2012) Wu, Y. W., Xu, Y., Menten, K. M., Zheng, X. W., & Reid, M. J. 2012, in IAU Symposium, Vol. 287, IAU Symposium, ed. R. S. Booth, W. H. T. Vlemmings, & E. M. L. Humphreys, 425–426
- Xu et al. (2011) Xu, Y., Moscadelli, L., Reid, M. J., Menten, K. M., Zhang, B., Zheng, X. W., & Brunthaler, A. 2011, ApJ, 733, 25
- Xu et al. (2009) Xu, Y., Reid, M. J., Menten, K. M., Brunthaler, A., Zheng, X. W., & Moscadelli, L. 2009, ApJ, 693, 413
- Xu et al. (2006) Xu, Y., Reid, M. J., Zheng, X. W., & Menten, K. M. 2006, Science, 311, 54
- Xu et al. (2013) Xu, Y., et al. 2013, ApJ, 769, 15
- Zhang et al. (2009) Zhang, B., Zheng, X. W., Reid, M. J., Menten, K. M., Xu, Y., Moscadelli, L., & Brunthaler, A. 2009, ApJ, 693, 419


| 4.5 µm | 5.8 µm | 8.0 µm | 12 µm | 22 µm | 24 µm |
|---|---|---|---|---|---|
 |
 |
 |
 |
 |
 |
| Survey | Wavelength | Longitudes Used | Latitudes Used | Resolution | Referencea |
|---|---|---|---|---|---|
| cm | arcsec | ||||
| MAGPIS | 6 | 4 | 1 | ||
| MAGPIS | 20 | 6 | 2 | ||
| VGPS | 21 | from to | 60 | 3 | |
| CGPS | 21 | 60 | 4 | ||
| NVSS | 20 | 45 | 5 | ||
| SGPS | 21 | 120 | 6 | ||
| SUMSS | 36 | 45 | 7 aafootnotetext: 1: Becker et al. (1994); 2: Helfand et al. (2006); 3: Stil et al. (2006); 4: Taylor et al. (2003); 5: Condon et al. (1998); 6: McClure-Griffiths et al. (2005); 7: Bock et al. (1999) |
| WISE Name | Cat. | Radius | HII Region Name | Membership | VLSR | Ref.a | |||||||
|---|---|---|---|---|---|---|---|---|---|---|---|---|---|
| deg. | deg. | arcsec. | deg. | deg. | |||||||||
| G029.95000.809 | K | 29.951 | 0.809 | 64 | G029.95100.800 | G029.95100.800 | 29.951 | 0.800 | 86.1 | 0.4 | 21.3 | 0.9 | 2 |
| G029.95400.788 | G | 29.954 | 0.787 | 29 | G029.95100.800 | ||||||||
| G029.95500.093 | G | 29.956 | 0.092 | 124 | G029.96000.020 | ||||||||
| G029.95600.020 | K | 29.956 | 0.019 | 94 | G029.96000.020 | G029.96000.020 | 29.956 | 0.017 | 91.3 | 0.1 | 32.2 | 0.3 | 10 |
| G029.95900.348 | Q | 29.959 | 0.348 | 37 | |||||||||
| G029.97000.412 | Q | 29.970 | 0.411 | 14 | |||||||||
| G029.97000.417 | Q | 29.970 | 0.416 | 14 | |||||||||
| G029.97500.835 | G | 29.975 | 0.835 | 72 | G029.95100.800 | ||||||||
| G029.976+00.547 | Q | 29.976 | 0.548 | 137 | |||||||||
| G029.978+00.020 | C | 29.979 | 0.021 | 30 | |||||||||
| G029.97900.587 | K | 29.980 | 0.587 | 219 | G030.00100.602 | 30.001 | 0.602 | 42.6;93.2 | 1.8;1.1 | 11.2;21.9 | 4.3;2.5 | 9 | |
| G029.997+00.072 | Q | 29.997 | 0.073 | 39 | |||||||||
| G030.00300.267 | C | 30.004 | 0.266 | 24 | |||||||||
| G030.00700.084 | G | 30.008 | 0.084 | 82 | G029.96000.020 | ||||||||
| G030.00900.274 | Q | 30.010 | 0.273 | 24 | |||||||||
| G030.014+00.017 | Q | 30.014 | 0.017 | 23 | |||||||||
| G030.015+00.025 | Q | 30.015 | 0.025 | 22 | |||||||||
| G030.02200.042 | K | 30.022 | 0.042 | 60 | G030.02200.044 | 30.022 | 0.044 | 94.9 | 0.1 | 21.7 | 0.1 | 2 | |
| G030.026+00.109 | K | 30.026 | 0.109 | 52 | G030.024+00.110 | 30.024 | 0.110 | 100.6 | 0.1 | 26.5 | 0.3 | 2 | |
| G030.030+00.005 | Q | 30.031 | 0.005 | 38 | |||||||||
| G030.03600.167 | K | 30.037 | 0.166 | 265 | G030.06900.160 | 30.069 | 0.160 | 98.2 | 1.7 | 32.1 | 4.1 | 8 | |
| G030.04200.144 | C | 30.043 | 0.143 | 48 | |||||||||
| G030.051+00.180 | C | 30.051 | 0.180 | 150 | |||||||||
| G030.05500.339 | C | 30.055 | 0.339 | 68 | |||||||||
| G030.057+00.077 | Q | 30.057 | 0.078 | 39 |