Electronic structure of CaFe2As2
Abstract
We investigate the electronic structure of CaFe2As2 using high resolution photoemission spectroscopy. Experimental results exhibit three energy bands crossing the Fermi level making hole pockets around the -point. Temperature variation reveal a gradual shift of an energy band away from the Fermi level with the decrease in temperature in addition to the spin density wave (SDW) transition induced Fermi surface reconstruction of the second energy band across SDW transition temperature. The hole pocket in the former case eventually disappears at lower temperatures while the hole Fermi surface of the third energy band possessing finite orbital character survives till the lowest temperature studied. These results reveal signature of a complex charge redistribution among various energy bands as a function of temperature that might be associated to the exotic properties of this system.
pacs:
74.70.Xa, 74.25.Jb, 71.20.-b, 79.60.-iI Introduction
Study of superconductivity has seen an explosive growth since the discovery of high temperature superconductivity in cuprates in 1986 cuprate . Discovery of superconductivity in Fe-based systems Kamihara1 ; Kamihara2 led to a resurgence of interest in this direction, where charge carrier doping in the parent compounds having spin density wave (SDW) states to superconductivity via suppression of long range magnetic order Iron-Pnictide . Interestingly, some of these Fe-based compounds also exhibit pressure induced superconductivity pres enhancing the complexity of the problems in these materials.
Among the Fe-based superconductors, Fe2As2 (A = Ca, Ba, Sr and Eu) class of materials known as ‘122’ compounds can be grown easily with high quality and they have been studied extensively in the recent past. These materials crystallize in the ThCr2Si2 type tetragonal structure at room temperature, (space group ). CaFe2As2 is one such compound exhibiting spin density wave (SDW) transition due to the long range magnetic ordering of the Fe moments at = 170 K along with a concomitant structural transition to an orthorhombic phase. High pressure pres , substitution of Fe by Co, NiThamiz and other dopants induces superconductivity in CaFe2As2 (transition temperature, 15 K). The SDW transition is found to accompany a nesting of the Fermi surface FSNesting ; dessau along with a transition from two dimensional (2D) to three dimensional (3D) Fermi surface associated with the structural transition 3Dto2D-Kaminskii ; Fink ; Fink-EPL10 . Fe 3 states play a major role in the electronic properties of these systems, while the doped holes in cuprates possess dominant ligand 2 orbital character cuprate . Clearly, the physics of high temperature superconductors is complex due to the significant differences among different classes of materials. In this article, we present our results on the electronic structure of CaFe2As2 obtained by high resolution photoemission spectroscopy and show the signature of interesting gradual change in the electronic structure with temperature that may be linked to the structural changes of these materials. Such knowledge would be useful to design new such materials with better specifications for potential applications.
II Experiment
High quality single crystals of CaFe2As2 were grown using Sn flux. The grown crystals are flat platelet like, which can be cleaved easily and the cleaved surface looked mirror shiny. The sample quality was verified by various characterization methods such as -ray diffraction (XRD) pattern and Laue pattern for determining the crystal orientation, and energy dispersive analysis of -rays (EDAX) for composition analysis. The XRD and Laue patterns were sharp and possess no spurious signal that confirmed good crystallinity of the sample. EDAX results showed the sample to be stoichiometric ensuring good sample quality. A sharp transition to spin density wave state is observed at 170 K in both magnetic and specific heat measurements.
Photoemission measurements were carried out using a Gammadata Scienta analyzer, R4000 WAL and monochromatic photon sources, Al ( = 1486.6 eV), He I ( = 21.2 eV) and He II ( = 40.8 eV) sources. The energy resolution and angle resolution were set to 2 meV and 0.3o respectively for ultraviolet photoemission (UP) studies and the energy resolution was fixed to 350 meV for -ray photoemission (XP) measurements. The temperature variation was carrier out using an open cycle helium cryostat, LT-3M from Advanced Research Systems, USA. The sample was cleaved in situ (base pressure 10-11 Torr) at each temperature several times to have a clean well ordered surface for the photoemission studies. Reproducibility of the data in both cooling and heating cycle was observed.
The energy band structure of CaFe2As2 was calculated using full potential linearized augmented plane wave method within the local density approximation (LDA) using Wien2k software wien2k . The energy convergence was achieved using 512 -points within the first Brillouin zone. In order to calculate the band structure for the paramagnetic phase, we used the lattice parameters of the tetragonal phase; = 3.906Å and = 12.124 Å.
III Results
An overview of the electronic structure involving the core levels and the valence band have been captured by -ray photoemission spectroscopy with an energy resolution of 350 meV. Fe 2 signal shown in Fig. 1(a) exhibits a highly asymmetric peak around 707 eV binding energy typical for metallic Fe-like behavior - the asymmetry arises due to the screening of the core holes in the photoemission final states and associated low energy excitations acker ; takahashi . As 3 spectra shown in Fig. 1(b) are also asymmetric exhibiting two distinct features around 40.9 and 41.6 eV binding energies due to the spin-orbit splitting. The feature at 44 eV binding energy is due to Ca 3 core level photoemission. The origin of the weak shoulder at about 40.4 eV binding energy can be attributed to the surface effects surf . Fe 2 and As 3 spectra at 10 K and 300 K are almost identical indicating unchanged Madelung potential and/or effective valency of Fe and As in the whole temperature range despite the structural transition from the tetragonal to orthorhombic phase at 170 K.
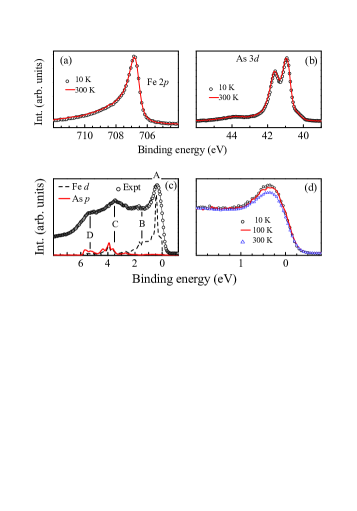
The valence band spectrum collected using Al photon source at 300 K is shown in Fig. 1(c). It exhibits four distinct features denoted by A, B, C and D. A remarkably good representation of the experimental spectrum is given by the energy band structure of the tetragonal CaFe2As2 calculated by employing full potential linearized augmented plane wave method within the local density approximation (LDA) using Wien2k software wien2k . The orbital polarization of the energy bands are obtained by projecting the eigen states onto the constituting electronic states, namely the Fe 3 and As 4 states in the present case. The calculated partial density of states (PDOS) shown by lines in the figure reproduce well the experimental spectrum. The feature A exhibits dominant Fe 3 character and the As 4 states contribute at higher binding energies. The hybridization between As 4 and Fe 3 states is found to be strong. The temperature evolution of the valence band is shown in Fig. 1(d). A normalization by the spectral intensities in the energy range beyond 1 eV binding energy exhibits a gradual enhancement of the feature A intensity with the decrease in temperature.
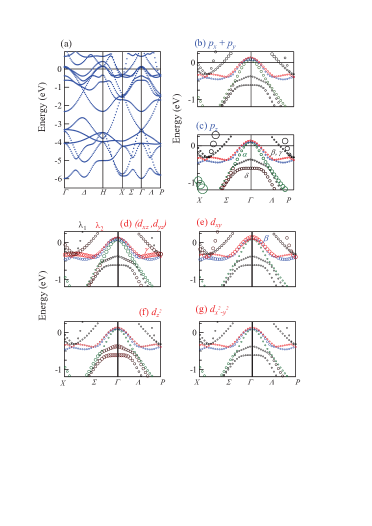
The details of the calculated energy bands and their orbital characters are shown in Fig. 2. The size of the symbols represents the orbital contributions. The energy bands near the Fermi level, exhibit significant dispersion ( 0.5 eV). Three bands denoted by , and cross around the point forming three hole-pockets. and bands form the electron pockets around the -point. Fig. 2(b) and 2(c) show finite As 4 contributions in these energy bands arising due to the Fe 3 - As 4 hybridizations. In Figs. 2(d) - 2(g), we show the (), , and contributions, respectively. and bands exhibit large () symmetry, while the band possesses primarily symmetry. states appear as bands shown in Fig. 2(f). The Fermi surfaces corresponding to and bands possessing similar symmetry are well nested.
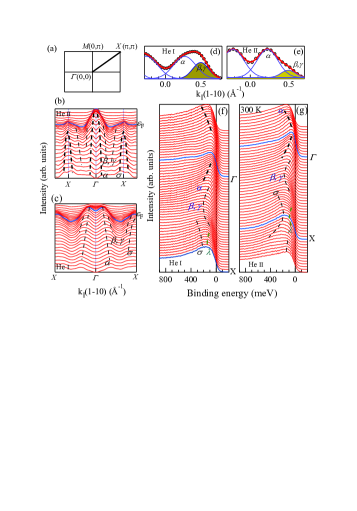
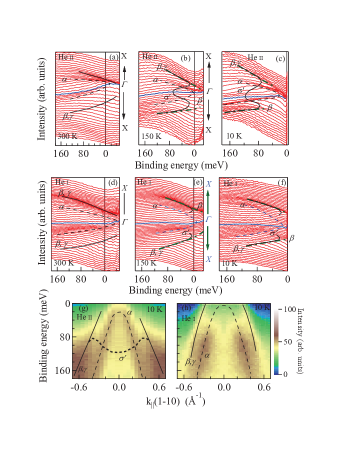
The momentum distribution curves (MDCs) along direction [see the Brillouin zone in Fig. 3(a)] obtained at 300 K exhibit significant differences when probed with He II and He I photon energies as shown in Figs. 3(b) and 3(c), respectively. Crystal structure of CaFe2As2 is tetragonal at 300 K and it exhibits an essentially two-dimensional Fermi surface 3Dto2D-Kaminskii . Thus, different photon energies differing in the values (9.5 for He I and 12.5 for He II) will have a weak influence on the energy position of the spectral features. In any case, the change in the relative intensity of the spectral features with the change in photon energy arises primarily due to the matrix element effect associated with the photo-excitation process that reflects the orbital character of the features yeh . The simulations of each of the MDCs require at least two peaks representing -band and ()-bands as shown in Figs. 3(d) and 3(e) for the MDCs at 140 meV binding energy. The large intensity of the -band in the He II-spectra and its reduction with respect to the intensity of ()-bands in the He I spectra suggests larger As 4-contribution in ()-bands relative to that in the -band. This behavior is consistent with the observation in other compounds in the same class of materials EuFe2As2 . The influence of the matrix element is also evident in the energy distribution curves (EDCs) shown in Figs. 3(f) and 3(g).
The , and bands form hole-pockets around the point at 300 K. The bands possessing -symmetry appear around 400 meV below . At -point, signature of the two bands denoted by and are observed in the figure. The band forms an electron pocket around -point. The bandwidth of the experimentally observed energy bands is significantly smaller than the calculated ones manifesting the signature of electron correlation induced effects in the electronic structure.
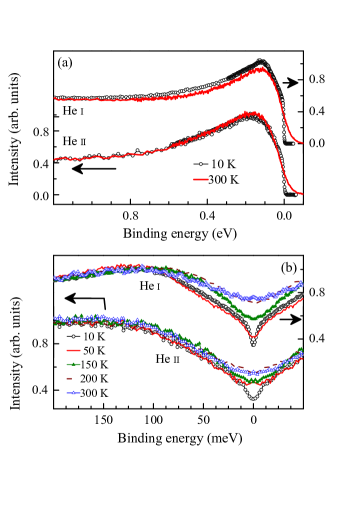
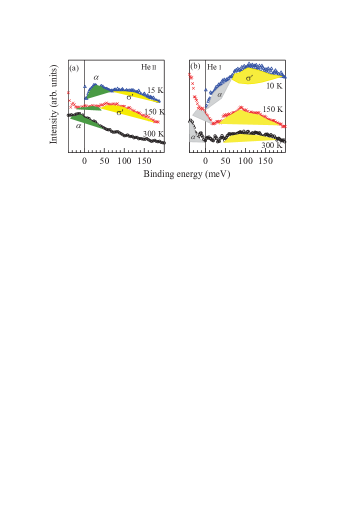
In order to investigate the temperature evolution of the electronic states at critically, we employed high energy resolution and the angle integrated mode for better signal to noise ratio (acceptance angle 15o) setting the -vector along the direction. In such a case, the intensity at will be contributed by the energy bands crossing the Fermi level. The photoemission spectra obtained by He I and He II photon energies at 10 K and 300 K are shown in Fig. 4(a). All the spectra are normalized by the intensity beyond 1 eV binding energy. The spectral changes are most profound in the He I spectra while the He II spectra exhibit modification essentially at . This is attributed to the higher degree of thermal sensitivity of the electronic states with orbital character relative to that of the character.
The spectral intensity at can be estimated quite accurately by symmetrization of the experimental spectra (; is the experimental spectrum). The symmetrized spectra at different temperatures, shown in Fig. 4(b), exhibit a jump in the intensity at across the SDW transition temperature in both He I and He II spectra as expected. Further lowering of temperature leads to an unusually sharp dip below 100 K although no phase/structural transitions have been reported in this temperature range.
The details of the changes can be found in the angle resolved data. The energy bands obtained by He I and He II excitations are shown in Fig. 5 along direction at 300 K, 150 K and 10 K. The spectra exhibit an interesting evolution across the SDW transition at 170 K. The signature of the hole pocket corresponding to the band distinctly seen in the 300 K He II spectra vanishes at 150 K with the top of the band appearing below . In addition, the intensity around 80 meV grows significantly in the 150 K data relative to the 300 K data suggesting SDW phase transition induced band-folding of the and bands consistent with the literature Lifschitz . Such folded band denoted by in the figure appears due to the nesting of the Fermi surfaces corresponding to the and bands in the SDW phase. The signature of the band is also observed in the He I spectra shown in Fig. 5(e). However, the hole pocket corresponding to the -band survives in the He I spectra (), which is different from the He II spectra (). This reflects the -dependence of the -band Fermi surface undergoing transition from the effective two dimensional nature of the Fermi surface to a three dimensional one with the -band hole pocket centering around and its absence around in the -plane containing axis 3Dto2D-Kaminskii ; dessau .
Further decrease in temperature reveals an unusual behavior; the band shifts further below in energy. The gradual energy shift is most evident in the spectral density of states (SDOS) obtained from He II spectra shown in Fig. 5(c), where the Fe 3 states contribution is significantly enhanced in the photoemission signal due to the matrix element effect. The top of the -band moves below the Fermi level at 10 K even in the He I spectra shown in Figs. 5(f) and 5(h) suggesting vanishing of the corresponding Fermi surface even at about 9.5, which is close to the middle of the -band hole pocket in reciprocal plane containing -axis. The -band still crosses , which is observed most prominently in the He I spectra indicating its large character.
IV Discussion
Treating electron correlation induced effects in the strongly correlated electron systems has been a major challenge in the contemporary condensed matter physics. It is observed that the spectral functions obtained by the dynamical mean field theory often provide a good description of the experimental scenario RMP1 ; RMP2 . Within this description, the spectral function of a correlated system in the intermediate coupling regime consists of three features; upper (unoccupied) and lower (occupied) Hubbard bands representing the correlation induced localized states and a central band at the Fermi level, termed as the coherent feature representing the itinerant carriers often captured well by the ab initio band structure calculations csvo . The decrease in temperature leads to an enhancement of the coherent feature intensity at the cost of the Hubbard band intensities RMP1 ; ruth . The temperature induced changes in the valence band shown in Fig. 1 exhibit quite similar scenario, where the intensity at the Fermi level, well reproduced in the band structure calculations, increases in intensity relative to the intensities at higher binding energies with the decrease in temperature. Effect of the electron correlation is also manifested by the narrowing of the energy bands shown in Fig. 3.
We calculated the effective mass, ( = mass of an electron) corresponding to and bands, and found it to be 1.4 and 3.2, respectively at 300 K suggesting moderate mass enhancement due to electron correlation induced effects supporting the above view. The energy bands close to the Fermi level are the antibonding bands arising due to the hybridization between Fe 3 and As 4 states. While these eigen states possess large Fe 3 character, As 4 contributions appear to be significant, which is observed in the band structure results shown in Fig. 2 and comparison of the experimental He I & He II spectra shown in Fig. 3. Since the As layers are above and below the Fe-layers, the hybridization of As states with the Fe states will be strong and plays an important role in the SDW phase transition. This is manifested via the nesting of the Fermi surface corresponding to the and bands possessing () symmetry. Signature of the Fermi surface nesting observed in the present results is consistent with the earlier studies. The importance of the coupling of the electronic states with the lattice degrees of freedom has been found in this class of compounds via inverse isotope effect Shirage , spin-phonon coupling CaFeAsSood ; FeAsSood , phonon softening CaFeAsOFSood , sensitivity of the SDW phase to the anomalous phonon dispersion phonon-mittal etc. The photoemission and band structure results provide a direct evidence of the importance of the hybridization and the electron correlation effects in the electronic properties of these systems.
At 150 K, which is below the SDW transition temperature, the top of the band appears below in the He II spectra () while it is still crossing in the He I spectra (). This suggests a -dependence of the -band Fermi surface, which is a signature of the three dimensionality of the Fermi surface consistent with the earlier findings 3Dto2D-Kaminskii . Such dependence can be attributed to the structural transition from tetragonal to orthorhombic phase occurring at the same SDW transition temperature. While energy bands at 300 K are narrower than their band structure results due to electron correlation induced effects, the spectra at 10 K exhibit further narrowing of the dispersions. We calculated the effective mass, corresponding to and bands and found it to increase to 2.6 and 4.3 at 10 K, respectively. This suggests that the electrons acquire more local character at lower temperatures.
Interestingly, the band shifts below at 10 K even in the He I spectra as shown in Fig. 5. This is unusual as the He I energy corresponds to the value close to the middle of the -band hole pocket. In order to exemplify this point, we compare the EDCs at point at different temperatures obtained by He I and He II photon energies in Fig. 6 exhibiting distinct signature of a gradual shift of the band with the decrease in temperature. Sharp dip observed in the high resolution spectra may be attributed to the shift of the band completely below which means that the -band Fermi surface disappears around 10 K.
Two conclusions can be drawn from the above results. (i) Although the structural transition from tetragonal to orthorhombic phase occurs at the onset of SDW phase transition, the transition is slow with the coexistence of two structural phases in the intermediate temperature range as observed in other systems such as manganites bindu . (ii) The second observation is the signature of the vanishing of the Fermi surface corresponding to the band and its consequences on the energy band, that crosses the Fermi level in order to preserve charge count.
It is to note here that Lifshitz transition, a transition from a hole-type Fermi surface to electron-type Fermi surface or vice versa due to subtle change in charge carrier concentration has been found to be important in cuprates thomas as well as in electron doped Ba(Fe1-xCox)2As2 Lifschitz . Evidently, such Fermi surface reconstruction seem to be important in CaFe2As2 too suggesting a generic nature of such an effect in the unconventional superconductors. It is to be noted here that a homologous system, SrFe2As2 srfe2as2 exhibits large volume fraction of superconducting region even at ambient pressure if the prepared sample possess significant structural strain. In CaFe2As2, it is observedpres that a quasi-hydrostatic pressure leads to superconductivity suggesting the importance of structural strain for such exotic ground state.
V Conclusions
In summary, we have studied the evolution of the electronic structure of CaFe2As2, a parent compound of the Fe-based superconductors employing high resolution photoemission spectroscopy. We discover a sharp dip at the Fermi level appearing much below the SDW transition temperature in addition to the dip associated with the SDW transition. Angle resolved photoemission results exhibit signature of a gradual shift of the band with the decrease in temperature - the hole pocket corresponding to the band vanishes near 10 K indicating renormalization of the band hole pocket to preserve charge count. These results, thus, reveal signature of interesting Fermi surface reconstructions in these complex systems that might be responsible for exotic properties of these materials.
VI Acknowledgements
The authors, K. M. and N. S. acknowledge financial support from the Department of Science and Technology, Government of India under the ‘Swarnajayanti Fellowship programme’. K. M. acknowledges the Department of Atomic Energy, Government of India for financial support.
References
- (1) A. Damascelli, Z. Hussain, and Z. X-. Shen, Rev. Mod. Phys. 75, 473 (2003).
- (2) Y. Kamihara et al. J. Am. Chem. Soc. 128, 10012 (2006).
- (3) Y. Kamihara, T. Watanabe, M. Hirano, and H. Hosono, J. Am. Chem. Soc. 130, 3296-3297 (2008).
- (4) K. Ishida, Y. Nakai, and H. Hosono, J. Phys. Soc. Jpn. 78, 062001 (2009).
- (5) T. Park et al., J. Phys.: Condens. Matter 20, 322204 (2008); H. Lee et al., Phys. Rev. B 80, 024519 (2009); S.-H. Baek et al., Phys. Rev. Lett. 102, 227601 (2009).
- (6) N. Kumar et al., Phys. Rev. B 79, 012504 (2009); N. Kumar, et al. Phys. Rev. B 80, 144524 (2009).
- (7) T. Kondo, et al. Phys. Rev. B 81, 060507(R), (2010).
- (8) Q. Wang, et al. arXiv:1009.0271v1.
- (9) C. Liu, et al. Phys. Rev. Lett. 102, 167004 (2009).
- (10) S. Thirupathaiah, et al. Phys. Rev. B 84, 014531 (2011).
- (11) S. de Jong, et al. Europhys. Letts. 89, 27007 (2010).
- (12) P. Blaha, K. Schwarz, G. K. H. Madsen, D. Kvasnicka, and J. Luitz, [WIEN2k An Augmented Plane Wave + Local Orbitals Program for Calculating Crystal Properties] [Schwarz, K. (ed.)] (Techn. Universität Wien, Austria, 2001).
- (13) J. F. van Acker, et al. Phys. Rev. B 37, 6827 (1988).
- (14) M. Takahashi and J.-I. Igarashi, Phys. Rev B 85, 085128 (2012).
- (15) S. Thakur, et al. J. Appl. Phys. 114, 053904 (2013); S. Patil, G. Adhikary, G. Balakrishnan, and K. Maiti, Solid State Commun. 151, 326-328 (2011); K. Maiti, et al. Phys. Rev. B 73, 052508 (2006); ibid. Phys. Rev. B 70, 195112 (2004).
- (16) J. J. Yeh and I. Lindau, At. Data and Nucl. Data Tables 32, 1 (1985); as observed in varieties of oxides - for example, K. Maiti, P. Mahadevan, and D. D. Sarma, Phys. Rev. B 59, 12457 (1999); K. Maiti and D. D. Sarma, Phys. Rev. B 58, 9746 (1998).
- (17) G. Adhikary, et al. J. Phys.: Condens. Matter 25, 225701 (2013).
- (18) C. Liu, et al. Nat. Phys. 6, 419 (2010).
- (19) A. Georges, G. Kotliar, W. Krauth, and M. J. Rozenberg, Rev. Mod. Phys. 68, 13 (1996);
- (20) M. Imada, A. Fujimori, and Y. Tokura, Rev. Mod. Phys. 70, 1039-1263 (1998).
- (21) K. Maiti, et al. Europhys. Letts. 55, 246-252 (2001).
- (22) K. Maiti, R. S. Singh, and V. R. R. Medicherla, Europhys. Lett. 78, 17002 (2007)
- (23) P. M. Shirage, et al. Phys. Rev. Lett. 103, 257003 (2009).
- (24) P. Kumar, et al. J. Phys.: Condens. Mater 23, 255403 (2011).
- (25) P. Kumar, et al. Solid State Commun. 150, 557 (2010).
- (26) P. Kumar, et al. J. Phys.: Condens. Mater, 22, 255402 (2010).
- (27) R. Mittal, et al. Phys. Rev. Lett. 102, 217001 (2009).
- (28) R. Bindu, et al. Phys. Rev B 86, 140104(R) (2012); ibid., Phys. Rev. B. 84, 052407 (2011); ibid., New J. Phys. 12, 033026 (2010).
- (29) K. -S. Chen, Z. Y. Meng, T. Pruschke, J. Moreno, and M. Jarrell, Phys. Rev. B 86, 165136 (2012).
- (30) S. R. Saha, N. P. Butch, K. Kirshenbaum, J. Paglione, and P. Y. Zavalij, Phys. Rev. Lett. 103, 037005 (2009).