Characterizing faint galaxies in the reionization epoch: LBT confirms two sources at behind the CLASH/Frontier Fields cluster MACS0717.5+3745
Abstract
We report the LBT/MODS1 spectroscopic confirmation of two images of faint Lyman alpha emitters at behind the Frontier Fields galaxy cluster MACSJ0717.5+3745. A wide range of lens models suggests that the two images are highly magnified, with a strong lower limit of . These are the faintest candidates spectroscopically confirmed to date. These may be also multiple images of the same source as supported by their similar intrinsic properties, but the lens models are inconclusive regarding this interpretation. To be cautious, we derive the physical properties of each image individually. Thanks to the high magnification, the observed near-infrared (restframe ultraviolet) part of the spectral energy distributions and lines are well detected with and . Adopting , the absolute magnitudes, , and fluxes, are fainter than and , respectively. We find a very steep ultraviolet spectral slope (), implying that these are very young, dust-free and low metallicity objects, made of standard stellar populations or even extremely metal poor stars (age Myr, E(B-V)=0 and metallicity ). The objects are compact (), and with a stellar mass . The very steep , the presence of the line and the intrinsic FWHM () of these newborn objects do not exclude a possible leakage of ionizing radiation. We discuss the possibility that such faint galaxies may resemble those responsible for cosmic reionization.
Subject headings:
dark ages, reionization, first stars — cosmology: observations — galaxies: formation1. Introduction
The investigation of the distant Universe and the processes that led to the reionization of the intergalactic medium, are amongst the major goals of observational cosmology (Robertson et al. 2010). While there are tens (a few) spectroscopic confirmations of galaxies at redshift 6(7) (e.g., Vanzella et al. 2009, 2011), accessing the faint-luminosity regime down to remains challenging even with 8-10m class telescopes, especially for . Before the advent of next generation observatories like JWST and the extremely large telescopes, the only viable way to pursue extremely faint distant objects, and investigate the nature of their stellar populations (even PopIII), is to exploit strong lensing magnification (e.g., Zackrisson et al. 2012, 2013). To this aim, Bradley et al. (2013) (B13, hereafter) selected magnified candidate galaxies at redshift 6 – 8 fully exploiting the 16-bands photometry of the CLASH survey (Postman et al. 2011), and found agreement down to mag with the UV luminosity functions of blank fields. After the completion of the CLASH program, the investigation of the high-z universe is now continuing with the ultradeep HST Frontier Fields campaign (FF hereafter), that includes four CLASH galaxy clusters111http://www.stsci.edu/hst/campaigns/frontier-fields/.
Accessing the faint luminosity regime () at is crucial in the context of cosmic reionization (e.g., Fontanot et al. 2013): faint galaxies dominate the global ultraviolet luminosity density (Bouwens et al. 2007) and possibly have an escape fraction of ionizing radiation larger than the brighter counterparts (e.g., Ferrara & Loeb 2013; Yajima et al. 2011).
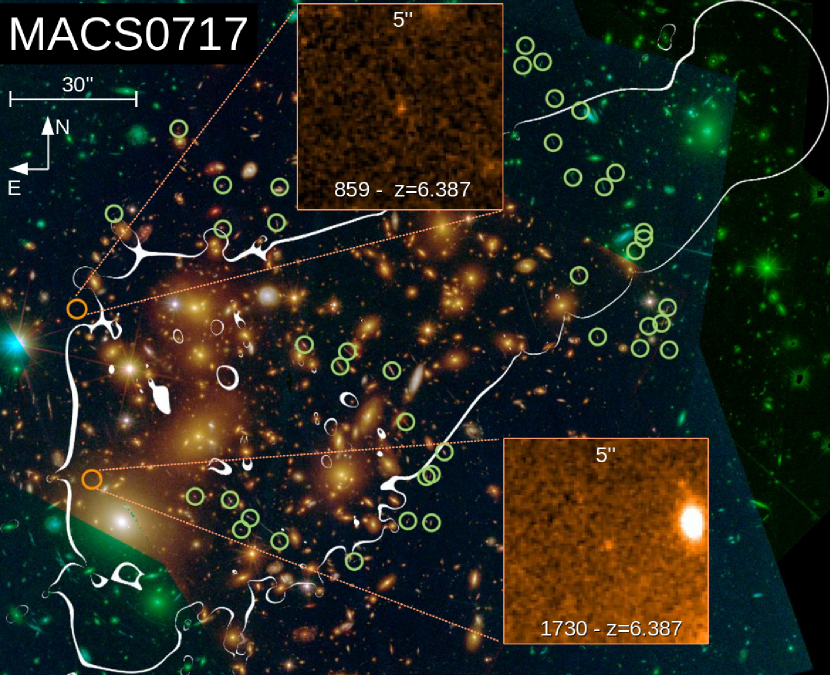
Here we report on the LBT/MODS1 spectroscopic confirmation of two faint sources, significantly magnified by the FF galaxy cluster MACSJ0717.5+3745 (Ebeling et al. 2007), study their physical properties, and discuss the contributions of such objects to the reionization of the IGM.
Throughout this paper a concordance CDM cosmology with , and km s-1 Mpc-1 is adopted, and magnitudes are in AB scale.
1.1. Target selection and magnification
B13 selected 15 magnified galaxy candidates behind the FF galaxy cluster MACSJ0717.5+3745, by using their drop-out features and corresponding photometric redshift estimate. We report here the spectroscopic observations of two candidates from their sample, macs0717_0859 and macs0717_1730 (859 and 1730 for short, hereafter), with photometric redshifts of and , respectively. The magnifications reported in B13 were (859) and (1730) (i.e. the latter unconstrained since the object is too close to the critical curves). The magnification estimates were based on the revised lens model by Zitrin et al. (2009; see also Medezinski et al. 2013) who first performed the strong-lensing analysis for this cluster, uncovering that is the largest magnifying lens known to date (see Figure 1). Here we have also estimated the magnifications from several other lens models made for the Frontier Fields program (including a refurbished version of the Zitrin et al. model used in B13), by running the Magnification Calculator available online. 222http://archive.stsci.edu/prepds/frontier/lensmodels/ The estimate from different groups, methods and assumptions span the range between 5 and 70, with some solutions even higher than 100 within the 68% confidence interval. The medians among the different models are: for 1730 and for 859, where statistical and systematic errors (in parentheses) are quoted. The models for this lens are still not fully constrained in the regions where the two are detected, both due to proximity to the critical curves, and, lack of multiple-images constraints nearby. We also acknowledge the possibility that the two sources presented here are actually counter images of a single background galaxy, as some of the models provided by the different groups predict counter images within few, to dozen arcseconds, from the location of the other object. We did not detect, however, any additional counter images where the models predict them (although possibly, due to lesser magnification where other images are predicted).
As not all models predict counter images, and predicted counter images were not identified in the data, it cannot be unambiguously determined if indeed the two objects are images of the same source. What is relevant here, though, is the agreement among the different models that the sources are strongly magnified (), and the single or double nature does not alter our findings on the derived physical properties. In the following, to be most conservative, we derive rest-frame quantities by adopting for both sources, and express the results in terms of .
2. Data and sample selection
2.1. Spectroscopic observations with LBT/MODS1
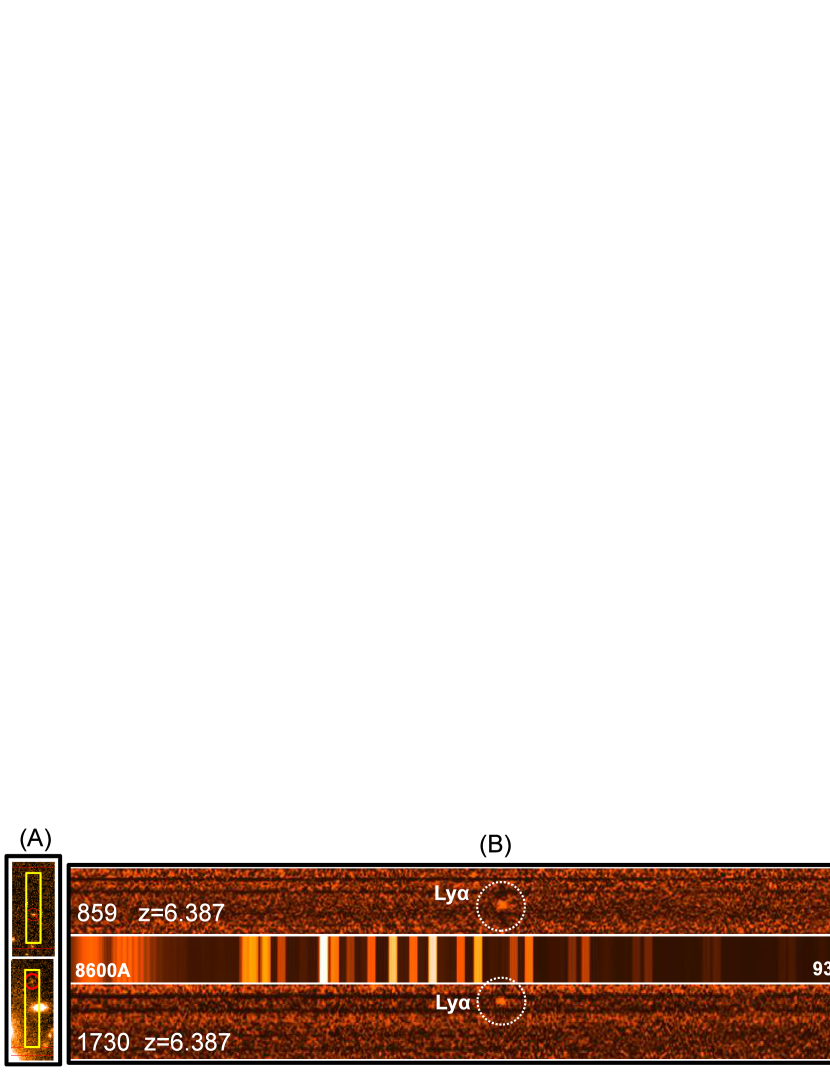
The spectroscopic observations have been performed in dual mode with the MODS1 instrument at the LBT, that exploits the two red (5800-10300Å) and blue (3200-6000Å) channels, yielding a total spectra coverage from 3200 to 10300Å on source. The red G670L and blue G400L grisms with a slit width of have been adopted, providing a spectral resolution of for both. Science frames of 1200s have been acquired with a dithering pattern of shift along the slit for a total integration time of 16800s for 859, and 11200s for 1730. The average seeing conditions were . Data reduction has been performed with the MODS1 spectroscopic reduction pipeline based on VIPGI tasks (Scodeggio et al. 2005).333http://lbt-spectro.iasf-milano.inaf.it/pipelinesInfo/ In the two slits located on 859 and 1730, two emission lines are clearly detected at 8980Å and 8981Å, respectively, with observed fluxes of (with ) and (with ), respectively (see Figures 2 and 3).
3. Results
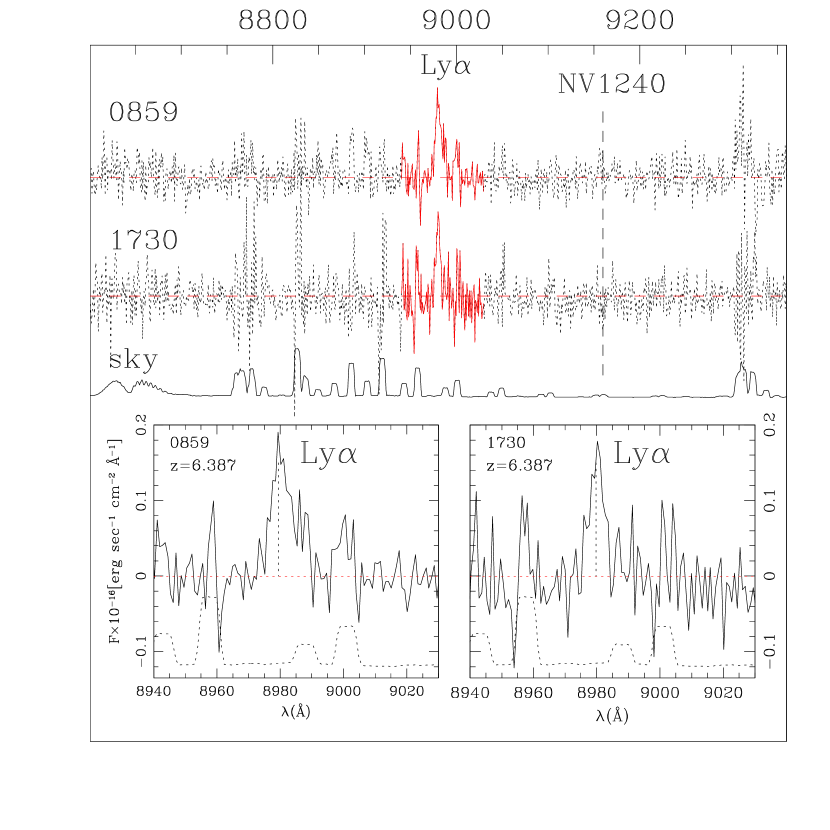
Nature of the lines: The large spectral coverage (Å) allows us to exclude low redshift solutions like at or [O iii] at , that would be in contrast with the single line detection. The only possible degeneracy is among [O ii] and . However, [O iii] can be reliably excluded because of the following reasons: (1) the doublet [O ii] is resolved in the present observations (see an example in Figure 2, panel C) and (2) the observed equivalent width (see below) of the lines is not compatible with the typical values observed at , i.e., they are too large (e.g., Vanzella et al. 2009 and their Fig. 12). Moreover, source 859 shows an asymmetric line profile toward the red wavelengths (Figure 3), that is typical of this transition at high redshift. The spectrum of 1730 is slightly shallower (11200s) and noisier than 859 (close to the edge of the slit), and prevents us from detecting the asymmetric shape, but the line width and the equivalent width are not consistent with the [O ii] doublet.
Therefore we conclude that the two emission lines are at the same redshift . The striking accordance of the two redshifts may add support to the hypothesis that these two objects are multiple images of the same background source. If confirmed, this could provide further constraints to the lens model and therefore deserves future investigation and lens remodeling, which is out of the scope of the present work. In the following we assume that these are two individual objects and look at the properties of each of them separately.
Rest frame UV continuum luminosity at 1500Å: As mentioned above the wide spread on the magnifications allow us to identify an interval of possible luminosities. Given the observed Y105 magnitudes (Å) of for 859 and for 1730, the two sources have unlensed luminosities of , adopting from Bouwens et al. (2007). Even in the more conservative case (), these are the faintest spectroscopically confirmed sources at these redshifts with such a high signal to noise (Balestra et al. 2013; Bradac et al. 2012; Schenker et al. 2012).
Equivalent widths and FWHM of the lines: The continuum is not detected in the spectra. Therefore, we derive the continuum level under the transition by using the closest HST band not including the line (Y105), and correcting for the UV slope (see below). The rest-frame EWs of 859 and 1730 are Å and Å, respectively. These are typical values if compared with those observed at similar redshifts among Lyman break galaxies or emitters (Stark et al. 2011). The observed FWHM of the lines is also modest, after correcting for the instrumental profile they are .
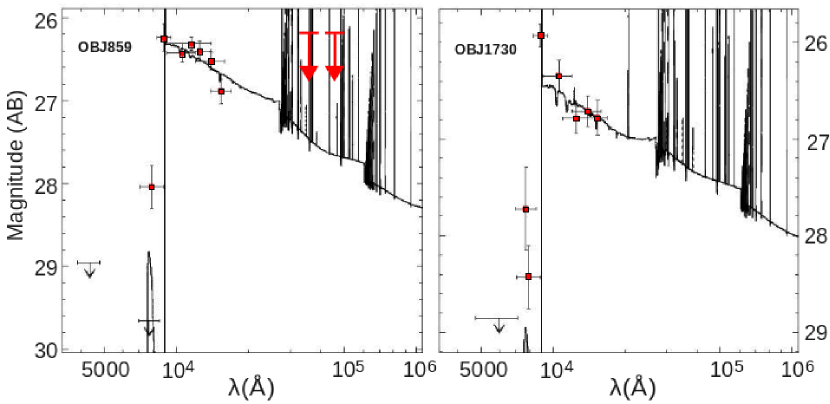
Ultraviolet spectral slope (): Following Castellano et al. (2012) and Bouwens et al. (2013), ultraviolet spectral slopes have been estimated by fitting the near infrared WFC3 magnitudes redward the line, using the Y105, J125, F140W and H160 bands (for 859 the F110W band was also available and has been included in the fit). Being achromatic, strong lensing is not affecting the colors of the sources. The measured slopes for 859 and 1730 are very steep, and . Interestingly, this similarity is again consistent with the option that these two objects are multiple images. While the source 1730 is close to a bright galaxy and its photometry has to be taken with caution, source 859 is isolated and with reliable colors (Figure 2). As noted by Z13, the possible presence of the 2175Å dust feature may interfere with the estimate of the UV slope. However, we tend to exclude this possibility on the basis of the redshift and the emission lines that favor a low dust attenuation.
Size of the sources: As reported in B13, the two sources are resolved in the HST/WFC3 images. Their isophotal areas (provided by SExtractor) converted into physical units are 0.8and 0.7sq.kpc. If they are two distinct objects, we estimate a proper separation of 30 kpc in the source plane at , for the range of models described in §1.
AGN activity: At the expected N V line is not detected (see Figure 3). The 1-sigma upper limit N V is (typical value for AGNs is 10%, Alexandroff et al. 2013). Considering the above ratio, that only 5% of high redshift LAEs are possible AGNs (Malhotra et al. 2003), and that they are spatially resolved, we conclude the emission is due to star formation activity.
| Quantity | macs0717_0859 | macs0717_1730 |
|---|---|---|
| R.A. (J2000) | 07:17:38.18 | +37:45:16.9 |
| Decl. (J2000) | 07:17:37.85 | +37:44:33.7 |
| Redshift | 6.387() | 6.387() |
| Y105(observed) | 26.42() | 26.34() |
| H160(observed) | 26.88() | 26.78() |
| H160(unlensed) | 28.63+2.5 | 28.53+2.5 |
| -3.02() | -3.01() | |
| 1.6 [1-3] | 2 [1-5] | |
| 1.2 [1.0-1.4] | 1 [0.8-1.2] | |
| 4 [2-12] | 2 [2-22] | |
| E(B-V) | 0.0 [0.0-0.06] | 0.0 [0.0-0.1] |
| age (Myr) | 25 [10-100] | 10 [10-250] |
| Met. () | 0.02 | 0.2 |
| M1500 | -18.63+2.5 | -18.70+2.5 |
| 0.22 | 0.24 | |
| Area (sq.kpc) | 0.8 | 0.7 |
| fwhm()() | 100 [70-130] | 140 [100-180] |
| ()(Å) | 45 [38-53] | 32 [22-42] |
| flux() | 2.8 [2.6-3.0] | 2.0 [1.8-2.3] |
Note. — fluxes are in units of . Physical properties refer to BC03 models with nebular emission and the associated 68% intervals (in parentheses) correspond to models with probabilities higher than 0.68. The SFR() has been derived adopting the Kennicutt (1998) conversion. Quantities related to do not include possible IGM absorption. corresponds to .
4. Discussion and Conclusions
As described above, the two discovered sources (or a single one in the case of multiple images) are the faintest galaxies at ever observed with a spectroscopic redshift confirmation and well detected lines and SEDs. The investigation of new luminosity regimes through the strong-lensing magnification gives the opportunity to explore possible new physical conditions.
4.1. Nature of the stellar populations
We examine their rest–frame properties through a SED analysis. We first derive physical parameters assuming ordinary stellar populations, i.e. by comparing the observed SED with a set of Bruzual & Charlot (2003) templates (BC03), assuming Salpeter IMF, metallicity of 0.02, 0.2, 1.0 , and E(B-V) spanning the range [0.0 – 1.0]. The current 1- lower limits from IRAC (3.6m and 4.5m channels) for 859 are AB, too shallow to provide solid constraints on [O iii]+ and nebular emissions. The other source 1730 is contaminated by close brighter galaxies. The SED fitting with BC03 includes nebular line and continuum emission following Schaerer & de Barros (2009) (see Castellano et al. 2014 for further details). The output of this exercise is listed in Table 1. Regardless of the adopted , the two sources turn out to be very small ( 1 sq.kpc), with low SFRs () and low stellar masses of . The properties related to colors (i.e., independent from the magnification ), such as dust attenuation, age, and metallicity, are consistent with newborn objects. Adopting the standard Kennicutt conversions (Kennicutt 1998) and correcting for the IGM attenuation of photons (e.g., %, Dijkstra & Jeeson-Daniel 2013), we obtain SFR()SFR(UV), where SFR(UV) is derived from the SED fit. This is indicative of ages Myr, E(B-V) (Verhamme et al. 2008) and () close to unity (Atek et al. 2008, 2013).
The SEDs can be reproduced with ordinary stellar populations, albeit the best solutions typically lie close to the edge of the parameter space (e.g., Z, age and E(B-V)). Fixing , the resulting ages are forced to the minimum value, Myr. For this reason it is interesting to extend the investigation toward a possible presence of younger and/or extremely metal poor (EMP, ) and PopIII stars (). For this purpose we consider the SED fitting and the predicted HST/WFC3 colors provided by Raiter et al. (2010), Inoue et al. (2011) and Zackrisson et al. (2013), (R10, I11 and Z13, respectively), that also include nebular contribution. The observed UV slope is compatible either with very young, but still standard (PopII) stellar populations (BC03), or with EMP/PopIII stars. In particular, 859 (with the most reliable photometry) has a that is consistent with an age Myr if or an age Myr if (as shown in I11, Fig. 11). 444We note that the probability to observe a galaxy of a few Myr old is generally small, because of its short time. Similarly, compared with the models of Z13, the UV slope is compatible with metal poor stars if ages are Myr, and even PopIII if compared with R10 (assuming we are observing the stellar component). Conversely, the observed EWs would suggests that we are dealing with standard stellar populations, given that PopIII stars are often associated with Å rest-frame (Schaerer et al. 2003; R10; I11). A large IGM attenuation of the line (%) could hide a intrinsic EWÅ, making it still compatible with the PopIII interpretation. However the influence of the IGM is highly uncertain here (see also Laursen et al. 2011; Dayal et al. 2011; Dijkstra & Jeeson-Daniel 2013). Another possibility is that the EW could be lowered for extremely metal poor () and even PopIII () galaxies if (Z13). For example, I11 found a EW of Å for and 10Myr constant star formation, when .
While it is hard to make definitive statements about the populations content of these sub-luminous galaxies given the current information we have about them, we observe that they are overall less evolved than their more massive counterparts and their very blue UV colors could be explained even without having to invoke PopIII stars, although we certainly cannot exclude their presence in the stellar populations (e.g. Finkelstein et al. 2010). These kind of galaxies could be examples of very low chemical enrichment, dust-free systems, barely higher than the pristine gas that is probably still feeding their activity of star formation.
4.2. Cosmic reionization
Regardless of the nature of the stellar populations, the potential role these sources have in the framework of cosmic reionization is intriguing. It is believed that the abundant, fainter galaxies () could significantly contribute to, or even be the dominant populations in, providing the ionizing radiation (e.g., Fontanot et al. 2013; Ferrara & Loeb 2013; Yajima et al. 2011; Razoumov & Sommer-Larsen 2010; but see Gnedin et al. 2008).
The direct measure of the escape fraction of ionizing radiation () is in principle possible at . At higher redshifts the measurement is unfeasible due to the complete IGM attenuation of the Lyman continuum. Nonetheless it is worthwhile to investigate each of the main components that build the quantity. As discussed in Vanzella et al. (2012), the parameter is the product of the gas transmission and the dust transmission . To first order, Lyman continuum emitters should have both low dust content and low optical depth . Interestingly, the two sources described in this letter could match such requirements. First, given the very steep UV continuum the term related to dust attenuation is significantly higher than zero (, as reported in Siana et al. (2007) by extrapolating the Calzetti extinction law down to the Lyman continuum, if E(B-V)=0). Second, even though addressing the gas attenuation in the interstellar medium with current data is admittedly less reliable, it is worth noting that the presence of emission would not be in contrast with a . As discussed in Nakajima & Ouchi (2013), the EW() remains almost unchanged if is . If the IGM is attenuating % of the line (Dijkstra & Jeeson-Daniel 2013), the resulting intrinsic FWHM () would be in line with possible low HI column density in front of the stars (Schaerer et al. 2011). The reason is that resonance scattering is less effective if is low, and photons escape easily along the shorter path, decreasing the FWHM. Moreover, the observed UV slope could also indicate a deficit of nebular continuum, allowing the stellar component to emerge in the observed SED (i.e., , R10, I11, Z13). This, could, in turn, be the telltale of efficient feedback in these systems, capable of either sweeping away or ionize a significant fraction of the gas surrounding the stars, a mechanism advocated by theoretical models in low–mass halos to self-regulate star formation. As a consequence, a proportionally higher fraction of ionizing radiation could be leaking out of these systems () compared to their more massive counterparts and be available to keep the IGM ionized.
Regarding the single or multiple nature of the sources, the similarity in the physical and observed characteristic we derived in this work, would support they are multiple images of a single background galaxy, but the different mass models we examined remain inconclusive regarding this option.
As discussed in Zackrsson et al. (2012) and Z13, such galaxies represent the ideal candidates for future near- and mid-infrared spectroscopic observations, especially in the investigation of the interplay between the UV slopes and the equivalent width of lines, and its relation to the parameter. Future facilities such as JWST and extremely large telescopes will address this issues.
References
- Alexandroff et al. (2013) Alexandroff, R., Strauss, M. A., Greene, J. E., Zakamska, N. L., Ross, N. P., Brandt, W. N., Liu, G.; Smith, P. S.; Ge, J., et al., 2013, MNRAS, 435,3306
- Atek et al. (2008) Atek, H., Kunth, D., Hayes, M., Ostlin, G., & Mas-Hesse, J. M. 2008, A&A, 488, 491
- Atek et al. (2013) Atek, H., Kunth, D., Schaerer, D., Mas-Hesse, J. M., Hayes, M., Ostlin, G., Kneib, J.-P., 2013, (arXiv1308.6577), ApJ, in press
- Balestra et al. (2013) Balestra, I., Vanzella, E., Rosati, P., Monna, A., Grillo, C., Nonino, M., Mercurio, A., Biviano, A., Bradley, L., Coe, D., et al., 2013, A&A, 559, 9
- Bouwens et al. (2007) Bouwens, R. J., Illingworth, G. D., Franx, M., Ford, H., 2007, ApJ, 670, 928
- Bouwens et al. (2013) Bouwens, R. J., Illingworth, G. D., Oesch, P. A., Labbe, I., van Dokkum, P. G., Trenti, M., Franx, M., Smit, R., Gonzalez, V., Magee, D., 2013, (arXiv1306.2950), ApJ, in press
- Bradac et al. (2012) Bradac, M., Vanzella, E,, Hall, N., Treu, T., Fontana, A., Gonzalez, A. H., Clowe, D., Zaritsky, D., Stiavelli, M., Clement, B., 2012, ApJ, 755, 7
- Bradley et al. (2013) Bradley, L. D., Zitrin, A., Coe, D., Bouwens, R., Postman, M., Balestra, I., Grillo, C., Monna, A., Rosati, P., et al., (arXiv:1308.1692), ApJ, in press
- Bruzual & Charlot (2003) Bruzual, G., & Charlot, S. 2003, MNRAS, 344, 1000
- Dayal et al. (2011) Dayal, P., Maselli, A., Ferrara, A., MNRAS, 2011, 410, 830
- Dijkstra & Jeeson-Daniel (2013) Dijkstra,M. & Jeeson-Daniel, A., 2013, MNRAS, 435, 3333
- Castellano et al. (2012) Castellano, M., Fontana, A., Grazian, A., Pentericci, L., Santini, P., Koekemoer, A., Cristiani, S., Galametz, A., et al., 2012, A&A, 540, 39
- Ebeling et al. (2007) Ebeling, H., Barrett, E., Donovan, D., Ma, C.-J., Edge, A. C., van Speybroeck, L., 2007, ApJ, 661, 33
- Ferrara & Loeb (2013) Ferrara, A., Loeb, A., 2013, MNRAS, 431, 2826
- Fontanot et al (2013)
- Finkelstein et al. (2010) Finkelstein, S. L.; Papovich, C.; Giavalisco, M., Reddy., N. A., Ferguson, H. C., Koekemoer, A. M.; Dickinson, M., 2010, ApJ, 719, 1250 Fontanot, F., Cristiani, S., Pfrommer, C., Cupani, G., Vanzella, E., 2013, (arXiv1312.0615), MNRAS, accepted
- Gnedin et al. (2008) Gnedin, N. Y., Kravtsov, A. V., Chen, H-W, 2008, ApJ, 672, 765
- Kennicutt (1998) Kennicutt, Jr., R. C. 1998, ARA&A, 36, 189
- Inoue (2011) Inoue, Akio K., 2011, MNRAS, 415, 2920
- Limousin et al (2012) Limousin, M., Ebeling, H., Richard, J., Swinbank, A. M., Smith, G. P., Jauzac, M., Rodionov, S., Ma, C.-J., et al., 2012, A&A, 544, 71
- Laursen et al. (2011) Laursen, P., Sommer-Larsen, J., Razoumov, Alexei O., 2011, ApJ, 728, 52
- Malhotra et al. (2003) Malhotra, S., Wang, J. X., Rhoads, J. E., Heckman, T. M., Norman, C. A., 2003, ApJ, 585, 25
- Medezinski et al. (2013) Medezinski, E., Umetsu, K., Nonino, M., Merten, J., Zitrin, A., Broadhurst, T., Donahue, M., Sayers, J., Waizmann, J.-C., et al., 2013, ApJ, 777, 43
- Nakajima & Ouchi (2013) Nakajima, K., Ouchi, M., 2013, (arXiv1309.0207), MNRAS, in press
- Postman et al. (2012) Postman, M., Coe, D, Ben tez, N., Bradley, L., Broadhurst, T., Donahue, M., Ford, H., Graur, O., Graves, G., et al., 2012, ApJS, 199, 25P
- Raiter et al. (2010) Raiter, A., Schaerer, D., Fosbury, R. A. E., 2010, A&A, 523, 64
- Razoumov & Sommer-Larsen (2010) Razoumov, Alexei O.; Sommer-Larsen, Jesper, 2010, ApJ, 710, 1239
- Robertson et al. (2010) Robertson, B. E., Ellis, R. S., Dunlop, J. S., McLure, R. J., Stark, D. P., 2010, Nature, 468, 49
- Schaerer (2003) Schaerer, D., 2003, A&A, 397, 527
- Schaerer & de Barros (2009) Schaerer, D. & de Barros, S., 2009, A&A, 502, 423
- Schaerer et al. (2011) Schaerer, D., Hayes, M., Verhamme, A., Teyssier, R., 2011, A&A, 531, 12
- Schenker et al. (2012) Schenker, M. A., Stark, D. P., Ellis, R. S., Robertson, B. E., Dunlop, J. S., McLure, R. J., Kneib, J.-P., Richard, J., 2012, ApJ, 744, 179
- Scodeggio et al. (2005) Scodeggio, M., Franzetti, P., Garilli, B., Zanichelli, A., Paltani, S., Maccagni, D., Bottini, D., Le Brun, V., et al., 2005, PASP, 117, 1284
- Stark et al. (2011) Stark, D, P., Ellis, R, S., Ouchi, M., 2011, ApJ, 728, 2
- Vanzella et al. (2009) Vanzella, E., Giavalisco, M., Dickinson, M., Cristiani, S., Nonino, M., Kuntschner, H., Popesso, P., Rosati, P., et al., 2009, ApJ, 695, 1163
- Vanzella et al. (2011) Vanzella, E., Pentericci, L., Fontana, A., Grazian, A., Castellano, M., Boutsia, K., Cristiani, S., Dickinson, M., et al., 2011, ApJ, 730, 35
- Vanzella et al. (2012) Vanzella, E., Guo, Y., Giavalisco, M., et al. 2012, ApJ ,751, 70
- Verhamme et al. (2008) Verhamme, A., Schaerer, D., Atek, H., Tapken, C., 2008, A&A, 491, 89
- Yajima et al. (2011) Yajima, H., Choi, J-H, Nagamine, K., 2011, MNRAS, 412, 411
- Zackrisson et al. (2013) Zackrisson, E., Inoue, A K., Jensen, H., 2013, ApJ, 777, 39
- Zackrisson et al. (2012) Zackrisson, E., Zitrin, A., Trenti, M., Rydberg, C-E, Guaita, L., Schaerer, D., Broadhurst, T., Östlin, G., Ström, T., 2012, MNRAS, 427, 2212
- Zitrin et al. (2009) Zitrin, A., Broadhurst, T., Rephaeli, Y., Sadeh, S., 2009, ApJ, 707, 102