Spreading dynamics in complex networks
Abstract
Searching for influential spreaders in complex networks is an issue of great significance for applications across various domains, ranging from the epidemic control, innovation diffusion, viral marketing, social movement to idea propagation. In this paper, we first display some of the most important theoretical models that describe spreading processes, and then discuss the problem of locating both the individual and multiple influential spreaders respectively. Recent approaches in these two topics are presented. For the identification of privileged single spreaders, we summarize several widely used centralities, such as degree, betweenness centrality, PageRank, -shell, etc. We investigate the empirical diffusion data in a large scale online social community – LiveJournal. With this extensive dataset, we find that various measures can convey very distinct information of nodes. Of all the users in LiveJournal social network, only a small fraction of them involve in spreading. For the spreading processes in LiveJournal, while degree can locate nodes participating in information diffusion with higher probability, -shell is more effective in finding nodes with large influence. Our results should provide useful information for designing efficient spreading strategies in reality.
Keywords: spreading process, influential spreaders, complex networks
1 Introduction
As a widespread process, spreading describes many important activities in real world, ranging over the outbreak of epidemics [1, 2, 3, 4], the spread of news and ideas [5, 6, 7, 8], the diffusion of technique innovations [9, 10, 11], the promotion of commercial products [12, 13, 14, 15], and the rise of political movements [16, 17, 18, 19]. Understanding the mechanism behind the global spread of an epidemic or information is fundamental for applications in a variety of fields as diverse as epidemiology [3, 4], viral marketing [14, 15], collective dynamics [20, 21, 22] and robustness of networks [23, 24, 25]. In real life, the diffusion of a contagious disease or a piece of information usually underlies individuals’ contacts. Take the influenza as an example. The transmission of the influenza virus mainly depends on the direct contacts of infected persons and susceptible people. As people’s interaction is responsible for these spreading processes, the position of a person in the complex network, which is formed according to individuals’ social relations, usually determines the spreading capability of this person. As the empirical research has shown, the complex networks in reality, which describe various systems in the fields of social science [26, 27, 28, 29, 30], neuroscience [31, 32, 33], ecology [34, 35] and economics [36, 37], are by no means randomly connected. On the contrary, they display many non-trivial topological features such as the heavy-tailed degree distribution [38], small world effect [39], high clustering coefficient [40], self-similarity [41, 42] and community structures [43, 44]. Therefore, people in social networks with such rich topological structures should vary a lot in spreading abilities.
For the people in social networks, a few influential spreaders are able to start large scale diffusions and thus become more important than the other persons in the spreading process [45]. How to identify these privileged nodes is of great significance for applications across various domains. For instance, the knowledge of influential spreaders is crucial for the design of efficient strategies to control the outbreak of epidemics [46, 47]. And targeting the vital people in information dissemination is helpful for conducting successful campaigns in commercial product promotions [14, 15]. Due to its utmost importance in practice, the problem of searching for influential spreaders in complex networks has attracted much attention.
In the issue of identifying super spreaders, there are two distinct subtopics: searching for individual influential spreaders [45] and a set of nodes that can maximize the influence [12]. In the epidemic outbreaks or rumor diffusion, the spreading usually starts from a single source node. Therefore, monitoring the influential individual originators in social networks is important in preventing or decelerating the spreading. For locating individual spreaders, usually the topological or dynamical measures are utilized. We first rank the nodes according to specific measures and then select the nodes ranking top as influential spreaders. In the field of viral marketing, however, it is usually a set of nodes that are selected to start the propagation. The choice of the multiple originators should maximize the final influence since the goal of viral marketing is to persuade more people to buy the commercial products with less cost. A trivial way to find the best multiple spreaders is to select the nodes which are influential as individual spreaders. However this attempt usually fails for the reason that the top individual nodes tend to have large overlap in their infected population [45]. In fact, the issue of finding a -set nodes that can lead to maximal influence is a NP-hard optimization problem [48]. The solution mainly relies on the heuristic algorithms based on dynamic models in complex networks.
While the overall topic of spreading is too wide even to introduce briefly, we will mainly focus on the two subtopics described above. In this paper, we first introduce some of the most important theoretical models for spreading, which are widely used in the research of influential spreaders. Then the measures for identifying individual influential spreaders are discussed. We discuss their features, calculation complexity and performance in locating best single spreaders. After that, we present some progresses in finding multiple influential spreaders with heuristic algorithms. Finally, we show the empirical results based on extensive data collected from large-scale online communities.
2 Theoretical models for spreading
The early approach of designing mathematical models that describe spreading processes starts in the fields of sociology and epidemiology [49, 50, 51, 52]. Formulating theoretical models that capture real diffusion is helpful for us to understand how a disease or information spreads across a population. More importantly, the spreading models can be used to predict the outcome of spreading, thus providing instructions to accelerate or decelerate the diffusion processes. After the initial works, many models are proposed in the applications of a series of social and biological phenomena.
In the spreading models, there are usually two important elements to be specified. The first one is the underlying network, which describes how individuals interact with one another. The network is recorded by a graph with nodes and edges. If node and have a chance to contact in reality, then there exists a social link between them. As has been shown, the topological structure of the social network can dramatically affect the outcome of spreading [46, 53]. Another element that is vital for models is the spreading rule by which information or disease diffuses from one person to another. According to the diffusion strategy, existing models of spreading typically fall into two categories: independent interaction models and threshold models. We will introduce these two types of models in details in this section and explain some of their features.
2.1 Independent interaction models
In the epidemic spreading, each time an infected node contacts with a susceptible node, there is a chance that the susceptible person gets infected. Based on this fact, independent interaction models assume that each interaction results in contagion with independent probability. Specifically, whenever a susceptible person exposes to an infected person , will get infected with a probability , which is not affected by the contacts with other nodes. With such dynamics, independent interaction models mimic the contagious process directly and imply the fact that spreading underlies peoples’s interaction. The more a susceptible individual contacts with infected people, the higher probability he will be infected. The susceptible-infected-recovered (SIR) and susceptible-infected-susceptible (SIS) models from epidemiology [1, 2, 3], and the Bass model from the innovation diffusion literature [54] are examples of independent interaction models. Here we mainly discuss the well-known SIR and SIS models. Different models and generalizations can be found in the references [1, 2, 3, 4, 52].
As classical mathematical models for epidemic spreading, the SIR and SIS models were first proposed by epidemiologists [49, 50, 51, 52]. Since the mechanisms of SIR and SIS models are suitable to describe various spreading processes, such as disease spreading, idea propagation, and innovation diffusion, they have long been used in the study of spreading. In SIR model, each person can be in one of three possible states [1], susceptible (S), infected (I), or recovered (R). Susceptible individuals are healthy persons that may catch the disease. Infected people stand for the persons who have got the disease and are able to spread it to susceptible individuals. A person is recovered if he has been cured from the disease and becomes immune to it. In the classical SIR model, there are two adjustable parameters: the transmission probability and the recovery probability . The states of individuals evolve as follows:
| (1) |
| (2) |
where and are two neighbors in the social network. While the SIR model is suitable to describe the spreading of disease with immunity, there are many epidemics that an individual can catch for more than once. In this case, the SIS model, in which we only consider the susceptible (S) and infected (I) states, can better describe the contagion. The contagion process of the SIS model is the same as Eq.(1), while Eq.(2) is replaced by . Generalizations of SIR and SIS models can be implemented by imposing a distribution of the transmission rate and the recovery rate .
According to the distinct dynamics, there are fundamental difference in the outcomes of SIR and SIS models. In the SIR model, the infection will eventually die out, because once an individual becomes immune to the disease, he/she will never get infected again. Whereas, for SIS models, people can be infected for many times. So the disease can reach an endemic state, where a certain fraction of population are kept infected. Considering this difference, when we measure the result of SIR model, we are interested in the fraction of individuals who have ever caught the disease. While for SIS model, it is the fraction of infected nodes persisting in the endemic state that we concern.
Besides the spreading strategy, it is meaningful to discuss the impact of the underlying social network structure on the spreading results. In the early research, both SIR and SIS models are considered within the homogeneous mixing hypothesis [1], where the infectious and susceptible people contact with each other randomly. In this case, the underlying social network is actually an Erdós-Rényi random graph. The most important observation under this condition is the emergence of an epidemic threshold [55]. Take the SIR model as an example (without loss of generality we set ). When a single node becomes infectious among susceptible population, the epidemic threshold is given by , where is the average number of connections of nodes. If , the disease will infect a finite fraction of the population. On the other hand, if , the fraction of infected individual will tend to zero in the limit of very large population.
As we all know, the transmission networks in real life are by no means totally random. For example, the degree distribution of the sexual contact network is found to be power-law [56]. To this end, several important works have been done to understand the effects of the nontrivial network structure on the spreading outcomes [46, 57, 58, 59, 60, 61, 62]. For SIR model on uncorrelated graphs with a generic degree distribution and a finite average degree , the epidemic threshold is defined by [46, 59, 60, 63, 64]. Apparently, for networks with , the threshold has a finite value. Whereas, for networks with strongly fluctuating degree distribution, the infinity of results in a vanishing epidemic threshold for large scale networks. Analogously, the absence of an epidemic threshold in scale-free networks with the power-law exponent was reported as well [46, 60]. Apart from the topological structures mentioned above, other complex topologies have been considered, such as the high-clustering [65, 66], small-world [58, 67, 68], degree correlation [53, 69], etc. These works provide more insights into the interplay between network structure and epidemic outcomes for SIR and SIS models.
2.2 Threshold models
Although the independent interaction models can describe the epidemic spreading in reality, numerous phenomena in economics and sociology [50, 70, 71, 72, 73, 74, 75, 76] are better described by the threshold models. In these applications, people tend to adopt a new behavior or information only if a certain fraction of their neighbors have already done so [77, 78]. In this case, the effect of a single interaction is no longer independent, but strongly depends on other exposures.
The simplest threshold model is the Linear Threshold Model. In this model, each node is assigned a threshold value, which is the fraction of neighbors required for it to adopt the new behavior or information. And on each link , we define a weight to reflect the influence that exerts on . In the spreading process, some initial nodes starts out adopting the new behavior. A node is defined as active if it is following the new behavior. At a given time, any inactive node becomes active if the sum of weights from its active neighbors exceeds its threshold. In subsequent times, the activation of some nodes may cause other nodes to adopt the new behavior, and such process can be applied repeatedly. This phenomenon is usually used to explain the cascading behavior in social science [77, 78]. More generally, based on the Linear Threshold Model, we can assign each node a threshold function instead of using the weighted sum in the state updating. Such General Threshold Model is more general since it can reflect any types of threshold rule.
Compared with independent interaction model, the threshold model actually incorporates the memory of past exposures history. Therefore, the result of a single interaction is determined by other interactions. This radical difference turns out to have significant impact on the spreading dynamics. With such threshold model, global cascading which is triggered by small number of initial originators is observed [77]. Also it has been shown in a model with memory of exposures history, the final state of the spreading is controlled by only two parameters: and , which stand for the probability that a node becomes infected due to one and two contacts respectively [79]. This indicates that the interplay of single contacts in threshold model can lead to different dynamics with independent interaction models.
Apart from the models mentioned above, there are also other variations describing spreading in complex networks, including the standard rumor model proposed by Daley and Kendal [80, 81, 82, 83, 84], the voter model [85, 86, 87, 88], the strategic game models [89, 90, 91, 92], etc. All these models help us understand the mechanism of spreading in various domains and many profound results have been applied in reality.
3 Searching for individual influential spreaders
In order to find effective predictors for individual influential spreaders, various measures are designed to rank the nodes according to their statuses in spreading. Most of the proposed measures are determined by nodes’ topological features as well as an assuming spreading mechanism. Here we will introduce some of the most important predictors that are widely used to quantify nodes’ spreading ability.
In the context of social science, the topology of a social network is represented by an adjacency matrix , where the element if there exists a link from to and otherwise. For an undirected network, is a symmetric matrix with . If the network is weighted, the element represents the weight of the link from to . Actually, the adjacency matrix fully describes the topological structure of the social network. Once one has the adjacency matrix, it is possible to calculate the following measures for each node. Some of the measures only need the local information, i.e. the properties of a node’s neighbors, while some others require the complete structure of the social network. Due to the large size of modern social networks, the calculation of global measures imposes great challenge in the research of social networks.
3.1 Degree
In real social networks, it is observed that while most of the people have small or moderate number of connections to other individuals, there are very few of hubs that maintain extremely large number of social relations. Such phenomenon is described by a power-law (or heavy-tailed) degree distribution. For an unweighted graph, degree is the number of links connecting to a node. For a weighted graph, it is defined as the sum of weights from edges connecting to a node. In an undirected network, according to the adjacency matrix of a graph, degree for a node can be computed as follows:
| (3) |
In the case of a directed network, we usually define two separate measures of degree centrality, namely indegree and outdegree. Concretely, indegree is the number of links directed to the node and outdegree is the number of links that the node directs to others. Indegree and outdegree are defined as:
| (4) |
| (5) |
Computing degree centrality for all the nodes in a dense network takes complexity . However, for a network with a sparse adjacency matrix, which we usually encounter in reality, its computational complexity is reduced to , making the degree centrality a feasible measure even for very large networks. Albeit it is a local measure, degree is efficient in finding important nodes in many situations. For example, for epidemic spreading in scale-free networks, hubs are more likely to be infected and can lead to large scale diffusion [46]. Also in complex networks with broad degree distribution, such as Internet, power grid or other infrastructure networks, intentional attack of the hubs can result in rapidly breakdown of the whole structure [23, 25]. Such fragility of scale-free networks under intentional attacks indicates that hubs play prominent role in the structure stability. However, not all hubs are guaranteed to be super spreaders. For instance, if a hub locates in the periphery of the network, its spreading ability would be limited [45]. After all, degree only captures the number of the nearest neighbors of a node. In fact, the spread capability of the neighbors can also affect the nodes’ importance in spreading significantly. Therefore, measures involved with more information are desired to improve the performance of degree. Even so, due to its easy accessibility and relatively satisfied performance, degree is still used as an effective predictor of influential spreaders in many applications.
3.2 Betweenness and closeness centralities
Betweenness and closeness centrality are two well-known ranking measures in social science [93, 94]. Both of them are proposed based on the assumption that information tend to traverse the network from the originator to destination through the shortest path.
In the social network theory, betweenness centrality is defined as a measure of how many shortest paths cross through this node [93, 94]. For a network , the betweenness centrality of node , denoted by is defined as
| (6) |
where is the number of shortest paths between nodes and , and is the number of shortest paths between and which pass through node . With this definition, the nodes with large betweenness centrality usually hold the vital positions in the shortest pathways between large numbers of pairs of nodes.
Apart from the betweenness centrality, in a connected network, there exists a natural distance metric between all pairs of nodes. The farness [95] of a node is defined as the sum of its distances to all other nodes, and its closeness centrality is defined as the inverse of the farness. Thus, the smaller closeness a node has, the lower its total distance to all other nodes. Precisely, closeness centrality of node is defined as [95]:
| (7) |
where is the shortest distance between and . In fact, closeness centrality can be viewed as a measure of how long it will take for a piece of information to spread from a given node to other reachable nodes through the shortest paths in the network. The smaller a node’s closeness is, the faster the information diffuses from this node.
However, on an unconnected network, the closeness centrality is not well defined. Since the distance between any two unreachable nodes is infinity, the closeness centrality of all nodes in an unconnected graph would be 0. To solve this problem, a modified version of the classic closeness, residual closeness [96], is proposed. The residual closeness of node is defined as
| (8) |
In general, betweenness and closeness centralities can identify crucial nodes in transportation. Take the betweenness centrality as an example, the nodes with large betweenness usually hold the vital positions in the pathways between pairs of nodes. If such nodes are intentionally attacked, the overall efficiency of spreading will be heavily damaged, since the increase of path length would make it difficult for a piece of information to spread to other nodes. In the networks with heavy-tailed degree distribution, hubs usually serve as intermediate nodes in the shortest paths between nodes [97]. So hubs incline to have large betweenness centrality. Besides, the nodes connecting two separate communities also have large betweenness centrality. Such nodes, although not necessarily being well connected, play the role of connecting bridges in the transportation between the nodes in two communities. Applications of betweenness centrality include computer and social networks [98], biology [99, 100, 101], transport [102], scientific cooperation [103] and so forth.
Comparing with degree, betweenness and closeness centralities care more about the global structure. Therefore, the calculation of betweenness and closeness requires the complete network structure. Moreover, both betweenness and closeness centralities involve calculating the shortest paths between all pairs of vertices on a graph, which is a rather time-consuming task. The classic algorithm finding shortest paths between all pairs of nodes is the Floyd-Warshall algorithm [104], and it will take the complexity . Later on, some more efficient algorithms are developed for specific types of networks. On sparse networks, Johnson algorithm requires time to compute the betweenness centrality [105]. Brandes has proposed a more efficient algorithm. For unweighted sparse networks, it has the complexity of [106]. Even with the fastest algorithm, for large scale online social networks with tens of millions of nodes, such as Twitter and Facebook, it is usually infeasible to get the betweenness or closeness centralities in a reasonable time.
3.3 Eigenvector and PageRank centralities
Eigenvector centrality was first introduced in the research of sociology [107], where it was used to measure the influence of a person in a social network. The main idea behind eigenvector centrality is that a node’s importance is not only determined by itself, but also affected by its neighbors’ importance. A node connecting to important nodes will make itself also important. With this idea, the eigenvector centrality of vertex can be defined as:
| (9) |
where is a constant and is the entry of the adjacency matrix . Actually, this equation can be rewritten in vector notation as
| (10) |
In the matrix theory, there will be many different eigenvalues for which an eigenvector solution exists. However, when we quantify the influence of a node, it is required that the measure should be positive. According to the Perron-Frobenius theorem, only the largest eigenvalue can lead to such centrality measure [108]. Clearly, eigenvector centrality not only depends on the degree of the nodes, but also on their neighbors’ eigenvector centrality. Due to this recursive property, eigenvector centrality can reflect the global feature of the network.
As a generalization and variation of eigenvector centrality, PageRank was originally introduced to rank web pages in the world wide web (www) [109]. As a successful ranking algorithm, it is not only adopted by webpage search engines like Google, but also used in ranking the importance of elements in a wide range of applications, such as scientific ranking [110, 111, 112], gene research [113, 114], traffic and transportation [115], ecological systems [116], and even lexical semantics [117]. Compared with eigenvector centrality, PageRank introduces a small probability of random jumping to handle walking traps on a graph. The PageRank of a node in a network can be calculated from
| (11) |
where is the number of outgoing links from node and is the jumping probability. Equation (11) actually describes a random walk process: a random walker moves along the links of the network with probability , and jumps to a randomly selected node with probability . is the probability that node is visited by the random walker at time . As time increases, the probability will converge to a stationary probability . This value is defined as the PageRank which are used to determine its ranking relative to other nodes. In the calculation, the conventional choice of is 0.85. Different choice of can affect the ranking results.
From a calculation aspect, both eigenvector and PageRank centralities can be computed efficiently by power iteration [118, 119]. Initially assign each node with the same score, and then iterate according to corresponding update equations. The result usually converges quickly in iterations. So eigenvector and PageRank centralities can be applied to large scale networks.
Based on the classic PageRank algorithm, several variations are proposed. One is the so-called LeaderRank [120]. On the basis of PageRank, LeaderRank introduces a ground node , which has two directed links to every node in the original network. In this way, the network will become strongly connected. More importantly, LeaderRank is a parameter-free algorithm, thus getting rid of the influence of parameters. Although LeaderRank stems from PageRank, it is reported to be more stable to noisy data containing spurious and missing links. In the condition where spammers create fake links to obtain high rank, LeaderRank performs more reliable than PageRank in ranking users. Also an extension of PageRank algorithm, the TwitterRank [121], is proposed to measure the influence of users in Twitter. TwitterRank measures the influence taking both the topical similarity between users and the link structure into consideration. Experimental results show that TwitterRank outperforms the one Twitter currently uses and other related algorithms, including the classical PageRank and Topic-sensitive PageRank [122].
3.4 -shell index
In the graph theory, -shell index describes the location of a person in the social network [123, 124, 125]. The -shell index of a node is obtained by a procedure called -shell decomposition, where we successively prune nodes in the network layer by layer. Concretely, the decomposition starts by removing nodes with degree . After that, some nodes may have only one link left. So we continue pruning the network iteratively until there are no nodes with . The removed nodes fall into a -shell with index . With the similar method, we iteratively remove the next shell and higher shells until all nodes are pruned. In the decomposition procedure, each node is assigned with a -shell index. The periphery of the network corresponds to small and the nodes with high define the core of the network.
Compared with the degree , the index provides a different type of information. By definition, a given layer with index can be occupied with nodes of degree . For random model networks, a strong correlation between and the index of a node exists: the nodes with lower degree incline to stay in the periphery of network while the core region is mainly occupied by hubs. Therefore, both the degree and -shell provide similar information. In real networks, however, this relation is often not true. In real networks hubs may have very different values and can be located both in the periphery or in the core of the network [45].
Recently, it is reported that for SIR and SIS modeling, the most influential spreaders, which can lead to large scale epidemics, are located in the inner core of the network (large region) [45]. The authors perform SIR and SIS models on a series of real networks, and find that the spreading processes originate from high -shell nodes have larger average infected population than those starting from nodes with high degree and betweenness centrality. These results indicate that the -shell index of a node is a better predictor of spreading influence than the commonly adopted degree and betweenness centrality. When a spreading process starts in the core of the network, the epidemic or information can diffuse through many pathways to the rest part of the network. Moreover, it has been shown that nodes with high are easier to be infected and will be infected earlier than other nodes. The nodes located in the core region of network tend to have well connected neighbors, and the neighbors of their neighbors are also prone to have large degree. It is these well-connected neighbors that make the nodes in the core region more efficient in spreading. Clearly, -shell decomposition requires the complete network structure. Once we have the adjacency matrix, -shell decomposition can be performed with complexity [126]. Therefore, the -shell index can be applied to large scale networks.
Despite its effectiveness, -shell also have several defects. In some situations, -shell is limited due to the lack of resolution. For example, in the networks with a tree structure, or networks formed by growth models [38], -shell index only contains a few discrete values. Such degeneracy of the -shell index limits its predictive accuracy. This limitations have been identified also in some empirical studies of spreading [127, 128, 129].
Based on -shell decomposition, several improvements or alternatives are proposed. Zeng [130] proposed a mixed degree decomposition (MDD) procedure in which both the residual degree (number of links between the remaining nodes) and the exhausted degree (number of links between the removed nodes) are considered. In each step of the MDD procedure, the nodes are removed according to the mixed degree , where is the residual degree, is the exhausted degree, and is a tunable parameter between 0 and 1. When , the MDD method becomes the -shell method, while when , the MDD method is equivalent to the degree. By simulating the epidemic spreading process on real networks, it is shown that the MDD method can improve the performance of -shell. Another method based on the -shell index is the -power community index (-PCI) [131], which is a balance of coreness and betweenness centrality. The metric is computed as follows: the -PCI of a node is equal to , such that there are up to nodes in the -hop neighborhood of with degree greater than or equal to , and the rest of the nodes in that neighborhood have a degree less than or equal to . Due to its computational complexity, the authors only present the results for . By modeling on real networks, it is shown the 1-PCI exhibits steady and reliable behavior. As 1-PCI values increase, influence also continuously increases until maximum infection is reached.
3.5 Path counting
Path counting was first proposed as the accessibility metric [133, 134]. The basic idea is to count the number of all possible walks of arbitrarily length departing from the source node. Recently, the concept of path counting was exploited to quantify the importance of individual role in collective dynamics [132]. A measure called dynamical influence (DI) is proposed to quantify a node’s influence in various dynamical processes. The DI is calculated as the leading left eigenvector of a characteristic matrix that records the topology and dynamics. Specifically, in the characteristic matrix , the entry stands for the influence that node exerts on node . The th entry of the left eigenvector of corresponding to the largest eigenvalue is defined as the DI of node . Computationally, DI can be easily calculated by power method. Starting from a uniform vector , we mulitply it with higher and higher powers of ( is an integer):
| (12) |
Notice that, the th entry of is the number of all possible walks of length departing from node . This explains the idea of path counting behind the definition of DI.
This framework applies to a variety of dynamical models, including epidemic spreading models, the Ising model [135, 136], and diffusive processes like the voter model [137] or phase coupled oscillators [138]. In the SIR model, DI is shown to be a good predictor of spreading efficiency at the critical regime, outperforming the predictions made by degree, -shell index and betweenness centrality.
Another approach based on path counting is a method to approximate the number of infections resulting from a given initially-infected node in a network of susceptible individuals [139]. This method directly considers the spreading process and provides estimation of actual number of infections with probability analysis. The derivation of the impact of vertex , i.e. the estimated number of infections given that vertex was infected first, is a little bit lengthy, so we will not introduce the details here. The computation of node ’s impact requires the number of walks from to all other nodes of arbitrary length with repeated vertices, which is the bottleneck of the computation complexity for this method. In reality, to avoid long computing time, the impact of vertices can be estimated by imposing a maximal walk length . Simulations show that very good results can be obtained with short path lengths . We should note here that the exact definition of impact of nodes in this method relies on the assumed spreading models. So different models may result in different definitions.
Apart from the progresses mentioned above, a method measuring node spreading power by expected cluster degree is proposed [140]. Authors quantify the spreading ability of a source node by the expectation of the degree of a disease cluster starting from it. The degree of a cluster of nodes is defined as the number of edges that connect nodes within and outside the cluster. Define the expected reach of node , , as the expectation of the degree of the infected cluster after contagions starting from . In practice, the can be obtained by counting all possible clusters of infected nodes which could appear after infections starting from and then taking the average cluster degree. This method is applied to the recent Ebola outbreak in Uganda, and it predicts that Ebola is unlikely to spread globally. Similar with other path counting methods, computational expense is still a major concern of . This problem can be solved by imposing a maximal value: it is shown is sufficient to determine the outcome [140].
4 Finding the most influential sets of nodes
In real-world applications, there are many situations where we need to find a small set of nodes that can spread information to the largest number of nodes in the network. For example, in viral marketing, a company tries to promote a new commercial product using the word-of-mouth effects. The best strategy is to persuade more people to buy the product with a limited advertising budget. In this case, how to find the most influential sets of nodes that can lead to maximal influence in complex networks becomes a fundamental issue.
The problem of finding most influential multiple spreaders is different from the one locating single influential spreaders. For spreading processes originating from a set of nodes simultaneously, the distance between these originators from each other should be taken into consideration. This is because the nodes influenced by the origins may have great overlap. Since the methods for single influential spreaders are not guaranteed to find nodes that are far enough [45], we cannot just select the top nodes using the predictors designed for single super spreaders. Actually, this issue has been abstracted as a fundamental algorithmic problem in computer science [141]. For any spreading process, there exists a influence function defined on a set of nodes . Assuming that is the set of originators, is the expected number of infected nodes at the end of spreading process. With this interpretation, the problem becomes to maximize for the set with nodes. In fact, this is a rather hard computational problem. Kempe et al. [48] has proved that for a generic class of threshold models, it is NP-hard to find the optimal set . Therefore, what we can do is to find suboptimal results with heuristic algorithms.
The basic idea behind the construction of heuristic algorithms lies in the fact that, when we add nodes to the originators’ set , usually the spreading will not increase significantly, but once the right nodes are added, the process suddenly spreads widely. Such property is described as submodularity mathematically [48]. It has been shown most instances of threshold models are submodular [48, 142]. For models with such property, Kempe et al. [48] developed a greedy search algorithm: starting from a randomly selected node, each time we add the node that can lead to maximal increase of spreading if we include it to , until the desired size of is reached. Making use of the classical theorem of Nemhauser, Wolsey, and Fisher [143], they proved analytically that the solution of this greedy strategy is within of optimal for several classes of models. This is the first provable approximation guarantees for heuristic algorithms for this problem. However, the spread estimation procedures, which are usually implemented by Monte Carlo simulations, are quite time-consuming, thus limits the efficiency of this algorithm.
Based on these fundamental results, several improvements have been developed. To reduce the Monte Carlo simulations to estimate spread, Leskovec et al. [144] exploited submodularity and proposed a ‘Cost-Effective Lazy Forward‘ (CELF) optimization to the simple greedy algorithm. The main idea is that the marginal gain of a node in the current iteration cannot exceed its marginal gain in previous iterations. With this idea, CELF optimization significantly reduces the number of calls made to the spread estimation procedure. Later on, Chen et al. [145] proposed an improved version of original greedy algorithm, NewGreedy. More recently, Goyal et al. [146] developed the algorithm CELF++, which is an extension to CELF that further reduces the number of spread estimation calls. Other approaches can be found in literature [147, 148, 149, 150, 151, 152]. These heuristic algorithms improve the computational efficiency of the original greedy algorithms.
Besides the greedy strategies for submodular models, an efficient algorithm based on message passing in statistical physics is proposed recently [153]. Message-passing algorithm is an efficient method to deal with problems in statistical physics and combinatorial optimization [154, 155, 156]. To solve the spread optimization problem, authors mapped it on a high dimensional static constraint-satisfaction model. Then they developed efficient message-passing algorithms to find a solution to the spread maximization problem. Compared with the greedy algorithm, this new approach takes into account of the cooperative characteristics, which are fundamental in real systems. With analytic and algorithmic results on random graphs as well as a real-world network, it is shown for a wide range of irreversible dynamics, even without submodularity, the spreading optimization problem can be solved efficiently on large networks.
5 Empirical research on influential spreaders
With the rapid development of the Internet and online communities, a huge number of large scale datasets become available for researchers to conduct analysis on spreading processes. In the last decade, huge number of research works have been performed on datasets from various types of online social networks, including email communication [157], online social network - Facebook [158, 159, 160], microblogging service - Twitter [121, 161, 162, 163, 164, 165], blogs sharing community - LiveJournal [166, 167], and other online communities [7, 168, 169, 170, 171, 172, 173, 174, 175].
Directly examining the real diffusion data enables us to reveal the exact spreading mechanisms beneath the propagation and discover new principles dominating the diffusion process. In this section, we would like to focus on the issue of finding individual super spreaders and present our new results based on complete network structure and the record the diffusion instances. As we have shown, most of previous researches on individual super spreaders are based on the assumptions of specific spreading rules. However, how the information diffuses in reality is still not clear. Recently study [170] shows that the structure of online diffusion networks cannot be fully described by current theoretical models. And some empirical researches find that the prediction based on specific models are not always correct [176, 177, 178, 179]. Consequently, we want to check the validity of these measures with real diffusion data.
To achieve this, we have gathered the social network as well as diffusion data from a well-known online blog community–LiveJournal. This online community has been used to study spreading in previous research works [157, 166, 167]. The social network is constructed by the friend relations in LiveJournal, i.e. if user is in user ’s friend list, then there is a directed social link from to . In LJ, users can obtain the update of the friends’ posts. Therefore, the information would flow along the incoming links of a source node. With this method, we obtain a complete social network with 9,636,481 nodes and 197,368,009 links. In order to extract the diffusion instances, we collect 56,180,137 posts published by LiveJournal users and filter 598,833 posts that contain links to other posts in LiveJournal. In this way, if user has cited user ’s posts at least once, we put a diffusion link from to . The resulting unweighted directed graph is called diffusion graph, from which we can infer each node’s influence. In our study, we only consider the measures of indegree, PageRank and -shell. Notice that, according to the definition of LJ social network, indegree describes the number of audiences of a user. So here we discuss indegree rather than outdegree. Eigenvalue centrality is similar to PageRank. And betweenness centrality is infeasible for such large network due to its great computational complexity. All the definitions of these measures can be found in previous section.
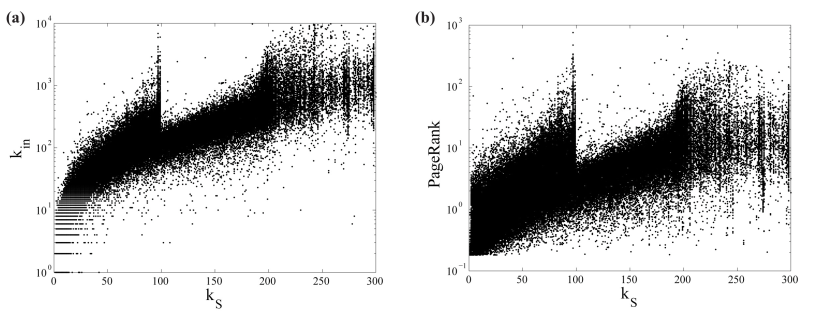
Our first observation of this dataset is that, in the LiveJournal social network with rich topological structure, different measures can reflect very distinct information for each node. In Fig.1(a), there exist lots of nodes with large indegree but small . Meanwhile, not all the nodes with large have large indegree. The similar result is also obtain for PageRank, which is presented in Fig.1(b). Since the measures may convey different information for the same node, their abilities to reflect spreading power should be different as well.
Despite the large number of users in LiveJournal, there are only a small fraction of nodes participating in spreading. Precisely, only 246,423 users are involved in the information diffusion. To quantify a node’s spreading ability, we infer its influence by the size of its outgoing component in the diffusion graph. Concretely, for each node in diffusion graph, we first follow the diffusion links starting from it, finding the first layer nodes that adopt the information, and then track the links starting from these nodes and so on. This process applies recursively until there are no more diffusions exist. We define the number of these reachable nodes from node in the diffusion graph as the influence of node , and denote it as . Although the exact information diffusing from node to these nodes may be different, node has great potential to influence these nodes.
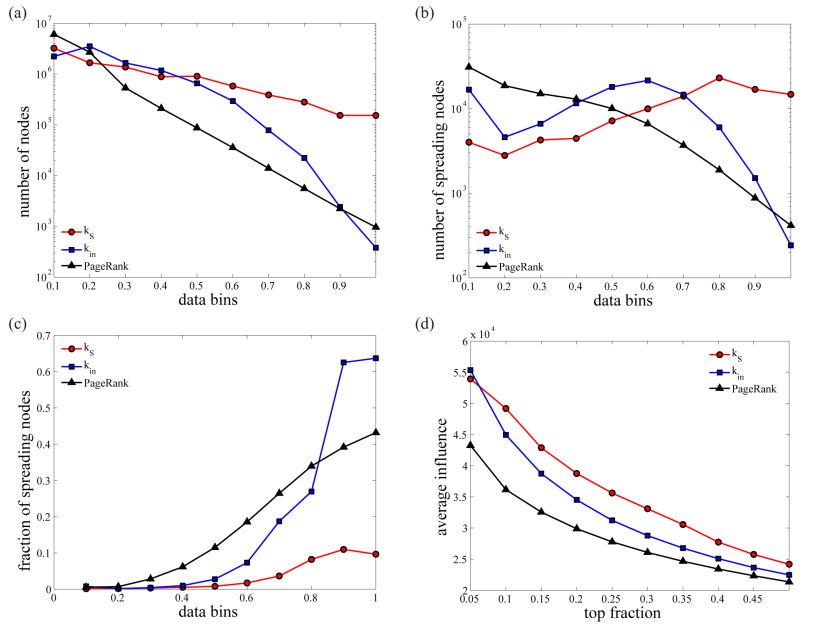
To compare the effect of different measures, in Fig.2(a), we show the distribution of nodes for , and PageRank. To construct the data bins, we first take the logarithmic values of each measure, and then divide the range into ten intervals equally. Considering the different ranges of these measures, the intervals are normalized to , and from to , the value increases from the minimum to maximum. We can see in the top region, has far more nodes than and PageRank. This is because while and PageRank assign tens of thousands different values, can only have several hundreds discrete values. Fig.2(b) presents the number of users involved in spreading in each bin. The main difference between and the other two measures is that the number of spreading users has a growing tendency as increases. The larger number of spreading users in the top region of can be explained by the larger number of users in this area, as shown in Fig.2(a).
In order to check the distribution of spreading users according to different measures, we plot Fig.2(c) to show the fraction of users participating in diffusion in each data bin for three predictors. The fraction of spreading users is defined as the ratio between the number of spreading users and the total number of users in each bin. Clearly, the fraction of all three measures increases as the value of each measure grows. This indicates that, the users ranking top by these predictors have larger probability to participating in information spreading. Particularly, in the top area, nodes with large have much more chance to spread information than and PageRank. The reason for that is there are very few hubs with extremely large indegree. Even though the number of spreading users are relatively small, when divided by the number of hubs, the fraction becomes larger than that of and PageRank.
While indegree can find nodes participating in information diffusion with larger probability in the top region, it is desirable to check the influence of these identified users. For each predictor, we present the average influence of the nodes involved in diffusion that rank in top fraction in Fig.2(d). The result show that the nodes identified by in general have larger influence than indegree and PageRank. This means that if a spreading process starts in the core region of network, it will lead to larger diffusion. This result coincides with the recent report of SIR and SIS modeling on real-world networks [45]. Therefore, in practice identifying super individual spreaders with is more reliable than indegree and PageRank.
6 Conclusion and discussion
Searching for influential spreaders in complex networks is a crucial issue for many applications. In this paper, we make a review of the most important theoretical models in describing spreading dynamics, and introduce the current methods to identify both the individual and multiple influential spreaders in various diffusion processes. Through empirical diffusion data from LiveJournal, we find that in practice different measures usually convey distinct information for nodes in social networks. Of all the users in the network, only a small fraction of users participate in spreading. Indegree can locate nodes that involve in information diffusion with higher probability than -shell and PageRank. However, if we want to identify nodes with large influence, it is preferred to use -shell index. Our results come from the direct analysis of empirical diffusion data, thus providing practical instructions in real-world applications.
Even though great improvement has been made in the research of finding influential spreaders, there are still many problems we need to investigate. For instance, our results of -shell are only tested on a specific online community LiveJournal. How the results apply in other systems needs to be further examined. For both the single and multiple spreaders, most of the current algorithms require the topological structure of the underlying social network. In contrast, it is usually difficult to reconstruct the social network in practice. Consequently, some local algorithms are still desirable to be developed. In the future research works, these considerations would still attract attention from various domains and lead to further exploration.
Acknowledgments
We gratefully acknowledge funding by ARL under Cooperative Agreement Number W911NF-09-2-0053, NIH and NSFC (11290141, 11201018). We thank L. Muchnik for useful discussions and providing the LiveJournal data.
References
References
- [1] Anderson R M, May R M and Anderson B, 1992 Infectious Diseases of Humans: Dynamics and Control (Oxford University Press)
- [2] Hethcote H W, 2000 SIAM Rev. 42 599-653
- [3] Diekmann O and Heesterbeek J A P, 2000 Mathematical Epidemiology of Infectious Diseases (Chichester: Wiley)
- [4] Keeling M J and Rohani P, 2008 Modeling Infectious Diseases in Humans and Animals (Princeton University Press)
- [5] Adar E, Zhang L, Adamic L A and Lukose R M, 2004 Workshop on the Weblogging Ecosystem 13
- [6] Kumar R, Novak J, Raghavan P and Tomkins A, 2004 Communications of the ACM 47 35-39
- [7] Adar E and Adamic L A, 2005 Proc. 2005 IEEE/WIC/ACM Int. Conf. on Web Intelligence 207-214
- [8] Leskovec J, Backstrom L and Kleinberg J, 2009 Proc. 15th ACM SIGKDD Int. Conf. on Knowledge Discovery and Data Mining 497-506
- [9] Metcalfe J S, 1987 The Diffusion of Innovation: An Interpretive Survey (University of Manchester, Department of Economics)
- [10] Strang D and Soule S A, 1998 Annu. Rev. Sociol. 265-290
- [11] Rogers E M, 2010 Diffusion of Innovations (Simon and Schuster)
- [12] Richardson M and Domingos P, 2002 Proc. 8th ACM SIGKDD Int. Conf. on Knowledge Discovery and Data Mining 61-70
- [13] Domingos P. M, 2005 IEEE Intelligent Systems 20 80-82
- [14] Watts D J, Peretti J and Frumin M, 2007 Viral Marketing for the Real World (Harvard Business School Pub.)
- [15] Leskovec J, Adamic L A and Huberman B A, 2007 ACM Transactions on the Web (TWEB) 1 5
- [16] Diani M and McAdam D, 2003 Social Movements and Networks: Relational Approaches to Collective Action: Relational Approaches to Collective Action (Oxford University Press)
- [17] McAdam D and Paulsen R, 1993 Am. J. Sociol. 640-667
- [18] Polletta F and Jasper J M, 2001 Annu. Rev. Sociol. 283-305
- [19] Snow D A, Zurcher Jr L A and Ekland-Olson S, 1980 Am. Sociol. Rev. 787-801
- [20] Albert R and Barabási A-L, 2002 Rev. Mod. Phys. 74 47
- [21] Boccaletti S, Latora V, Moreno Y, Chavez M and Hwang D-U, 2006 Phys. Rep. 424 175-308
- [22] Barrat A, Barthelemy M and Vespignani A, 2008 Dynamical Processes on Complex Networks (Cambridge: Cambridge University Press)
- [23] Albert R, Jeong H and Barabási A-L, 2000 Nature 406 378-382
- [24] Newman M E J, 2003 SIAM Rev. 45 167-256
- [25] Cohen R, Erez K, Ben-Avraham D and Havlin S, 2001 Phys. Rev. Lett. 86 3682
- [26] Wasserman S, 1994 Social Network Analysis: Methods and Applications (Cambridge university press)
- [27] Freeman L C, 2004 The Development of Social Network Analysis (Vancouver: Empirical Press)
- [28] Castellano C, Fortunato S and Loreto V, 2009 Rev. Mod. Phys. 81 591
- [29] Gallos L K, Havlin S, Liljeros F and Makse H A, 2012 Phys. Rev. X 2 031014
- [30] Yan S, Tang S, Pei S, Jiang S, Zhang X, Ding W and Zheng Z, 2013 Physica A 392 3846-3855
- [31] Kinouchi O and Copelli M, 2008 Nat. Phys. 2 348-351
- [32] Larremore D B, Shew W L and Restrepo J G, 2011 Phys. Rev. Lett. 106 058101
- [33] Pei S, Tang S, Yan S, Jiang S, Zhang X and Zheng Z, 2012 Phys. Rev. E 86 021909
- [34] Camacho J, Guimer à R and Amaral L A N, 2002 Phys. Rev. Lett. 88 228102
- [35] Dunne J A, Williams R J and Martinez N D, 2002 Proc. Natl. Acad. Sci. USA 99 12917-12922
- [36] Yakovenko V M and Rosser Jr J B, 2009 Rev. Mod. Phys. 81 1703
- [37] Pei S, Tang S, Zhang X, Liu Z and Zheng Z, 2012 Physica A 391 2023-2031
- [38] Barabási A-L and Albert R, 1999 Science 286 509-512
- [39] Watts D J and Strogatz S H, 1998 Nature 393 440-442
- [40] Strogatz S H, 2001 Nature 410 268-276
- [41] Song C, Havlin S and Makse H A, 2005 Nature 433 392-395
- [42] Gallos L K, Makse H A and Sigman M, 2012 Proc. Natl. Acad. Sci. USA 109 2825-2830
- [43] Girvan M and Newman M E J, 2002 Proc. Natl. Acad. Sci. USA 99 7821-7826
- [44] Galvao V, Miranda J G V, Andrade R F S, Andrade Jr J S, Gallos L K and Makse H A, 2010 Proc. Natl. Acad. Sci. USA 107 5750-5755
- [45] Kitsak M, Gallos L K, Havlin S, Liljeros F, Muchnik L, Stanley H E and Makse H A, 2010 Nat. Phys. 6 888-893
- [46] Pastor-Satorras R and Vespignani A, 2001 Phys. Rev. Lett. 86 3200
- [47] Boguná M and Pastor-Satorras R, 2002 Phys. Rev. E 66 047104
- [48] Kempe D, Kleinberg J and Tardos, É, 2003 Proc. 9th ACM SIGKDD Int. Conf. on Knowledge Discovery and Data Mining 137-146
- [49] Schelling T, 1978 Micromotives and Macrobehavior (Norton)
- [50] Granovetter M, 1978 Am. J. Sociol. 1420-1443
- [51] Granovetter M and Soong R, 1983 J. Math. Sociol. 9 165-179
- [52] Herrmann H J, 1986 Phys. Rep. 3 153
- [53] Boguná M, Pastor-Satorras R and Vespignani A, 2003 Phys. Rev. Lett. 90 028701.
- [54] Bass F, 1969 Manage. Sci. 15 215
- [55] Murray J D, 1993 Mathematical Biology (Springer, Berlin)
- [56] Liljeros F, Edling C R, Amaral L A N, Stanley H E and Aberg Y, 2001 Nature 411 907
- [57] Grassberger P, 1983 Math. Biosci. 63 157-172
- [58] Moore C and Newman M E J, 2000 Phys. Rev. E 61 5678
- [59] Newman M E J, 2002 Phys. Rev. E 66 016128
- [60] Pastor-Satorras R and Vespignani A, 2001 Phys. Rev. E 63 066117
- [61] Pastor-Satorras R and Vespignani A, 2002 Phys. Rev. E 65 035108
- [62] Pastor-Satorras R and Vespignani A, 2002 Phys. Rev. E 65 036104
- [63] Moreno Y, Pastor-Satorras R and Vespignani A, 2002 Eur. Phys. J. B 26 521
- [64] Dezso Z and Barabási A-L, 2002 Phys. Rev. E 65 055103R
- [65] Eguíluz V M and Klemm K, 2002 Phys. Rev. Lett. 89 108701
- [66] Serrano M Á and Boguná M, 2006 Phys. Rev. Lett. 97 088701
- [67] Kuperman M and Abramson G, 2001 Phys. Rev. Lett. 86 2909
- [68] Santos F C, Rodrigues J F and Pacheco J M, 2005 Phys. Rev. E 72 056128
- [69] Moreno Y, Gómez J B and Pacheco A F, 2003 Phys. Rev. E 68 035103
- [70] Gladwell M, 2000 The Tipping Point: How Little Things Can Make a Big Difference (Little, Brown, New York)
- [71] Bikhchandani S, Hirshleifer D and Welch I, 1992 J. Pol. Econ. 100 992-1026
- [72] Aguirre B E, Quarantelli E L and Mendoza J L, 1988 Am. Sociol. Rev. 53 569-584
- [73] Glaeser E L, Sacerdote B and Schheinkman J A, 1996 Quart. J. Econ. 111 507-548
- [74] Valente T W, 1995 Network Models of the Diffusion of Innovations (Hampton Press, Cresskill, NJ)
- [75] Schelling T C, 1973 J. Conflict Resolution 17 381-428
- [76] Glance N S and Huberman B A, 1993 J. Math. Sociol. 17 281-302
- [77] Watts D J, 2002 Proc. Natl. Acad. Sci. USA 99 5766-5771
- [78] Kleinberg J, 2007 Algorithmic Game Theory chapter 24 Cascading behavior in networks: Algorithmic and economic issues (Cambridge University Press) 613-632
- [79] Dodds P S and Watts D J, 2004 Phys. Rev. Lett. 92 218701
- [80] Daley D J and Kendall D G, 1964 Nature 204 1118
- [81] Zanette D H, 2001 Phys. Rev. E 64 050901(R)
- [82] Liu Z, Lai Y C and Ye N, 2003 Phys. Rev. E 67 031911
- [83] Moreno Y, Nekovee M and Vespignani A, 2004 Phys. Rev. E 69 055101(R)
- [84] Moreno Y, Nekovee M and Pacheco A F, 2004 Phys. Rev. E 69 066130
- [85] Krapivsky P L and Redner S, 2003 Phys. Rev. Lett. 90 238701
- [86] Fontes L R, Schonmann R H and Sidoravicius V, 2002 Comm. Math. Phys. 228 495
- [87] Castellano C, Vilone D and Vespignani A, 2003 Europhys. Lett. 63 153
- [88] Sood V and Redner S, 2005 Phys. Rev. Lett. 94 178701
- [89] Morris S, 2000 Review of Economic Studies 67 57-78
- [90] Blume L, 1993 Games and Economic Behavior 5 387-424
- [91] Ellison G, 1993 Econometrica 61 1047-1071
- [92] Young H P, 1998 Individual Strategy and Social Structure: An Evolutionary Theory of Institutions (Princeton University Press)
- [93] Freeman L C, 1979 Social Networks 1 215-239
- [94] Friedkin N E, 1991 Am. J. Sociol. 1478-1504
- [95] Sabidussi G, 1966 Psychometrika 31 581-603
- [96] Dangalchev C, 2006 Physica A 365 556-564
- [97] Boguná M, Krioukov D and Claffy K C, 2008 Nat. Phys. 5 74-80
- [98] Brandes U, 2008 Social Networks 30 136-145
- [99] Estrada E, 2007 Ecological Complexity 4 48-57
- [100] Martín González A M, Dalsgaard B and Olesen J M, 2010 Ecological Complexity 7 36-43
- [101] Zuo X N, Ehmke R, Mennes M, Imperati D, Castellanos F X, Sporns O and Milham M P, 2012 Cerebral Cortex 22 1862-1875
- [102] Wang J, Mo H, Wang F and Jin F, 2011 Journal of Transport Geography 19 712-721
- [103] Abbasi A, Hossain L and Leydesdorff L, 2012 Journal of Informetrics 6 403-412
- [104] Floyd R W, 1962 Communications of the ACM 5 345
- [105] Johnson D B, 1977 Journal of the ACM (JACM) 24 1-13
- [106] Brandes U, 2001 J. Math. Sociol. 25 163-177
- [107] Bonacich P, 1972 J. Math. Sociol. 2 113-120
- [108] Newman M E J, 2008 The new palgrave encyclopedia of economics 2 1-12
- [109] Brin S and Page L, 1998 Computer networks and ISDN systems 30 107-117
- [110] Chen P, Xie H, Maslov S and Redner S, 2007 Journal of Informetrics 1 8-15
- [111] Walker D, Xie H, Yan K K and Maslov S, 2007 J. Stat. Mech. P06010
- [112] Schmidt B M and Chingos M M, 2007 PS-WASHINGTON- 40 523
- [113] Chen J, Aronow B J and Jegga A G, 2009 BMC bioinformatics 10 73
- [114] Iván G and Grolmusz V, 2011 Bioinformatics 27 405-407
- [115] Jiang B, Zhao S and Yin J, 2008 J. Stat. Mech. P07008
- [116] Allesina S and Pascual M, 2009 PLoS computational biology 5 e1000494
- [117] Navigli R and Lapata M, 2010 Pattern Analysis and Machine Intelligence, IEEE Transactions on 32 678-692
- [118] Arasu A, Novak J, Tomkins A and Tomlin J, 2002 Proc. 11th Int. World Wide Web Conf., Poster Track 107-117
- [119] Franceschet M, 2011 Communications of the ACM 54 92-101
- [120] Lü L, Zhang Y C, Yeung C H and Zhou T, 2011 PLoS ONE 6 e21202
- [121] Weng J, Lim E P, Jiang J and He Q, 2010 Proc. 3rd ACM Int. Conf. on Web Search and Data Mining 261-270
- [122] Haveliwala T H, 2002 Proc. 11th Int. Conf. on World Wide Web 517-526
- [123] Bollobás B, 1984 Graph Theory and Combinatorics: Proceedings of the Cambridge Combinatorial Conference in Honor of P. Erdós Vol. 35 (Academic)
- [124] Seidman S B, 1983 Social Networks 5 269-287
- [125] Carmi S, Havlin S, Kirkpatrick S, Shavitt Y and Shir E, 2007 Proc. Natl. Acad. Sci. USA 104 11150-11154
- [126] Batagelj V and Zaversnik M, 2003 arXiv:cs/0310049
- [127] Christakis N A and Fowler J H, 2010 PLoS ONE 5 e12948
- [128] Castellano C and Pastor-Satorras R, 2012 Sci. Rep. 2 371
- [129] Borge-Holthoefer J and Moreno Y, 2012 Phys. Rev. E 85 026116
- [130] Zeng A and Zhang C J, 2013 Phys. Lett. A 377 1031-1035
- [131] Basaras P, Katsaros D and Tassiulas L, 2013 Computer April 24-29
- [132] Klemm K, Serrano M Á, Eguíluz V M and Miguel M S, 2012 Sci. Rep. 2 292
- [133] Travençolo B A N and da F Costa L, 2008 Phys. Lett. A 373 89-95
- [134] Viana M P, Batista J L B and Costa L F, 2012 Phys. Rev. E 85 036105
- [135] Brush S G, 1967 Rev. Mod. Phys. 39 883
- [136] Dorogovtsev S N, Goltsev A V and Mendes J F F, 2002 Phys. Rev. E 66 016104
- [137] Holley R A and Liggett T M, 1975 Ann. Prob. 643-663
- [138] Acebrón J A, Bonilla L L, Vicente C J P, Ritort F and Spigler R, 2005 Rev. Mod. Phys. 77 137
- [139] Bauer F and Lizier J T, 2012 Europhys. Lett. 99 68007
- [140] Lawyer G, 2012 arXiv:1209.6600
- [141] Domingos P and Richardson M, 2001 Proc. 7th ACM SIGKDD Int. Conf. on Knowledge Discovery and Data Mining 57-66
- [142] Kempe D, Kleinberg J and Tardos É, 2005 Automata, languages and programming. Springer Berlin Heidelberg 1127-1138
- [143] Nemhauser G L, Wolsey L A and Fisher M L, 1978 Mathematical Programming 14 265-294
- [144] Leskovec J, Krause A, Guestrin C, Faloutsos C, VanBriesen J and Glance N, 2007 Proc. 13th ACM SIGKDD Int. Conf. on Knowledge Discovery and Data Mining 420-429
- [145] Chen W, Wang Y and Yang S, 2009 Proc. 15th ACM SIGKDD Int. Conf. on Knowledge Discovery and Data Mining 199-208
- [146] Goyal A, Lu W and Lakshmanan L V S, 2011 Proc. 20th Int. Conf. companion on World wide web 47-48
- [147] Goyal A, Lu W and Lakshmanan L V S, 2011 Data Mining (ICDM), 2011 IEEE 11th Int. Conf. on 211-220
- [148] Ben-Zwi O, Hermelin D, Lokshtanov D and Newman I, 2009 Proc. 10th ACM Conf. on Electronic Commerce 355-362
- [149] Wang Y, Cong G, Song G and Xie K, 2010 Proc. 16th ACM SIGKDD Int. Conf. on Knowledge Discovery and Data Mining 1039-1048
- [150] Kimura M, Saito K and Nakano R, 2007 AAAI 7 1371-1376
- [151] Kimura M, Saito K, Nakano R and Motoda H, 2009 Social Computing and Behavioral Modeling 1-8
- [152] Chen W, Wang C and Wang Y. Proc. 16th ACM SIGKDD Int. Conf. on Knowledge Discovery and Data Mining 1029-1038
- [153] Altarelli F, Braunstein A, Dall’Asta L and Zecchina R, 2013 J. Stat. Mech. P09011
- [154] Mézard M and Montanari A, 2009 Information, Physics and Computation (Oxford University Press)
- [155] Altarelli F, Braunstein A, Ramezanpour A and Zecchina R, 2011 J. Stat. Mech. P11009
- [156] Altarelli F, Braunstein A, Ramezanpour A and Zecchina R, 2011 Phys. Rev. Lett. 106 190601
- [157] Liben-Nowell D and Kleinberg J, 2008 Proc. Natl. Acad. Sci. USA 105 4633-4638
- [158] Viswanath B, Mislove A, Cha M and Gummadi K P, 2009 Proc. 2nd ACM Workshop on Online Social Networks 37-42
- [159] Ahn Y Y, Han S, Kwak H, Moon S and Jeong H, 2007 Proc. 16th Int. Conf. on World Wide Web 835-844
- [160] Mislove A, Marcon M, Gummadi K P, Druschel P and Bhattacharjee B, 2007 Proc. 7th ACM SIGCOMM Conf. on Internet Measurement 29-42
- [161] Krishnamurthy B, Gill P and Arlitt M, 2008 Proc. 1st Workshop on Online Social Networks 19-24
- [162] Cha M, Haddadi H, Benevenuto F and Gummadi P K, 2010 ICWSM 10 10-17
- [163] Bakshy E, Hofman J M, Mason W A and Watts D J, 2011 Proc. 4th ACM Int. Conf. on Web Search and Data Mining 65-74
- [164] Kwak H, Lee C, Park H and Moon S, 2010 Proc. 19th Int. Conf. on World Wide Web 591-600
- [165] González-Bailón S, Borge-Holthoefer J, Rivero A and Moreno Y, 2011 Sci. Rep. 1 197
- [166] Backstrom L, Huttenlocher D, Kleinberg J and Lan X, 2006 Proc. 12th ACM SIGKDD Int. Conf. on Knowledge Discovery and Data Mining 44-54
- [167] Liben-Nowell D, Novak J, Kumar R, Raghavan P and Tomkins A, 2005 Proc. Natl. Acad. Sci. USA 102 11623-11628
- [168] Gruhl D, Guha R, Liben-Nowell D and Tomkins A, 2004 Proc. 13th Int. Conf. on World Wide Web 491-501
- [169] Centola D, 2010 Science 329 1194-1197
- [170] Goel S, Watts D J and Goldstein D G, 2012 Proc. 13th ACM Conf. on Electronic Commerce 623-638
- [171] Aral S and Walker D, 2012 Science 337 337-341
- [172] Muchnik L, Pei S, Parra L C, Reis S D S, Andrade Jr J S, Havlin S and Makse H A, 2013 Sci. Rep. 3 1783
- [173] Sun E, Rosenn I, Marlow C and Lento T M, 2009 ICWSM 146-153
- [174] Bakshy E, Karrer B and Adamic L A, 2009 Proc. 10th ACM Conf. on Electronic commerce 325-334
- [175] Aral S, Muchnik L and Sundararajan A, 2009 Proc. Natl. Acad. Sci. USA 106 21544-21549
- [176] Centola D and Macy M, 2007 Am. J. Sociol. 113 702-734
- [177] Goldenberg J, Libai B and Muller E, 2001 Marketing Letters 12 211-223
- [178] Jackson M O and Lopez-Pintado D, 2011 arXiv:1111.0073
- [179] Aral S, Muchnik L and Sundararajan A, 2013 Network Science Forthcoming